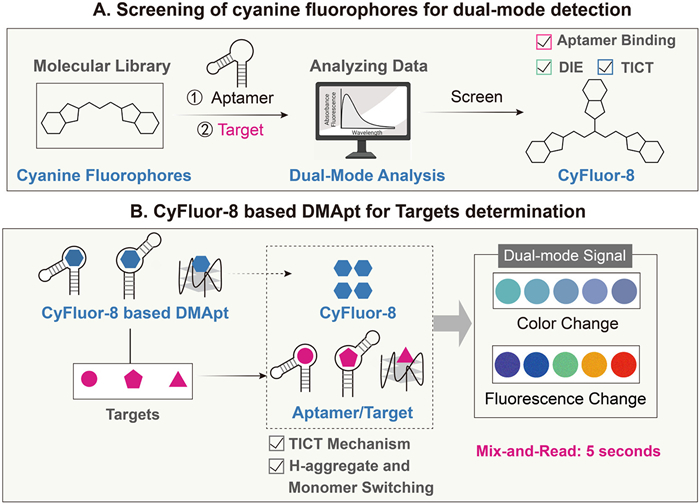
Scheme 1.
(A) Screening of cyanine fluorophores for dual-mode detection. (B) The DMApt for the detection of small molecules and metal ions.

Development of a dual-mode aptasensor platform for fluorescent and colorimetric detection of multiple targets
Yi Cao , Qi Pang , Dandan Zhang , Zhengkun Xie , Jiaheng Zhang


Aptamers, single-stranded nucleic acid sequences (either DNA or RNA), are selected through in vitro techniques and have emerged as crucial molecular recognition tools due to their ability to adopt highly specific and dynamic three-dimensional structures [1,2]. These structures facilitate high-affinity binding to target molecules, with their interactions governed by non-covalent forces such as hydrogen bonds, electrostatic interactions, π-π stacking, and van der Waals forces [3–5]. These properties provide several advantages, including programmability, reproducibility, and cost-effectiveness, which make aptamers indispensable in diverse applications, including biosensing, diagnostics, therapeutics, and drug delivery systems [6–9].
Aptasensors have made substantial progress in target detection, with applications expanding across fields such as environmental monitoring, clinical diagnostics, and food safety [10–12]. Strategies to enhance the sensitivity and specificity of these sensors are numerous. One common approach is the dye-displacement assay [13], wherein a dye molecule is initially bound to the aptamer. The introduction of a target molecule displaces the dye, generating a detectable optical signal. This method benefits from using native, unmodified aptamers, which generally exhibit stronger binding affinities compared to engineered variants, thus improving assay sensitivity [14–16]. Moreover, dye-displacement aptasensors are cost-effective, easy to implement, and offer high sensitivity, making them ideal for a range of biosensing applications. However, traditional dye-displacement aptasensors often rely on single-mode signal outputs, which can limit detection accuracy and reliability. To address these limitations, dual-mode detection strategies have been developed, integrating multiple signal outputs to improve both sensitivity and robustness. For example, dual-mode fluorescent-colorimetric detection of ochratoxin A (OTA) using coumarin-benzothiazole molecules has shown promise by combining the high sensitivity of fluorescence with the visual simplicity of colorimetric detection [17]. While this approach holds potential, further clarification of the underlying principles is required, and its wider applicability is yet to be fully explored. Additionally, the observed color change is often less pronounced than desired, underscoring the need for detection methods that are both versatile and universally applicable.
Cyanine dyes, small organic molecules known for their exceptional fluorescence properties, are commonly employed in the design of optical probes [18,19]. These dyes typically carry a positive charge, forming strong electrostatic interactions with nucleic acids [20–22]. Additionally, these conformational changes are often accompanied by alterations in the aggregation state of the dyes, enhancing their performance in various sensing techniques [13,23]. As a result of these unique properties, cyanine dyes have found widespread application in both in vitro detection and intracellular nucleic acid imaging. In the application field of sensing, significant contributions from the research groups of Stojanovic [24] and Xiao [13,16,23] have advanced the use of cyanine dyes (Cy7 and MTC) in dye-displacement aptasensors for target molecule detection, providing valuable insights that have guided subsequent innovations in this field. The fluorescence properties of these cyanine dyes have not been extensively investigated in dye-displacement aptasensors, although MTC is well established as a dual-mode G-quadruplex probe with fluorescence and colorimetric signals [25–28].
In this study, we present a dual-mode aptasensor (DMApt) platform that combines fluorescence and colorimetric signals for highly sensitive target detection (Scheme 1). The platform utilizes CyFluor, selected from a library of eight cyanine fluorophores, with 17β-estradiol (E2) chosen as the model target for optimization. Following an evaluation of both fluorescence and colorimetric responses, CyFluor-8 was identified as the most effective probe. Upon the introduction of E2, the interaction between CyFluor-8 and the E2 aptamer (AptE2) leads to a distinct color change from green to purple, along with a significant shift in fluorescence intensity. This detection process is both simple and rapid, requiring only the mixing of CyFluor-8, AptE2, and the target molecule. The resulting color shift and fluorescence change are visible within 5 s, making the platform both user-friendly and efficient. Proof-of-principle experiments confirm that dual-mode detection is facilitated by the disaggregation-induced emission (DIE) and twisted intramolecular charge-transfer (TICT) molecular mechanisms. Leveraging the rapid response capability of our DMApt system, we developed a smartphone-based visual detection system that enables real-time monitoring of the colorimetric change, thereby enhancing the platform’s accessibility and convenience. To assess the broader applicability of this dual-mode detection system, we tested its performance with five additional targets: quinine (QN), Cu2+, salicylic acid (SA), metronidazole (MNZ), and OTA. The system exhibited promising results across various small molecules and ions, confirming its versatility and robustness across different molecular structures. In conclusion, the dual-mode detection platform developed in this study offers an innovative, adaptable, and efficient method for target detection. Its simplicity, speed, and versatility make it a powerful tool for applications in biosensing, diagnostics, and beyond.
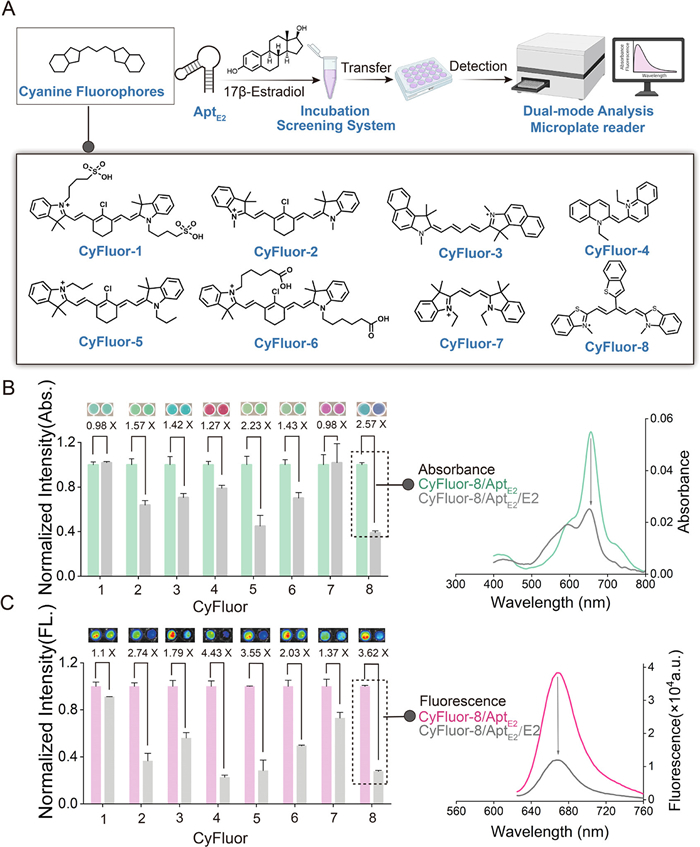
Given the remarkable optical properties and promising potential of cyanine fluorophores, we constructed a CyFluor library comprising eight dyes to develop dual-mode aptasensors with superior performance (Fig. 1A), among these, CyFluor-1 to CyFluor-7 are commercially cyanine dyes (Table S1 in Supporting information), whereas CyFluor-8 was synthesized according to the previous research (Figs. S1 and S2 in Supporting information) [21]. E2, a naturally occurring steroid hormone crucial for various physiological processes in both humans and animals, was selected as model target analyte. The widespread misuse of E2 in medical treatments and animal husbandry has raised substantial concerns regarding environmental contamination and food safety [29,30], underscoring the urgent need for efficient, rapid, and reliable detection methods for E2. To address this need, we utilized the AptE2 aptamer, developed by Liu’s group [31], which demonstrates a dissociation constant (Kd) of 30 ± 14 nmol/L when interacting with E2. The screening was conducted using 8 µmol/L of CyFluor, 4 µmol/L of AptE2, and 30 µmol/L of E2. Upon introducing E2, a distinct color transition from green to purple was observed exclusively with CyFluor-8, accompanied by significant shifts in the absorption spectra. In contrast, no visible color change was detected in solutions containing the other seven dyes (Fig. 1B). In parallel, as shown in Fig. 1C, all dyes exhibited a marked reduction in fluorescence intensity upon the addition of E2, except for CyFluor-1 and CyFluor-7. The absorption and fluorescence spectra of the CyFluor-1 to CyFluor-7 were depicted in Figs. S3–S9 (Supporting information). Among the dyes tested, CyFluor-4 and CyFluor-8 displayed the most pronounced fluorescence changes, with decreases of 77% and 72%, respectively. While CyFluor-4 demonstrated the highest fluorescence signal-to-noise ratio, its colorimetric response and absorption shifts were relatively modest. Based on the evaluation of dual-mode signals, CyFluor-8 was identified as the optimal probe for further investigation. Furthermore, fluorescence intensity was analyzed using the IVIS Lumina XR optical imaging system, and the corresponding results are displayed above the bar chart (Fig. 1C).
To further investigate the critical role of the CyFluor in dual-mode detection, a comprehensive study was carried out to examine the fluorescence characteristics of CyFluor derivatives and their interactions with nucleic acids. The chemical structure of CyFluor-1 was shown in Fig. 2A, which includes a sulfonic acid group.
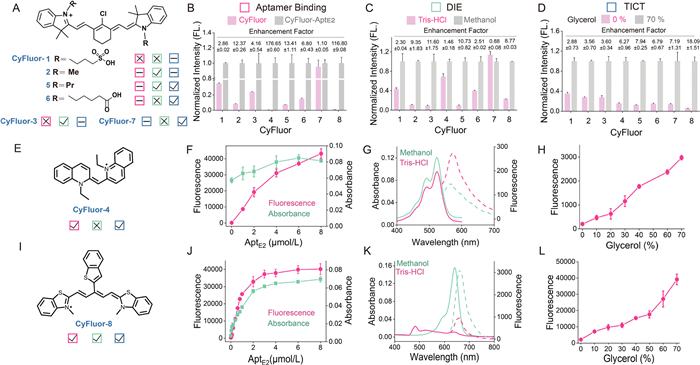
Upon binding to AptE2, CyFluor-1 demonstrated the emergence of a distinct absorption peak at 780 nm, with increased in intensity with nucleic acid binding (Fig. S10 in Supporting information). This enhancement in absorption was accompanied by an increase in fluorescence intensity, shifting from 790 nm to 800 nm, with a 2.86-fold increase in fluorescence intensity (Fig. 2B and Fig. S11 in Supporting information). These results suggest that CyFluor-1 exhibits a relatively weak affinity for nucleic acid. The absorption and fluorescent spectra of CyFluor-1 in buffer and ethanol solutions indicated minimal aggregation in the buffer, and causing a weaker DIE effect (Fig. 2C and Fig. S12 in Supporting information). This minimal aggregation is likely due to the presence of two sulfonic acid groups that enhance its solubility [32]. Additionally, fluorescence intensity showed a moderate increase with increasing viscosity, indicating a moderate TICT effect (Fig. 2D and Fig. S13 in Supporting information). In contrast, CyFluor-2 and CyFluor-5, in which the sulfonic acid groups were substituted with shorter alkyl groups (methyl and propyl, respectively), the chemical structure of them were depicted in Fig. 2A. The absorbance spectrum exhibited broad H-aggregation peaks and monomer peaks near 780 nm in aqueous solution (Fig. 2C, Figs. S16 and S25 in Supporting information). The addition of AptE2 significantly enhanced the monomer peak and fluorescence intensity, suggesting that nucleic acids disrupt the H-aggregation of these molecules (Fig. 2B, Figs. S14 and S15, S23 and S24 in Supporting information). As a result, CyFluor-2 and CyFluor-5 demonstrated weak colorimetric signals for target detection. These derivatives also exhibited more pronounced TICT effect than CyFluor-1 (Fig. 2D, Figs. S13, S17 and S26 in Supporting information), resulting in 3.56-fold and 7.94-fold fluorescence enhancements, respectively. The observed fluorescence enhancement is attributed to a combination of DIE effect, and the TICT mechanism.
CyFluor-6, another negatively charged derivative, demonstrated behavior similar to CyFluor-1 but with weaker aggregation and nucleic acid binding abilities (Figs. 2B and C, and Figs. S27–S29 in Supporting information). Despite showing a noticeable viscosity response, its detection performance was suboptimal (Fig. 2D and Fig. S30 in Supporting information). In summary, although four CyFluor derivatives share a common molecular scaffold, the substituents at different positions significantly influence their photophysical properties and detection performance. CyFluor-1 and CyFluor-6, both containing negatively charged substituents, exhibited weaker aggregation tendencies and lower nucleic acid binding affinities. CyFluor-2 and CyFluor-5, which favor aggregation and exhibit enhanced nucleic acid binding, demonstrated better target detection performance (Figs. 2B and C). These findings suggest that cyanine fluorophores form aggregates in aqueous solutions, and the introduction of nucleic acids induces a transition to monomeric structures. This transition plays a key role in efficient dual-mode detection, with the TICT effect further amplifying the overall signal (Fig. 2D). Furthermore, CyFluor-3, which shares photophysical properties with CyFluor-2, demonstrated comparable detection performance, supporting this hypothesis (Figs. S18–S21 in Supporting information).
CyFluor-4 exhibited intriguing behavior during E2 detection. The chemical structure of CyFluor-4 was shown in Fig. 2E. Upon nucleic acid binding, fluorescence intensity at 550 nm increased dramatically, with an enhancement factor of up to 176.65-fold, indicating highly efficient binding (Fig. 2F and Fig. S24B in Supporting information). However, due to its smaller conjugated structure, CyFluor-4 did not exhibit aggregation in aqueous solution, even weaker than CyFluor-1 (Fig. 2G). Additionally, nucleic acid binding did not significantly alter its absorption spectrum (Fig. 2F and Fig. S22A in Supporting information). Furthermore, CyFluor-4 also showed a significant TICT effect (Fig. 2H). These results highlight the critical role of nucleic acids in modulating the aggregation state of cyanine fluorophores, which is essential for generating colorimetric signals. Moreover, CyFluor-7 exhibited minimal binding to nucleic acids (Figs. S31 and S32 in Supporting information). In Tris-HCl or methanol, its absorption spectra are nearly identical (Fig. S33 in Supporting information). Despite possessing stronger TICT characteristics, it failed to enable dual-mode detection, further emphasizing the importance of nucleic acid binding and DIE effect for effective detection (Fig. S34 in Supporting information).
A special molecular structure was possessed by CyFluor-8, and the rotor-π structure was formed by its cyanine skeleton and benzothiophene group (Fig. 2I) [21]. The absorption spectrum of CyFluor-8 initially displayed a peak at 486 nm, which underwent a notable redshift of approximately 170 nm, shifting to a sharp peak at 656 nm upon interaction with AptE2. This spectral shift reached a plateau when the nucleic acid and CyFluor-8 concentration were adjusted to 4 µmol/L and 8 µmol/L, respectively. Concomitant with the red shift in absorbance, the solution’s color transitioned from blue to green, a distinct visual change (Fig. 2J and Fig. S35 in Supporting information). Fluorescence analysis indicated that, with increasing AptE2 concentration, the emission at 670 nm progressively intensified, ultimately saturating at a concentration of 4 µmol/L (Fig. 2J and Fig. S36 in Supporting information). In methanol, CyFluor-8′s absorption spectrum displayed a characteristic cyanine absorption band between 634 and 649 nm, which closely aligned with the absorption spectrum of the CyFluor-8/AptE2 complex (Fig. 2K). These observations support the hypothesis that CyFluor-8 initially forms H-aggregates in solution, which dissociate into monomers upon binding to the aptamer.
Additionally, CyFluor-8 exhibited increased fluorescence in methanol, suggesting that the fluorescence intensity is directly related to the extent of aggregation. Notably, even in methanol, the fluorescence intensity of CyFluor-8 monomers was lower than that of the CyFluor-8/AptE2 complexes, suggesting that aggregation-induced quenching alone does not account for the observed fluorescence changes (Fig. 2K). As the viscosity of the medium increased, CyFluor-8’s fluorescence intensity was notably enhanced, surpassing that observed in ethanol and approaching the intensity seen in the CyFluor-8/AptE2 complex (Fig. 2L).
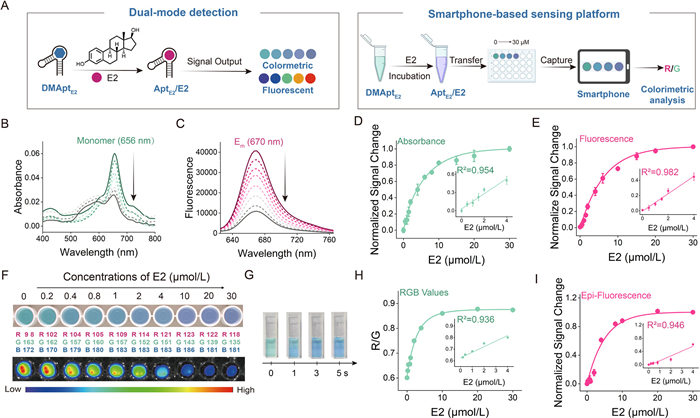
These results highlight the need to examine how dual-mode detection performance is influenced by affinity, DIE, and TICT, which are in turn regulated by structural features. DIE is a key determinant of colorimetric signal generation. A molecule must both exhibit sufficient aggregation in solution and achieve effective aptamer binding to switch between aggregated and monomeric states. For example, CyFluor-2, -3, and -5 display weak binding to nucleic acids and thus cannot efficiently convert into monomers, resulting in poor colorimetric performance. Conversely, CyFluor-4 binds the aptamer but lacks DIE characteristics, producing only fluorescence. TICT is not strictly necessary for fluorescence generation, as DIE is often accompanied by enhanced emission, but it can further promote fluorescence and improve signal robustness. For instance, CyFluor-8 exhibits much stronger fluorescence upon aptamer binding compared with its monomeric state in ethanol, suggesting that TICT helps reduce interference from factors that affect aggregation but do not sufficiently restrict intramolecular rotation. These properties are strongly structure-dependent: smaller conjugated frameworks (CyFluor-4 and -7) aggregate less effectively; negatively charged substituents (e.g., CyFluor-1 and -6 vs. CyFluor-2 and -5) hinder aggregation and reduce aptamer binding due to electrostatic repulsion with nucleic acids; and the unique tripod-like structure of CyFluor-8 enhances TICT and aggregation, while also facilitating π–π stacking with nucleic acids. Although preliminary, these correlations highlight key structural factors that can inform the rational design of future functional dyes. The detection performance of the DMApt for E2 was further investigated in detail (Fig. 3A). The results demonstrated a 65% decrease in absorbance at 656 nm, indicating that E2 displaced the dye and induced aggregation (Fig. 3B). Furthermore, as E2 concentration increased, the fluorescence intensity of DMAptE2 at 670 nm consistently decreased by 77% (Fig. 3C). Detailed analysis of the data revealed linear correlations between normalized signal changes and E2 concentrations at lower levels. Specifically, a linear relationship was observed for E2 concentrations ranging from 0 to 4 µmol/L. For absorbance, the linear equation was y = 0.03002 + 0.12502x, with a correlation coefficient (R2) of 0.954, with an instrumental limit of detection (LOD) of 0.46 µmol/L. For fluorescence, the equation was y = −0.00644 + 0.11507x, R2 = 0.982, and the LOD was calculated to be 0.11 µmol/L (Figs. 3D and E). These displacement and aggregation events occurred rapidly, enabling the visual detection of E2 at low micromolar concentrations through a distinct green-to-purple color transition. To monitor the color change as a function of varying E2 concentrations, a smartphone camera was used, with red-green-blue (RGB) values captured using the Color Picker app. The results revealed a steady increase in the R and B values, while G value decreased consistently (Fig. 3F). A visible color transition was detectable to the naked eye at approximately 0.4 µmol/L E2. The reaction took only 5 s to complete, with a noticeable color change observed (Fig. 3G). A linear relationship between the equivalent R/G (Red/Green) values and E2 concentrations was established. For E2 concentrations between 0 and 4 µmol/L, the linear equation was y = 0.62508 + 0.04828x, with an R2 = 0.936 (Fig. 3H). Fluorescence intensity measurements, performed using the IVIS Lumina XR optical imaging system, revealed a gradual decline in fluorescence intensity (Fig. 3F). A detailed analysis indicated that, a linear relationship was observed for E2 concentrations ranging from 0 µmol/L to 4 µmol/L. The obtained linear equation was y = -0.029 + 0.14637x, R2 = 0.946 (Fig. 3I).
To evaluate the selectivity of DMAptE2 for other compounds, a comprehensive investigation was conducted involving a variety of potential endocrine disruptors and other substances, including 17α-ethynylestradiol, medroxyprogesterone acetate, cortisol, bisphenol A, thymidine, dopamine, and progesterone (Fig. 4A). The results demonstrate that both fluorescence and colorimetric detection modes exhibit remarkable selectivity for E2 (Figs. 4B and C, and Fig. S38 in Supporting information). This high level of selectivity is attributed to the precise and high-affinity recognition of E2 by the aptamer, which effectively prevents the binding of other substances to AptE2. Consequently, CyFluor-8 remains bound to the aptamer and is not displaced by other compounds, facilitating the selective detection of E2.
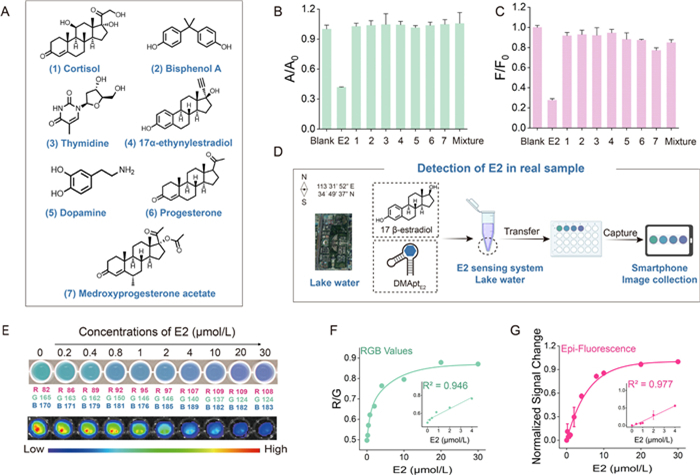
Subsequently, to assess the practical application of DMAptE2 in environmental monitoring, we applied the sensor to determine E2 levels in lake water. Samples were collected from a lake at Zhengzhou University, and after allowing the samples to settle for two hours, the supernatant was extracted for further analysis (Fig. 4D). The results demonstrated that DMAptE2 is capable of detecting E2 in lake water. Upon the addition of E2 into the CyFluor-8/AptE2 complex, both the absorption and fluorescence spectra undergo changes that were comparable in magnitude to those observed in the buffer solution (Fig. S39 in Supporting information). For visual detection, we captured images of the color changes induced by varying E2 concentrations. These results were consistent with those observed in Tris-HCl. The recorded RGB values were in alignment with those measured in the buffer solution (Fig. 4E), and a plot of the R/G ratio against E2 concentrations was generated. A linear relationship was established between E2 concentration (0-4 µmol/L) and the R/G ratio, described by the equation y = 0.52452 + 0.06336x, R2 = 0.946 (Fig. 4F). Fluorescence intensity measurements using the IVIS Lumina XR imaging system showed results consistent with those in the buffer solution (Fig. 4E). The relationship between E2 concentration and normalized fluorescence signal change was found to be linear, with the R2 value of 0.977 (Fig. 4G). These findings further validate the reliability and effectiveness of the DMAptE2 for selective E2 detection in complex environmental samples, confirming its potential for real-world applications.
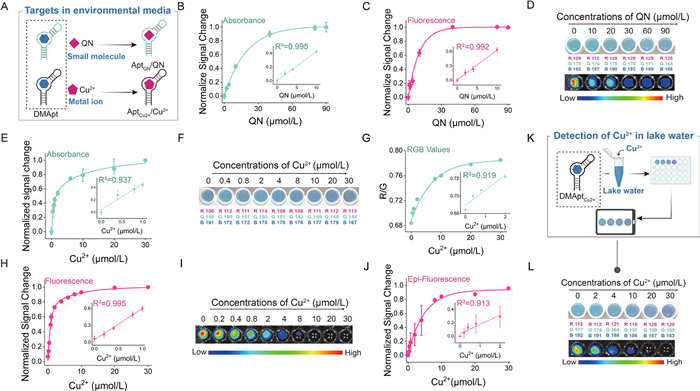
To evaluate the versatility of DMApt for detecting various substances in environmental media, additional targets were tested to validate the mode (Fig. 5A). QN was selected as another small molecule. QN, a plant-derived alkaloid with significant medicinal applications, poses environmental risks due to its slow biodegradation and improper disposal as medical waste, making its detection essential [33,34]. The aptamer used in this study was AptQN [35]. For target detection, solutions were prepared containing 20 µmol/L CyFluor-8 and 6 µmol/L AptQN, and QN concentrations ranging from 0 µmol/L to 90 µmol/L were introduced. As the concentration of QN increased, the absorbance and fluorescence intensity decreased by approximately 38% and 85%, respectively. (Fig. S40 in Supporting information). For absorbance, the linear equation was y = 0.00696 + 0.04197x, with R2 = 0.995, and an instrumental LOD of 2.59 µmol/L. For fluorescence, the equation was y = 0.00779 + 0.06237x, R2 = 0.992, and the LOD was calculated to be 2.04 µmol/L (Figs. 5B and C). Moreover, the solution color changed from green to blue, and RGB values were recorded using the Color Picker app. Fluorescence intensity changes were also monitored with the IVIS Lumina XR optical imaging system (Fig. 5D and Fig. S41 in Supporting information). The selectivity of the sensor was further evaluated with a range of compounds (Fig. S42 in Supporting information), demonstrating that the sensor exhibits excellent selectivity for QN in both colorimetric and fluorescence modes. This selective response highlights the potential of this method for detecting other small molecules in environmental media.
Next, to determine whether the dual-mode detection strategy is limited to small molecules, we explored Cu2+ as an analyte. Cu2+, a common pollutant from industrial activities, represents a significant environmental and health threat. Long-term exposure to elevated concentrations of Cu2+ can cause severe damage to vital organs, making its detection critical [36,37]. The aptamer used for Cu2+ vdetection, AptCu2+, has a Kd of 17.0 µmol/L [38]. We first examined the binding affinity of CyFluor-8 with AptCu2+ by introducing concentrations of AptCu2+ ranging from 0 to 20 µmol/L into a solution of CyFluor-8.
As the concentration of AptCu2+ increased, a clear increase in the intensity of the monomer absorption peak at 656 nm was observed (Fig. S43A in Supporting information). Fluorescence measurements indicated spectral shifts and a concentration-dependent increase in fluorescence intensity at 670 nm (Fig. S43B in Supporting information). To achieve superior analytical performance, we selected 6 µmol/L AptCu2+ and 20 µmol/L CyFluor-8 for Cu2+ quantification within the range of 0–30 µmol/L. The addition of Cu2+ led to a significant decrease in fluorescence intensity, accompanied by a reduction in the 656 nm monomer absorption peak (Fig. S44 in Supporting information). A linear relationship between Cu2+ concentrations (0-1 µmol/L) and the normalized signal changes were observed in both colorimetric and fluorescence modes. The linear equations obtained were y = 0.03931 + 0.42531x (R2 = 0.937) for colorimetric detection and y = 0.04613 + 0.55017x (R2 = 0.995) for fluorescence detection. The LOD for both modes were calculated to be 0.30 µmol/L and 0.23 µmol/L, respectively (Figs. 5E and H).
The dynamic interaction between CyFluor-8 and Cu2+ was further demonstrated by visible color transitions from blue to purple. These color changes were quantified by converting the observed shifts into RGB values. A linear relationship was found between the R/G ratio and Cu2+ concentrations in the range of 0-2 µmol/L, the linear equation was y = 0.68925 + 0.0175x, R2 = 0.919 (Figs. 5F and G). Fluorescence intensity measurements also confirmed the occurrence of competitive reactions (Fig. 5I). Additionally, the concentration of Cu2+ exhibited a linear relationship with the normalized signal change, with the linear range extending from 0 to 2 µmol/L. The linear equation for this range was y = 0.03621 + 0.13925x, R2 = 0.913 (Fig. 5J). The specificity of DMAptCu2+ was evaluated by testing its response to a range of common ions present in aquatic environments, including Cu2+, Pb2+, Ca2+, Ba2+, Co2+, Cu+, Mn2+, Zn2+, Ni2+, Fe2+, Cr3+, and Fe3+. The results demonstrate that both colorimetric and fluorescence detection modes exhibit exceptional selectivity for Cu2+ (Figs. S45 and S46 in Supporting information). Additionally, DMAptCu2+ was successfully employed to detect Cu2+ in real environmental samples (Fig. 5K). Both the absorption and fluorescence spectra change to an extent equivalent to what was detected in MES (2-(N-morpholino)ethanesulfonic acid) Cu2+ was added to the CyFluor-8/AptCu2+ complex (Fig. S47 in Supporting information). For visual detection, images capturing the color changes induced by Cu2+ were taken. Although the R/G values differed slightly from those observed in MES, this variation is likely due to differences in the ionic environment of the actual sample compared to the buffer solution. Fluorescence intensity measurements obtained using the IVIS Lumina XR optical imaging system were consistent with those recorded in MES (Fig. 5L and Fig. S48 in Supporting information) further confirming the suitability of the dual-mode aptasensor for reliable Cu2+ detection in practical applications. In conclusion, the DMApt demonstrates broad applicability, being effective for both small molecules and metal ion detection in environmental media.
To evaluate the practical applicability of our approach for detecting compounds in food matrices, a series of experiments were conducted (Fig. 6A). SA, naturally present in various fruits, can be extracted from plants or synthesized chemically. It regulates plant growth, development, and stress resistance, and offers human health benefits like anti-inflammatory and antioxidant effects. However, excessive intake should be avoided [39,40]. Thus, the capacity for detecting SA at low concentrations holds significant analytical value. A 40-nucleotide DNA aptamer (AptSA) was selected for constructing an aptasensor aimed at detecting SA [41]. Upon introducing the analyte, a notable reduction of 48% in the absorption peak at 656 nm in the absorption spectrum was observed. Similarly, fluorescence measurements revealed a 40% decrease in the emission peak at 670 nm (Fig. S49 in Supporting information). For absorbance, the linear equation was y = −0.02213 + 0.07448x, R2 = 0.993, and an instrumental LOD of 0.96 µmol/L. For fluorescence, the equation was y = 0.00221 + 0.02293x, R2 = 0.987, and the LOD was calculated to be 4.17 µmol/L (Figs. 6B and C). Furthermore, a colorimetric change was observed, with the solution transitioning from blue to purple. RGB values were captured using a smartphone, and the R/G ratio. Additionally, fluorescence imaging using the IVIS Lumina XR optical imaging system demonstrated a significant decrease in fluorescence, indicating competitive displacement after SA addition (Fig. 6D and Fig. S50 in Supporting information). Importantly, the sensor exhibited a high degree of selectivity for SA detection, further confirming its potential for real-world applications (Fig. S51 in Supporting information).
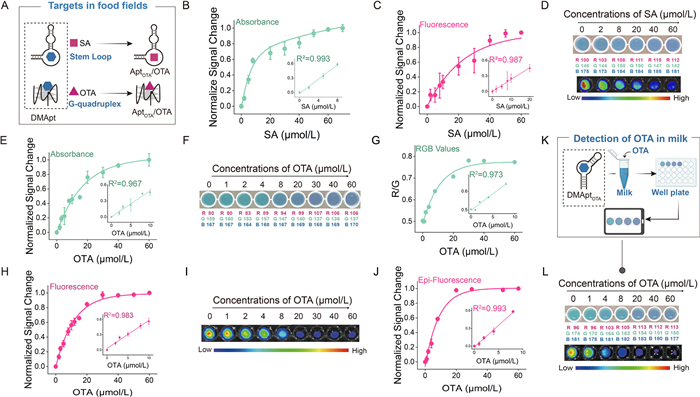
MNZ, a widely utilized antibiotic, is often illicitly incorporated into daily diet, raising concerns about its potential impact on human health. This underscores the importance of developing efficient detection methods for MNZ [42,43]. A 42-nucleotide MNZ-specific aptamer (AptMNZ) was identified and employed to design an aptasensor for MNZ quantification [44]. Upon the introduction of MNZ, significant changes were observed in both absorbance (40% variation) and fluorescence (50% variation) signals. For absorbance, the linear equation was y = 0.02576 + 0.01774x, R2 = 0.923, and an instrumental LOD of 1.43 µmol/L. For fluorescence, the equation was y = 0.04387 + 0.04618x, R2 = 0.958, and the LOD was calculated to be 0.92 µmol/L (Figs. S52 and S53 in Supporting information). These changes were captured using a smartphone, and the RGB values corresponding to the color shift were recorded. The presence of MNZ induced a noticeable darkening of the solution color, transitioning from blue. The R/G ratio exhibited a gradual increase (Fig. S54 in Supporting information). Fluorescence measurements, performed with the IVIS Lumina XR optical imaging system, revealed a clear reduction in fluorescence, suggesting competitive binding events upon MNZ addition (Fig. S55 in Supporting information). Furthermore, selectivity experiments demonstrated that the DMApt displayed excellent specificity for MNZ, with consistent performance in both colorimetric and fluorescence detection modes (Fig. S56 in Supporting information). These findings confirm the versatility of the DMApt, which holds promise for applications in environmental monitoring as well as food safety assessments. We further evaluated the performance of our strategy for detecting aptamer-based targets with diverse structural characteristics using AptOTA, an aptamer that adopts a G4 conformation, for the detection of OTA (Fig. 6A). OTA, a potent mycotoxin primarilyproduced by penicillium and aspergillus species, is found in a varietyof agricultural products, including coffee, barley, wheat, fruits, andvegetables. Given its significant toxicity, OTA poses serious healthrisks, thereby making its detection in food products a critical concern [45,46]. We first explored the interaction between 20 µmol/L CyFluor-8 and OTA-specific aptamers (AptOTA) [47] over a concentration range of 0 µmol/L to 20 µmol/L (Fig. S57 in Supporting information). To enhance the stability of the absorbance profile, we selected a combination of 20 µmol/L CyFluor-8 and 6 µmol/L AptOTA for further OTA quantification, with concentrations ranging from 0 µmol/L to 60 µmol/L (Fig. S58 in Supporting information). Both colorimetric and fluorescence detection modes demonstrated linear responses to OTA at lower concentrations, as confirmed by the dual-mode detection data. The linear equation was determined to be y = 0.00234 + 0.04852x, R2 = 0.967. The LOD was calculated to be 0.96 µmol/L (Fig. 6E). Similarly, in fluorescence mode, a linear relationship was observed for the 0 µmol/L to 10 µmol/L concentration range, the corresponding linear equation was y = 0.03015 + 0.05506x, R2 = 0.983 and a LOD of 0.84 µmol/L (Fig. 6H), indicating a robust correlation between the normalized signal change and OTA concentration. To further evaluate the sensor’s performance, we captured the solution’s color change using a smartphone and converted the observed shift into RGB values (Fig. 6F). The R/G ratio showed a strong linear relationship with OTA concentrations from 0 µmol/L to 8 µmol/L, with the R2 value of 0.973 (Fig. 6G). Notably, a distinct color change was observed when the OTA concentration reached approximately 8 µmol/L. Fluorescence intensity changes were also monitored and analyzed (Fig. 6I). In the concentration range from 0 µmol/L to 8 µmol/L, the normalized fluorescence signal changes displayed a strong linear correlation with OTA concentration, yielding an R2 value of 0.993 (Fig. 6J).
Next, we assessed the selectivity of DMAptOTA by testing its response to other potential mycotoxins, including Zearalenone, Aflatoxin B1, and Patulin. The results demonstrated remarkable selectivity for OTA, confirming the robustness of DMAptOTA in the highly selective detection of target mycotoxins (Fig. S59 in Supporting information). Furthermore, we applied the dual-mode detection method to OTA detection in milk (Fig. 6K). Both colorimetric and fluorescent detection modes provided reliable analytical results, consistent with those obtained in the buffer solution Upon the addition of OTA into the CyFluor-8/AptOTA complex, both the absorption and fluorescence spectra undergo changes that were comparable in magnitude to those observed in Tris-HCl (Fig. S60 in Supporting information). For visual detection, images of the OTA-induced color change (shifting from green to purple) were captured, and the R/G values corresponded to those observed in the buffer solution. Fluorescence changes detected by the IVIS Lumina XR optical imaging system were also in good agreement with those observed in the Tris-HCl (Fig. 6L and Fig. S61 in Supporting information), indicating the feasibility of the dual-mode aptasensor for accurate OTA detection in practical applications. In summary, this DMApt was not only suitable for the detection of small molecular compounds in the environment but also has good detection effect for samples in the food field. These results highlight the method’s versatility and robustness across various nucleic acid secondary structures, underscoring its potential for broad applications in both environmental and food safety monitoring.
This work introduces the DMApt platform, a sophisticated dual-mode aptasensor that integrates both fluorescent and colorimetric signals for the sensitive detection of target analytes. Through an extensive screening of a cyanine dye library, CyFluor-8 was identified as the most effective probe for this system, exhibiting superior specificity, efficiency, and rapid detection capabilities. The dual-mode approach improves accuracy and reliability by providing two independent signal outputs for cross-verification. The colorimetric signal enables simple, on-site detection, while the NIR fluorescence signal reduces interference from complex matrices, ensuring high precision. Comprehensive studies suggest that the performance of this sensor is primarily driven by two key mechanisms: DIE and TICT, both of which significantly enhance the sensor’s sensitivity. The DMApt platform demonstrates broad utility, effectively detecting a wide range of targets, including those critical to food safety and environmental monitoring. Its adaptability is further underscored by its ability to detect a variety of nucleic acid secondary structures, broadening its potential for scalable applications across diverse scientific disciplines. Key advantages of the DMApt system include its label-free operation, low-cost implementation, user-friendly design, and exceptional sensitivity. A notable feature of the platform is its rapid detection capability, with results available in as little as 5 s and advancements highlight the platform’s substantial potential for efficient, portable monitoring in a wide array of practical applications. However, it should also be noted that CyFluor-8 does not perform equally well with all aptamers, and its performance appears to depend on the structure of the aptamer. Compact or folded motifs with accessible binding pockets are more favorable, as they can accommodate the large conjugated framework of CyFluor-8 and enable π–π stacking as well as electrostatic interactions. While these correlations remain preliminary, they suggest that predictive guidelines may be established, and future studies integrating structural prediction tools and tailored dye libraries could further improve probe–aptamer matching. Together, these insights underscore the robustness and versatility of the DMApt platform, while also providing a framework for further optimization and broader applicability in next-generation sensing systems.
The authors declare that they have no known competing financial interests or personal relationships that could have appeared to influence the work reported in this paper.
Yi Cao: Writing – original draft, Investigation, Formal analysis, Data curation. Qi Pang: Formal analysis, Data curation. Dandan Zhang: Formal analysis, Data curation. Zhengkun Xie: Writing – review & editing, Project administration, Funding acquisition. Jiaheng Zhang: Writing – review & editing, Project administration, Methodology, Funding acquisition.
This work was supported by the National Natural Science Foundation of China (Nos. 22304165, 22209153), the China Postdoctoral Science Foundation (No. 2023M743169), Key Technologies R&D Program of Henan Province (No. 252102310181).
Supplementary material associated with this article can be found, in the online version, at doi:
O. Alkhamis, C. Byrd, J. Canoura, et al., Nucl. Acids Res. 53 (2025) gkaf219. doi: 10.1093/nar/gkaf219
A. Brown, J. Brill, R. Amini, C. Nurmi, Y. Li, Angew. Chem. Int. Ed. 63 (2024) e202318665. doi: 10.1002/anie.202318665
T. Hermann, D.J. Patel, Science 287 (2000) 820–825. doi: 10.1126/science.287.5454.820
H. Yu, O. Alkhamis, J. Canoura, Y. Liu, Y. Xiao, Angew. Chem. Int. Ed. 60 (2021) 16800–16823. doi: 10.1002/anie.202008663
C. Xie, L.A. Eriksson, R.B. Zhang, Nucl. Acids Res. (2020) 6471–6480. doi: 10.1093/nar/gkaa428
H. Ma, J. Liu, M.M. Ali, et al., Chem. Soc. Rev. 44 (2015) 1240–1256. doi: 10.1039/C4CS00357H
L. Wu, Y. Wang, X. Xu, et al., Chem. Rev. 121 (2021) 12035–12105. doi: 10.1021/acs.chemrev.0c01140
P. Yin, M. Ge, S. Xie, et al., Chem. Sci. 14 (2023) 14131–14139. doi: 10.1039/d3sc04957d
A. Mokhtarzadeh, M. Tabarzad, J. Ranjbari, et al., Trac. Trends Anal. Chem. 82 (2016) 316–327. doi: 10.1016/j.trac.2016.06.018
R. Tian, J. Sun, Y. Ye, X. Lu, X. Sun, Trac. Trends Anal. Chem. 175 (2024) 117710. doi: 10.1016/j.trac.2024.117710
K. Chen, S. Liu, Y. Zhou, G. Zhao, Environ. Sci. Technol. 59 (2025) 5736–5746. doi: 10.1021/acs.est.4c12923
C. Erkmen, G. Aydoğdu Tığ, G. arrazza, B. Uslu, Trac. Trends Anal. Chem. 154 (2022) 116675. doi: 10.1016/j.trac.2022.116675
O. Alkhamis, J. Canoura, K.V. Bukhryakov, et al., Angew. Chem. Int. Ed. 61 (2022) e202112305. doi: 10.1002/anie.202112305
H. Yu, W. Yang, O. Alkhamis, et al., Nucl. Acids Res. 46 (2018) e43. doi: 10.1093/nar/gky026
O. Alkhamis, J. Canoura, C. Willis, et al., J. Am. Chem. Soc. 145 (2023) 12407–12422. doi: 10.1021/jacs.3c03640
J. Canoura, O. Alkhamis, M. Venzke, P.T. Ly, Y. Xiao, JACS Au 4 (2024) 1059–1072. doi: 10.1021/jacsau.3c00801
Y. Mou, Y. Zhang, M. Chen, et al., Sensor. Actuat. B: Chem. 408 (2024) 135529. doi: 10.1016/j.snb.2024.135529
W. Sun, S. Guo, C. Hu, J. Fan, X. Peng, Chem. Rev. 116 (2016) 7768–7817. doi: 10.1021/acs.chemrev.6b00001
J. Yuan, H. Yang, W. Huang, et al., Chem. Soc. Rev. 54 (2025) 341–366. doi: 10.1039/d3cs00585b
A. Kitamura, J. Tornmalm, B. Demirbay, et al., Nucl. Acids Res. 51 (2023) e27. doi: 10.1093/nar/gkac1255
L. Guan, Y. Zhou, X. Li, et al., Anal. Chem. 95 (2023) 9288–9296. doi: 10.1021/acs.analchem.3c01153
J. Han, J. Li, X. Luo, G. Feng, J. Zhang, Coord. Chem. Rev. 520 (2024) 216157. doi: 10.1016/j.ccr.2024.216157
X. Jin, Y. Liu, O. Alkhamis, et al., Anal. Chem. 94 (2022) 10082–10090. doi: 10.1021/acs.analchem.2c01095
M.N. Stojanovic, D.W. Landry, J. Am. Chem. Soc. 124 (2002) 9678–9679. doi: 10.1021/ja0259483
Q. Yang, J. Xiang, S. Yang, et al., Nucl. Acids Res. 38 (2010) 1022–1033. doi: 10.1093/nar/gkp1045
Q. Yang, J. Xiang, S. Yang, et al., Anal. Chem. 82 (2010) 9135–9137. doi: 10.1021/ac1017716
R. Sun, H. Sun, X. Ye, et al., Sensor. Actuat. B: Chem. 408 (2024) 135524. doi: 10.1016/j.snb.2024.135524
H. Sun, R. Sun, D. Yang, et al., J. Am. Chem. Soc. 146 (2024) 22736–22746. doi: 10.1021/jacs.4c07698
J. Yao, X. Feng, S. Wang, Y. Liang, B. Zhang, Anal. Chem. 96 (2024) 18029–18036. doi: 10.1021/acs.analchem.4c03429
L. Zhang, D. Liu, A. Wang, et al., Anal. Chem. 97 (2025) 6594–6599. doi: 10.1021/acs.analchem.4c06302
C. Niu, C. Zhang, J. Liu, Environ. Sci. Technol. 56 (2022) 17702–17711. doi: 10.1021/acs.est.2c05808
H. Chen, T. Borjigin, C. Regeard, et al., Small 19 (2023) e2300772. doi: 10.1002/smll.202300772
X. Sun, H. Liu, Z. Dai, et al., Food Chem. 469 (2025) 142317. doi: 10.1016/j.foodchem.2024.142317
H.Q. Yuan, Y. Yuan, S.Y. Liu, et al., J. Hazard. Mater. 489 (2025) 137458. doi: 10.1016/j.jhazmat.2025.137458
M. Datta, Y.A. Kaiyum, P.E. Johnson, J. Liu, Chem. Eur. J. 31 (2025) e202403435. doi: 10.1002/chem.202403435
H. Yu, S. Liu, J. Fan, et al., Anal. Chem. 97 (2025) 1799–1808. doi: 10.1021/acs.analchem.4c05616
P. An, Z. Zhang, J. Yang, et al., Anal. Chem. 95 (2023) 13456–13462. doi: 10.1021/acs.analchem.3c01174
J. Wang, Y. Liu, X. Li, H. Lei, J. Liu, Chem. Commun. 60 (2024) 14272–14275. doi: 10.1039/d4cc05410e
F. Zhang, M. Li, H. Li, et al., Carbon 175 (2021) 364–376. doi: 10.1016/j.carbon.2021.01.110
N. He, Q. Wei, Y. Li, et al., Biosens. Bioelectron. 257 (2024) 116329. doi: 10.1016/j.bios.2024.116329
L. Gu, H. Zhang, Y. Ding, et al., Smart Mol. 1 (2023) e20230007. doi: 10.1002/smo.20230007
K. Aslam, S. Bilal, S. Mir, et al., Food Chem. 460 (2024) 140297. doi: 10.1016/j.foodchem.2024.140297
W.D. Adane, B.S. Chandravanshi, M. Tessema, Chemosphere 359 (2024) 142279. doi: 10.1016/j.chemosphere.2024.142279
J. Wang, X. Li, H. Lei, J. Liu, Analyst 149 (2024) 5482–5490. doi: 10.1039/d4an01186d
L. Song, X. Cao, Y. Yang, et al., Anal. Chem. 97 (2025) 4217–4223. doi: 10.1021/acs.analchem.4c06658
X. Xie, X. Yang, Y. Zhang, et al., Biosens. Bioelectron. 259 (2024) 116401. doi: 10.1016/j.bios.2024.116401
P.S. Deore, M.D. Gray, A.J. Chung, R.A. Manderville, J. Am. Chem. Soc. 141 (2019) 14288–14297. doi: 10.1021/jacs.9b06533

Scheme 1 (A) Screening of cyanine fluorophores for dual-mode detection. (B) The DMApt for the detection of small molecules and metal ions.

Figure 1 Screening of cyanine dyes for dual-mode colorimetric and fluorescent detection. (A) Schematic of the screening procedure, including the structural formulas of the eight cyanine-based dyes utilized in the selection process. (B) Normalized bar chart illustrating changes in absorbance before and after target addition, with absorption normalized intensity calculated using specific peaks: CyFluor-1, 2, 5, and 6 at 780 nm; CyFluor-3 at 690 nm; CyFluor-4 at 540 nm; CyFluor-7 at 550 nm and CyFluor-8 at 656 nm. (C) Normalized bar chart illustrating changes in fluorescence before and after target addition, with normalized fluorescence intensity calculated using emission peaks: CyFluor-1, 2, 5, and 6 at 800 nm; CyFluor-3 at 700 nm; CyFluor-4 at 545 nm; CyFluor-7 at 565 nm and CyFluor-8 at 670 nm. Data are presented as mean ± standard deviation (SD) (n = 3). Also shown are the absorbance and fluorescence spectra of the CyFluor-8/AptE2 complex, along with those upon incorporation of E2 (30 µmol/L) into the complex. Green curve: absorption spectrum (0 µmol/L E2); red curve: fluorescence spectrum (0 µmol/L E2); gray curves: absorption and fluorescence spectra (30 µmol/L E2), respectively.

Figure 2 Interaction of CyFluor with AptE2 and its photophysical properties. (A) Structural formulas of CyFluor-1, 2, 5 and 6. (B) Normalized bar chart illustrating the fluorescence changes before and after the addition of the AptE2 (8 µmol/L). (C) Normalized bar chart illustrating the fluorescence changes in Tris-HCl and methanol. (D) Normalized bar chart illustrating the fluorescence changes in 0% and 70% glycecol. (E) Structural formulas of CyFluor-4. (F) Absorbance and fluorescence titration assay of CyFluor-4 with increasing concentrations of AptE2. (G) Absorbance (solid line) and fluorescence (dotted line) spectra of CyFluor-4 in methanol (green) and Tris-HCl (red). (H) Fluorescence intensity of CyFluor-4 in a mixture of H2O and glycerol. (I) Structural formulas of CyFluor-8. (J) Absorbance and fluorescence titration assay of CyFluor-8 with increasing concentrations of AptE2. (K) Absorbance (solid line) and fluorescence (dotted line) spectra of CyFluor-8 in methanol (green) and Tris-HCl (red). (L) Fluorescence intensity of CyFluor-8 in a mixture of H2O and glycerol. For Figs. 2B-D, F, H, J, and L, data are presented as mean ± standard deviation (SD) (n = 3).

Figure 3 (A) Schematic illustration of E2 using the dual-mode aptasensor and the construction of smartphone-based sensing platform. The absorbance (B) and fluorescence (C) spectra were recorded after the stepwise addition of E2, with a AptE2 concentration of 4 µmol/L. From top to bottom, the concentrations of E2 were 0, 1, 2, 4, 6, 10, 20, and 30 µmol/L, respectively. Normalized change in signal for (D) absorbance and (E) fluorescence intensity was monitored during E2 detection, utilizing 8 µmol/L CyFluor-8 and 4 µmol/L AptE2; the inset shows the linear relationship at low target concentrations. (F) RGB values derived from solutions of CyFluor-8/AptE2 complex at varying E2 concentrations, along with the fluorescence intensity changes measured using the IVIS Lumina XR optical imaging system. (G) Time-dependent images of the color change upon the addition of E2 into CyFluor-8/AptE2 complex. (H) R/G value curve as a function of E2 concentration, with the inset showing the linear relationship at low concentrations. (I) Normalized fluorescence signal change as the E2 concentration increased, with the inset showing the linear relationship at low concentrations. For Figs. 3D, E, H and I, data are presented as mean ± standard deviation (SD) (n = 3).

Figure 4 (A) Structural representations of the molecules employed in the selectivity test. (B) Selective absorbance assays and (C) fluorescence assays for E2 and its chemical analogues. (D) Schematic of the construction process for the dual-mode aptasensor designed for E2 detection in lake water. (E) RGB values derived from real sample solutions of the CyFluor-8/AptE2 complex, incubated with varying concentrations of E2, demonstrating the linear correlation between E2 concentration and the R/G ratio, as well as fluorescence intensity variations with different E2 concentrations, measured using the IVIS Lumina XR optical imaging system. (F) R/G value curve as a function of E2 concentration, with the inset highlighting the linear relationship at low concentrations. (G) Normalized fluorescence signal change as the E2 concentration increased, with the inset showing the linear correlation at low target concentrations. For Figs. 4B, C, F and G, data are presented as mean ± standard deviation (SD) (n = 3).

Figure 5 (A) Schematic diagram of the DMApt for targets in environment media. Normalized signal change in (B) absorbance and (C) fluorescence intensity as shown for the detection of QN, with the inset depicting the linear relationship at low target concentrations. (D) RGB values and fluorescence intensity changes derived from solutions containing varying concentrations of QN. Normalized signal change in (E) absorbance and (I) fluorescence intensity for Cu2+ detection, with the inset highlighting linear relationship at low concentrations. (F) RGB values derived from the solutions with different Cu2+ concentrations. (G) Plot of the R/G values as a function of Cu2+ concentrations, with the inset showing the linear relationship at low concentrations. (I) Fluorescence intensity changes as a function of Cu2+ concentration, measured using IVIS Lumina XR optical imaging system. (J) Normalized fluorescence signal change with the increasing Cu2+ concentration, with the inset depicting normalized signal changes at low concentrations. (K) Schematic representation of Cu2+ detection in lake water. (L) Colorimetric and fluorescent detection of Cu2+ in lake water. For Figs. 5B, C, E, G, H and J, data are presented as mean ± standard deviation (SD) (n = 3).

Figure 6 (A) Schematic illustration of the DMApt designed for targets detection in food-related applications. Normalized signal change in (B) absorbance and (C) fluorescence intensity as shown for the detection of SA, with the inset depicting the linear relationship at low target concentrations. (D) RGB values and fluorescence change derived from solutions with varying concentrations of SA. Normalized signal change in (E) absorbance and (I) fluorescence intensity for the detection of OTA with the inset showing the linear relationship at low target concentrations. (F) RGB values derived from solutions containing varying concentrations of OTA. (G) Plot of the R/G values as a function of OTA concentrations, with the inset depicting the R/G values at low target concentrations. (H) Fluorescence intensity changes as the OTA concentration increases, measured using the IVIS Lumina XR optical imaging system. (J) Normalized fluorescence signal change as the OTA concentration increases, with the inset showing the normalized signal change at low target concentrations. (K) Scheme of OTA detection in milk. (L) Colorimetric and fluorescent detection of OTA in milk. For Figs. 6B, C, E, G, H and J, data are presented as mean ± standard deviation (SD) (n = 3).

 扫一扫看文章


扫一扫关注我们
 DownLoad:
 下载:
下载:
 下载:
下载: