Received Date:
28 September 2017 Revised Date:
20 November 2017 Available Online:
10 March 2018
Abstract:
LuF3:Yb3+, Er3+ microcrystals codoped with Yb3+nYB3+/nLu3+=5%~15%) and Er3+ ions (nEr3+/nLu3+=1%~5%) were synthesized by a facile hydrothermal process at different pH values. It is found that the pH value has a crucial effect on synthesis of the orthorhombic phase LuF3:Yb3+, Er3+. Under 980 nm excitation, LuF3:Yb3+, Er3+ phosphors exhibit strong green upconversion (UC) emission bands centered at 523 (2H11/2→4I15/2) and 539 nm (4S3/2→4I15/2) and weak red emissions near 660 nm (4F9/2→4I15/2). The optimum doping concentrations of Er3+ and Yb3+ for the highest emission intensity were determined by using X-ray diffraction (XRD) and photoluminescence (PL) analyses. Concentration dependent studies reveal that the optimal composition is 10% Yb3+ and 2% Er3+ co-doping concen-tration with a strong green emission. A possible UC mechanism for LuF3:Yb3+, Er3+ depends on the pump power is discussed. The temperature dependence of the fluorescence intensity ratios (FIR) for the two green UC emission bands peaked at 523 and 539 nm was studied in the range of 293~573 K under excitation by a 980 nm diode laser and the maximum sensitivity was approximately 15.3×10⁻⁴ K-1 at 490 K. This indicates that LuF3:Yb3+, Er3+ phosphors are potential candidates for optical temperature sensors with high sensitivity.
Rare-earth (RE) ion doped luminescence upco-nversion (UC) materials have attracted much attention owing to their wide application prospects in solid-state lasers[1], luminescence display panels[2-3], solar cells[4-6], biological labels[7], biological imaging[8], and optical temperature sensors[9-10]. Recently, applying these UC materials as temperature sensing medium has attracted great attention[11-17]. In this application, the optical temp-erature sensors based on the fluorescence intensity ratio (FIR) technique as a noninvasive thermometry are considered to be an alternative candidate to replace traditional temperature sensors because they can be operated in some harsh environments such as electrical power stations, building fire detection, oil refineries. Furthermore, the FIR technique which takes the advantage of temperature dependence of two thermally coupled energy levels of RE ions, can reduce the dependence of measurement conditions and improve the sensitivity[18-19].
Erbium ion (Er3+) has attracted much attention due to its unique electric energy level structures. The lifetimes of some intermediate energy levels of Er3+ are long enough. Thus, Er3+ ion is a promising competitor for UC luminescence center. Green UC luminescence of Er3+ ion hold a pair of thermally coupled emission levels (2H11/2 and 4S3/2), whose emission intensity ratio would vary with environment temperature. It is well known that the 2H11/2→4I15/2 transition of Er3+ is hyper-sensitive, and the temperature sensitivity of the materials varies remarkably for Er3+ ions in different hosts[8-24]. Therefore, finding a host capable to provide suitable crystal field environment surrounding Er3+ dopant to enhance radiative probability of the 2H11/2→4I15/2 hypersensitive transition is a key for obtaining high temperature sensitivity of Er3+.
Binary rare earth fluorides (REF3) have been considered as an excellent luminescent rigid host matrix for various optically active lanthanide ions (Ln3+), because they normally possess a high refractive index and low phonon energy (< 400 cm-1), which leads to the low probability of nonradiative decay and consequently the luminescence quantum yields are usually higher than in oxide hosts and in most inorganic matrixes. Recently, several chemical synthesis techni-ques to prepare Ln3+ doped REF3 phosphors are avail-able such as thermal decomposition[25], coprecipitation reaction[26], hydrothermal method[27]. Among all the methods for the synthesis of Ln3+ doped REF3 phos-phors, hydrothermal method has been proven to be an effective and convenient wet chemistry technique. During the hydrothermal process, chemical reactions are carried out under autogenous pressure and at temperatures above the boiling point of water in the autoclave[28]. Moreover, the size distribution of particles, phase compositions, and morphologies can be easily controlled by modifying the reaction conditions such as reaction temperature, pH value, and the starting materials. However, to the best of our knowledge, there is little or no investigation on the UC emission and temperature sensing performances of LuF3:Yb3+, Er3+ microcrystals prepared by hydrothermal method without any surfactant. We report here the hydrothermal synthesis of the Yb3+/Er3+ co-doped LuF3 microcrystals and determine how synthetic parameter can influence the textural and optical properties of the resulting UC materials. The luminescence properties of LuF3:Yb3+, Er3+ microcrystals are investigated by changing doping concentrations of Yb3+ (and Er3+) ions in the host. Additionally, their thermometry behaviors have also been illustrated by FIR technique.
1.
Experimental
1.1
Sample preparation
All the chemicals of Lu2O3 (99.99%), Er2O3 (99.99%), Yb2O3 (99.99%), NaF (AR), HNO3 and NaOH were used as the starting materials without any further purification. LuF3:Yb3+, Er3+ samples for different Yb3+ doping concentration (5%~15%) with a fixed Er3+ concentration (2%) and Er3+ doping concentration (1%~5%) with a fixed Yb3+ concentration (10%) were prepared by the hydrothermal method without employ-ing any surfactants. A typical procedure for the LuF3:Yb3+, Er3+ (Yb10%, Er2%) sample synthesis as an example is described as follows: 0.350 2 g Lu2O3, 0.039 4 g Yb2O3 and 0.007 6 g Er2O3 were first disso-lved in dilute nitric acid under heating. After the Lu2O3, Yb2O3 and Er2O3 were completely dissolved, the extra nitrite acid was removed by evaporation. Then deionized water was added to obtain Lu(NO3)3, Yb(NO3)3 and Er(NO3)3 mixed solution. Meanwhile 0.335 9 g NaF (nRE(NO3)3:nNaF=1:4) was dissolved in deionzed water while stirring. Second, the obtained NaF solution was slowly added into the above solution with magnetic stirring. Afterward the pH value of the solution was adjusted via using nitric acid or NaOH. The resultant milky colloidal suspension was transferred into a 100 mL Teflon-lined stainless-steel autoclave, sealed and heated to 180 ℃ for 21 h. Finally, the autoclave was cooled to room temperature naturally, and the products were deposited at the bottom of vessel. The precipitate was separated by centrifugation and washed three times with absolute alcohol. After being dried in air at 80 ℃ for 12 h, the final powder products were obtained. Other phosphor samples were prepared by the same procedure, except for changing Ln(NO3)3 and the pH value.
1.2
Characterization
X-ray diffractometer (XRD) patterns of samples were examined on a X′Pert PRO (PANalytical) powder diffractometer with Cu Kα (λ=0.150 465 nm, 40 kV, 40 mA) radiation to identify the crystal phase. The XRD data within the range from 10° to 80° were recorded in a scanning mode with a step size of 0.02° and a step scanning time of 8 s for Rietveld refinement. The morphology of the samples was characterized by a JSM6700F scanning electron microscope (SEM) operated at 10 kV and a JEOL-2010 transmission electron microscope (TEM) equipped with the energy dispersive X-ray spectrum (EDS) operated at 200 kV. In order to investigate the temperature dependence of the UC emission, the sample was placed in a temperature-controlled copper cylinder, and its temperature was increased from 293 to 573 K. The UC spectra of sample at various temperatures were obtained using a Fluorolog-3 double monochromator equipped with a Hamamatsu R928 Photomultiplier under the excitation of a 980 nm diode laser with 150 mW (the power density is about 3 W·cm-2).
2.
Results and discussion
2.1
Effect of the pH for solution on the crystal structure
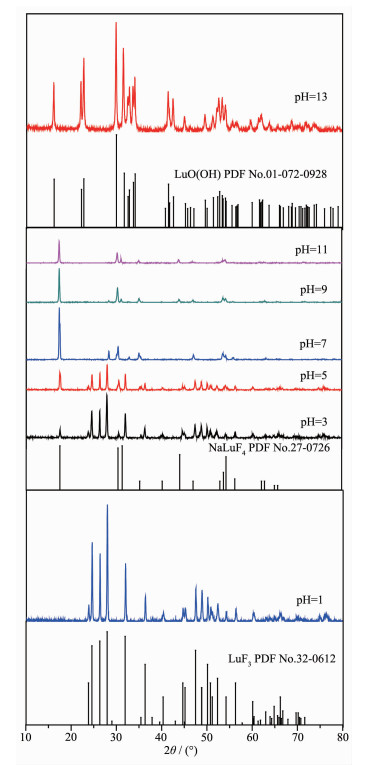
The crystallinity and phase purity of the as-prepared samples are examined with XRD. Fig. 1 shows XRD patterns of the as-obtained samples at 180 ℃ for 21 h with different pH values in comparison to the standard card. As shown in Fig. 1, it is obvious that all diffraction peaks of the product obtained at the mixed solution of pH=1 could be clearly indexed to the pure orthorhombic phase LuF3 (PDF No.32-0612). When the pH value of the mixed solution is 3, it is clearly seen that other impurity phase (hexagonal NaLuF4 PDF No.27-0726) emerged. With the pH value of the mixed solution continuing to increase to 7, it is clearly seen that NaLuF4 is the main phase. With the pH value of the mixed solution increasing until 13, it is clearly seen that the diffraction peaks of the product matched well with the standard data of monoclinic LuO(OH) (PDF No.01-072-0928). The above-stated results indicate that the pH value is very important for preparing the pure orthorhombic phase LuF3.
图 1
图 1
XRD patterns for as-obtained sample with different pH values; Standard data for LuF3 (PDF No.32-0612) is also presented in the figure
Figure 1.
XRD patterns for as-obtained sample with different pH values; Standard data for LuF3 (PDF No.32-0612) is also presented in the figure
Rietveld refinement is an effective method to analyze the position of atoms in a primitive cell. In order to evaluate the structural parameters of LuF3:10%Yb3+, 2%Er3+, structural refinement was carried out by the TOPAS (total pattern analysis solutions) program using the Rietveld method. Fig. 2 gives the experimental and refined XRD patterns of the LuF3:10%Yb3+, 2%Er3+ sample. The black crosses and red solid line represent the experimental and calculated patterns, respectively. The pink vertical lines show the positions of the simulated diffraction patterns. The difference between the experimental and calculated results is plotted by the blue line at the bottom. By comparing the calculated data with the experimental data, we find that each peak is in good agreement. There is no impurity phase found in the samples, which reveals that it is a good single phase. The Rietveld refinement analysis indicates the values (Rp=5.28% and Rwp=6.77%, where Rp is the residual obtained by directly calculating the XRD spectrum calculated from the model structure and the experimental data and Rwp is the weight to specific position, which are within the accepted error range, indicating that the refinement results and the above assumption are reliable. According to the literature, the Yb3+ and Er3+ ions occupy the site of Lu3+ ions. In order to further evaluate the occupying sites of the doping ions of Yb3+ and Er3+, structural refinement was also carried out on LuF3:10%Yb3+, 2%Er3+, as shown in Fig. 2. The resulting crystallographic data of LuF3:10%Yb3+, 2%Er3+ are summarized in Table 1. The atomic coordinates and site occupancy fraction (SOF) are presented in Table 2.
图 2
图 2
XRD refinement result for the LuF3:10%Yb, 2%Er sample, showing the Bragg reflection positions, the observed and calculated XRD profiles, and the difference between the observed and calculated patterns
Figure 2.
XRD refinement result for the LuF3:10%Yb, 2%Er sample, showing the Bragg reflection positions, the observed and calculated XRD profiles, and the difference between the observed and calculated patterns
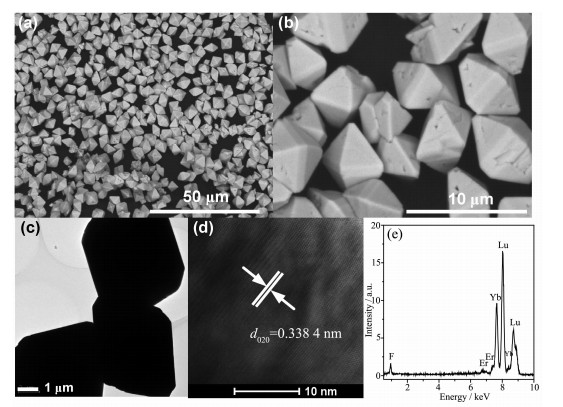
A low-magnification SEM image (Fig. 3a) of the LuF3:10%Yb3+, 2%Er3+ sample shows that the morp-hology is octahedral-like structure with good unifor-mity and dispersity. Fig. 3b a high magnification SEM image of the prepared powders. As can be seen in these images, the LuF3:10%Yb3+, 2%Er3+ sample show smooth and the particle size is about 4.5 μm. Morpho-logical observation by transmission electron micros-copy (TEM) is also shown in Fig. 3c. The TEM image of the Yb3+/Er3+ co-doped LuF3 sample indicates the particle size is 4.5 μm, which accords well with the result of SEM. Combining with the high resolution TEM image (HRTEM) (Fig. 3d), it can be clearly seen that the lattice fringes show the imaging characteristics in which the orthorhombic structure LuF3 crystal where the interplanar spacing of 0.338 4 nm corresponds to the distance of the (020) plane. The EDS was used to further characterize the chemical composition of the as-prepared product, and the results shown in Fig. 3e confirm that element ratios consist with the chemical formula of Yb3+/Er3+ co-doped LuF3 sample for 10%Yb3+ and 2%Er3+, with nYb:nEr:nLu=5:1:44. The results confirm that Yb3+ and Er3+ ions have been effectively incorporated into the LuF3 host lattice, agreeing with the XRD analysis above. The above results indicate that the LuF3:Yb3+, Er3+ micorcrystals can be successfully obtained by one-step hydrothermal method.
图 3
图 3
Low-(a) and high-magnification (b) SEM images of LuF3:10%Yb3+, 2%Er3+ sample; (c) TEM image of LuF3:10%Yb3+, 2%Er3+ sample; (d) HRTEM image of LuF3:10%Yb3+, 2%Er3+ sample; (e) EDS data taken from a single particle
Figure 3.
Low-(a) and high-magnification (b) SEM images of LuF3:10%Yb3+, 2%Er3+ sample; (c) TEM image of LuF3:10%Yb3+, 2%Er3+ sample; (d) HRTEM image of LuF3:10%Yb3+, 2%Er3+ sample; (e) EDS data taken from a single particle
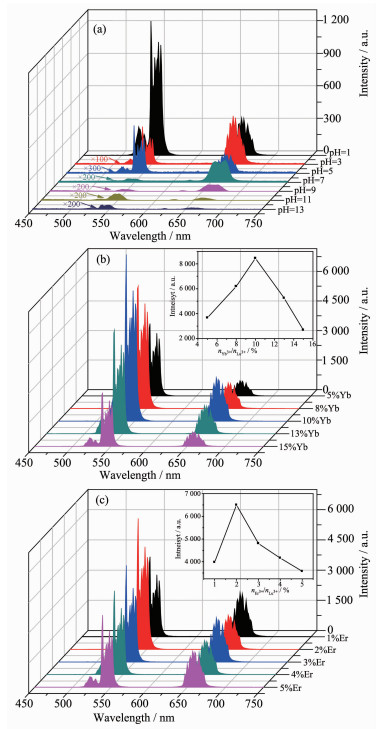
To investigate influence of the synthesis parameter (pH value) on UC emission of as-obtained samples, the UC emission spectra of the as-obtained samples with different pH values are shown in Fig. 4a. It is obvious that green and red UC emissions of the product obtained at the mixed solution of pH=1 is strongest among those of all pH values. When the pH value of the mixed solution is 3, it is clearly seen that UC emission obviously decrease and the relative intensity of green and red light is opposite compared with that of pH=1, which is due to other impurity phase (NaLuF4) emerged. The other impurity phase leads to luminescence quenching. With the increase of the pH value of the mixed solution, UC emissions of the products continually decrease. The increase of the concentration of the other impurity will further lead to luminescence quenching. The above-stated results indicate that the pH value as synthesis parameter is very important for obtaining strong UC emission.
图 4
图 4
UC emission spectra of the LuF3:Yb3+, Er3+ samples for (a) different pH values, (b) different Yb3+ concentrations with a fixed 2%Er3+ and different Er3+ concentrations with a fixed 10%Yb3+ (c) under 980 nm excitation
Figure 4.
UC emission spectra of the LuF3:Yb3+, Er3+ samples for (a) different pH values, (b) different Yb3+ concentrations with a fixed 2%Er3+ and different Er3+ concentrations with a fixed 10%Yb3+ (c) under 980 nm excitation
In order to investigate concentration quenching of Yb3+/Er3+ co-doped LuF3, Fig. 4b and 4c show the dependence of the UC luminescence spectra of the Yb3+/Er3+ co-doped LuF3 phosphors on the sensitizer (Yb3+) and activator (Er3+) concentrations, respectively. Intense green emission at 523 and 539 nm (2H11/2→4I15/2 and 4S3/2→4I15/2 transitions of Er3+) and weak red emi-ssion at 660 nm (4F9/2→4I15/2 transition of Er3+) are observed in the emission spectra. As the concentrations of Er3+ are fixed at 2%, the green emission intensity becomes stronger with the increasing of Yb3+ content and reaches a maximum at 10% in the range of 5%~15%, which is shown in Fig. 4b. The concentration quenching effect appears in this system and results in intensity decreasing as the concentration of Yb3+ over 10%. This is believed to be due to the onset of the quenching effect that transfers the excitation of Er3+ back to Yb3+ and self-quenching in high-Yb3+ doping concentration[29-31]. As the concentrations of Yb3+ are fixed at 10%, the green emission intensity becomes stronger with the increasing of Er3+ content and reaches a maximum at 2% in the range of 1%~5% (Fig. 4c). The concentration quenching effect is caused by the cross-relaxation process among Er3+ ions. The concen-tration quenching will not occur at low concentration, because the distance between identical Er3+ ions is so large that the energy migration is hampered[32]. With the increase of the Er3+ concentration, the average distance between Er3+ ions become shorter and the energy transfer become convenient. The critical distance of which can prevent the energy transfer happening can be calculated by the following formula[33]: Rc=2[3V/(4πNXc)]1/3, where V is the volume of the unit cell, Xc is the critical concentration and N is the number of available crystallographic sites occupied by the activator ions in the unit cell. The values of V and N for the crystalline LuF3 (orthorhombic system, a=0.614 97 nm, b=0.677 08 nm, c=0.448 13 nm, Z=4, V=abc, N=Z) are 0.186 595 nm3 and 4, respectively. Considering the above optimum concentration as the critical concentration Xc, the Rc for Er3+ is 1.645 4 nm in the LuF3:10%Yb3+, 2%Er3+ phosphors.
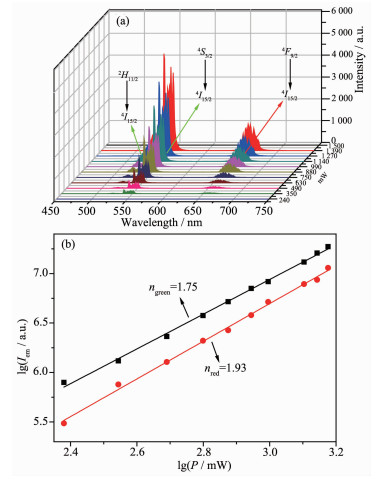
In order to investigate the UC mechanism, pump power-dependence of green and red UC emission spectra in LuF3:Yb3+, Er3+ micorcrystals was measured and displayed in a logarithmic scale (Fig. 5). The emission intensity Iem depends on the excitation power IP following to the relationship of Iem∝IPn, where n is the number of the pumping laser photons required to excite RE ions from the ground state to the emitting excited state. The slopes (n) of the linear fittings are 1.75 for green emission (2H11/2→4I15/2 and 4S3/2→4I15/2) and 1.90 for red emission (4F9/2→4I15/2), indicating that two-photon processes are required to populate the 2H11/2, 4S3/2 and 4F9/2 emitting levels, respectively.
图 5
图 5
(a) UC spectra of LuF3:Yb3+, Er3+ phosphors for different laser powers of 980 nm excitation;
(b) Dependences of the UC intensities (Iem) of green (2H11/2, 4S3/2)→4I15/2 and red 4F9/2→4I15/2 transitions on the 980 nm pumping laser power (Ip) for LuF3:Yb3+, Er3+ phosphors
Figure 5.
(a) UC spectra of LuF3:Yb3+, Er3+ phosphors for different laser powers of 980 nm excitation;
(b) Dependences of the UC intensities (Iem) of green (2H11/2, 4S3/2)→4I15/2 and red 4F9/2→4I15/2 transitions on the 980 nm pumping laser power (Ip) for LuF3:Yb3+, Er3+ phosphors
Fig. 6 displays the energy levels of Yb3+ and Er3+ ions in LuF3:Yb3+, Er3+ micorcrystals aswell as the proposed UC mechanisms. As for Yb3+/Er3+ codoped system under 980 nm excitation, the 980 nm laser photon excites the Yb3+ ion from the 2F7/2 ground state to the 2F5/2 excited state. And the excited Yb3+ ion in the 2F5/2 state transfers it excitation energy to one nearby Er3+ ion. The Er3+ ion at the ground 4I15/2 state is excited to the upper 4F7/2 state via two energy transfer (ET1 and ET2) processes[34]. Subsequently, the non-radiative relaxation process of 4F7/2 state populates two lower energy levels (2H11/2 and 4S3/2), resulting in the green (2H11/2→4I15/2 and 4S3/2→4I15/2) UC emissions. The weak red UC emission centered at 660 nm is originated from 4F9/2→4I15/2 transition. There exist two main possible pumping mechanisms for red emission. The first pumping mechanism is the nonradiative relaxation from the populated 4S3/2 state to the 4F9/2 state through multphonon interaction. In the second pumping mechanism, Er3+ ion can be relaxed from 4I11/2 level to 4I13/2 level, and then excited to 4F9/2 state via ET3 process.
图 6
图 6
Energy level diagrams of Yb3+ and Er3+ ions and UC emission mechanism in LuF3:Yb3+, Er3+ phosphors
Figure 6.
Energy level diagrams of Yb3+ and Er3+ ions and UC emission mechanism in LuF3:Yb3+, Er3+ phosphors
2.3
Effect of temperature on UC emission and temperature-sensing behavior
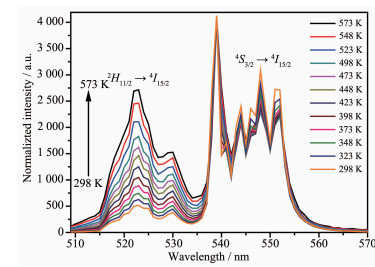
As already mentioned, UC bands centered at 523 and 539 nm arise from 2H11/2→4I15/2 and 4S3/2→4I15/2 transitions. The energy gap between the levels 2H11/2 and 4S3/2 of Er3+ is around 568 cm-1, the state of 2H11/2 may also be populated from 4S3/2 by thermal excitation and the UC emission intensity ratio of emission band at 523 to 539 nm could change with the variable temperature, therefore it is could be used as optically temperature sensor for the present UC phosphors. In order to investigate the temperature sensing properties of as-prepared phosphors, the green UC emission spectra for LuF3:10%Yb3+, 2%Er3+ phosphor at various temperature (from 293 to 573 K) are presented in Fig. 7, in which the spectra are normalized to the emission peak at 539 nm. It is found that no remarkable shift in emission wavelength for the sample while the fluorescence intensity ratio (FIR) of UC emission from 2H11/2→4I15/2 to 4S3/2→4I15/2 increases with the rise of temperature. The relative population of the thermally coupled energy levels follows the Boltzmann distribution and the FIR of two emissions can be written as follows[35]:
where IH and IS are intensities (the integrated areas below the emission curves) for the upper (2H11/2→4I15/2) and lower (4S3/2→4I15/2) thermally coupled levels transi-tions, respectively. In general, N, g, ω, δ represent the number of ions, the degeneracy, the angular frequency, the emission cross section of fluorescence transitions from excited state (2H11/2 and 4S3/2) to the ground state (4I15/2), respectively. ΔE is the energy gap between the 2H11/2 and 4S3/2 levels, k is the Boltzmann constant, and T is the absolute temperature. B is the pre-exponential factor.
The fluorescent intensity ratio (FIR) of these two UC emissions shows a remarkable dependence on the temperature (Fig. 8a). According to the expression of the FIR, the value of Ln(FIR) versus the inverse absolute temperature (1/T) is plotted in Fig. 8b. The linear fitting of the experimental data gave slope and intercept equal to 980.69 and 1.02, respectively. As a conse-quence, the energy gap ΔE and the pre-exponential constant are evaluated to be about 680 cm-1 and 2.77, respectively. These two parameters are vital factors for the sensitivity (S) of temperature detection, as defined by the following equation[35]:
图 8
Upconversion-based temperature-sensing behaviour of LuF3:Yb3+, Er3+ phosphor: (a) FIR relative to the temperature; (b) Monolog plot of the FIR as a function of the inverse absolute temperature; (c) Sensor sensitivity as a function of temperature
Figure 8.
Upconversion-based temperature-sensing behaviour of LuF3:Yb3+, Er3+ phosphor: (a) FIR relative to the temperature; (b) Monolog plot of the FIR as a function of the inverse absolute temperature; (c) Sensor sensitivity as a function of temperature
where the term FIR is the symbol used for fluorescence intensity ratio. The calculated values of sensor sensi-tivity were plotted as a function of absolute tempera-ture (Fig. 8c) and found to be maximum about 15.3×10⁻⁴ K-1 at 490 K. The temperature sensitivity of LuF3:Yb3+, Er3+ phosphor is comparable to that (15.7×10⁻⁴ K-1 at 386 K) of LaF3:Yb3+/Er3+ phosphor[36]. Therefore, the Yb3+/Er3+ co-doped LuF3 micorcrystals can be used as an efficient optical temperature sensor.
3.
Conclusions
In summary, the LuF3:Yb3+, Er3+ microcrystals have been prepared by one-step hydrothermal method at 180 ℃ for 21 h under pH=1. The intense visible UC luminescence of sample is clearly observed under 980 nm excitation. The mechanisms of UC lumine-scence and the changes of the emission intensity with Yb3+ concentration or Er3+ concentration are discussed. The transition mechanisms of the UC luminescence can be ascribed to a two-photon absorption process. The best doping concentration of LuF3 for UC emission is about 10%Yb3+ and 2%Er3+. The green UC emission bands observed around 523 (2H11/2→4I15/2) and 539 nm (4S3/2→4I15/2) have been utilized for optical thermometry via the fluorescence intensity ratio technique. The depen-dence of FIR for the sample LuF3:10%Yb3+, 2%Er3+ with optimal composition on temperature were meas-ured in the range of 293~573 K, and the sensitivities of sample reach the maximum 15.3×10⁻⁴ K-1 at 490 K. All these results suggest that Yb3+/Er3+ co-doped LuF3 phosphor materials can be explored UC fluorescence imaging and temperature measurements with high sensitivity.
Figure 2
XRD refinement result for the LuF3:10%Yb, 2%Er sample, showing the Bragg reflection positions, the observed and calculated XRD profiles, and the difference between the observed and calculated patterns
Figure 3
Low-(a) and high-magnification (b) SEM images of LuF3:10%Yb3+, 2%Er3+ sample; (c) TEM image of LuF3:10%Yb3+, 2%Er3+ sample; (d) HRTEM image of LuF3:10%Yb3+, 2%Er3+ sample; (e) EDS data taken from a single particle
Figure 4
UC emission spectra of the LuF3:Yb3+, Er3+ samples for (a) different pH values, (b) different Yb3+ concentrations with a fixed 2%Er3+ and different Er3+ concentrations with a fixed 10%Yb3+ (c) under 980 nm excitation
Figure 5
(a) UC spectra of LuF3:Yb3+, Er3+ phosphors for different laser powers of 980 nm excitation;
(b) Dependences of the UC intensities (Iem) of green (2H11/2, 4S3/2)→4I15/2 and red 4F9/2→4I15/2 transitions on the 980 nm pumping laser power (Ip) for LuF3:Yb3+, Er3+ phosphors
Figure 8
Upconversion-based temperature-sensing behaviour of LuF3:Yb3+, Er3+ phosphor: (a) FIR relative to the temperature; (b) Monolog plot of the FIR as a function of the inverse absolute temperature; (c) Sensor sensitivity as a function of temperature

 下载:
下载:


 下载:
下载:


 下载:
下载:
