Key Laboratory of Synthetic and Natural Functional Molecule of the Ministry of Education, College of Chemistry & Materials Science, Northwest University, Xi'an 710127, China
b.
Key Laboratory of Resource Biology and Biotechnology in Western China, Ministry of Education, Biomedicine Key Laboratory of Shaanxi Province, Lab of Tissue Engineering, College of Life Sciences, Northwest University, Xi'an 710127, China
c.
Shaanxi Key Laboratory of Earth Surface System and Environmental Carrying Capacity, College of Urban and Environmental Sciences, Northwest University, Xi'an 710127, China
* Corresponding author. E-mail address: lijianli@nwu.edu.cn (J. Li). 1 These authors contributed equally to this work.
Received Date:
07 March 2023 Accepted Date:
23 April 2023 Revised Date:
20 April 2023 Available Online:
15 August 2023
Abstract:
Thiophenol (PhSH) is an important raw material for organic synthesis, while its high toxicity to organisms makes it an environmental pollutant. Therefore, it is crucial to accurately detect PhSH and explore its metabolic process in the living system. Herein, a near-infrared (NIR) fluorescent probe TEM-FB was developed for sensing PhSH with a turn-on fluorescent signal at 719 nm and a large Stokes shift (198 nm) based on generating the intramolecular charge transfer (ICT) process. TEM-FB shows high specificity and significant sensitivity towards PhSH (detection limit: 10 nmol/L) via the aromatic nucleophilic substitution mechanism. Furthermore, it was successfully applied to image PhSH in multiple cell lines and in zebrafish. Notably, we revealed the oxidative stress process caused by PhSH and demonstrated that the hydrogen peroxide (H2O2) in cells would alleviate the poisonousness from exogenous PhSH for the first time. This work provides a promising bioimaging tool for monitoring PhSH in living systems and visualizing the process of oxidative stress induced by PhSH.
Thiophenol (PhSH) is a valuable intermediate in organic synthesis, which is widely utilized in the preparation of pharmaceuticals, agricultural chemicals, and various industrial products [1-5]. However, owing to high volatility, irritation, and toxicity [6,7], PhSH is listed as a priority pollutant by the U.S. Environmental Protection Agency. In biological systems, PhSH can be automatically oxidized to aromatic disulfide, and further induced oxidative stress with the production of harmful superoxide radicals and hydrogen peroxide (H2O2) [8]. Prolonged exposure time (>15 min) of PhSH would cause serious health problems [9], including central nervous system damage, breathing difficulties, vomiting, and even death [10-12]. Generally, the median lethal concentration (LC50) of PhSH to fish ranged from 0.01 mmol/L to 0.4 mmol/L [13], to mice ranged from 2.15 mg/kg to 46.2 mg/kg [14]. Therefore, it is of great significance to develop a high-efficient method to monitor PhSH real-time in environmental and biological samples.
At present, some analytical methods have been reported to determine PhSH, such as high-performance liquid chromatography (HPLC) [15] and ultraviolet–visible (UV–vis) spectroscopy [16]. However, these methods have the disadvantages of time-consuming, low sensitivity, and complex pretreatment. Fluorescent probe is a popular tool for detecting various analytes due to the merit of its imaging capability in situ, superior selectivity, low detection limit, and non-inventiveness [17-25]. Significantly, fluorescent probes can be applied to investigate biological processes by tracking species in real-time within organisms [26-35]. Although many kinds of fluorescent probes have been developed to detect PhSH, some disadvantages still exist, such as low sensitivity, short fluorescence emission wavelength and short Stokes shift [36-54], which hindered their imaging application in the biological system (Table S1 in Supporting information). Given that the near-infrared (NIR) fluorescence features a higher signal-to-noise ratio and deeper tissue penetration [55-65], while the large Stokes shift can effectively reduce the interference caused by spontaneous fluorescence [66-69]. Therefore, it is valuable and desirable to develop PhSH specific fluorescent probe with both NIR emission and large Stokes shift.
Based on the above consideration and our previous work [70,71], herein, we bridged dicyanoisophorone and coumarin derivative to form a NIR fluorophore TEM-OH with a large Stokes shift (198 nm) and designed the fluorescent probe TEM-FB to detect PhSH via regulating intramolecular charge transfer (ICT) process (Fig. 1a). TEM-FB shows high specificity and sensitivity for sensing PhSH as well as exhibits prominent capability of visualizing exogenous PhSH in living cells and in zebrafish. Particularly, this work revealed the oxidative stress process induced by PhSH and proposed that H2O2 would alleviate the poisoning of PhSH (Fig. 1b).
Figure 1
Figure 1.
(a) The designed fluorescent probe TEM-FB for detecting PhSH. (b) Schematic illustration of intracellular oxidative stress process induced by PhSH and the endogenous H2O2 alleviating the poison of PhSH. PMA, an inducer of endogenous ROS.
To develop a NIR fluorescent probe for PhSH, the dicyanoisophorone and the coumarin derivative was conjugated to form a hydroxy‑substituted NIR fluorophore TEM-OH. Then, the typical 2,4-dinitrophenyl was chosen as the fluorescence quenching unit and PhSH recognition unit to construct the target probeTEM-FB due to its strong withdraw-electron capability and potential reactivity to hydrosulfuryl species. TEM-FB was synthesized through a simple procedure (Fig. 2a and Figs. S1–S9 in Supporting information) and its crystal was obtained (Table S2 in Supporting information) (CCDC 2233985) in the solvent of PE/DCM = 1:2. As shown in Fig. 2b, the dihedral angle between the conjugate part plane (α) and the recognition unit plane (β) is 70.14° (θαβ), which would promote to break ICT process. While the dihedral angle between plane γ and δ is measured to be θγδ = 42.66°, and the segments of dicyanoisophorone and coumarin show a certain twist configuration (θαδ = 14.51°), similarly, speculating fluorophore TEM-OH would not an absolute plane structure, thus effectively prevent fluorescence quenching caused by π-π stacking and improve its Stokes shift.
Figure 2
Figure 2.
(a) Synthesis route and (b) the crystal structure of TEM-FB.
Experiments on fluorescence and UV–vis absorbance spectra of TEM-FB were performed in dimethyl sulfoxide/phosphate buffered saline (DMSO/PBS) (4:6, v/v, 10 mmol/L, pH 7.4), which solvent system was selected for the entire optical test because of its high fluorescence intensity (Fig. S10 in Supporting information). The reactivity of TEM-FB towards different analytes (including amino acids, metal ions, reactive sulfur species (RSS), reactive oxygen species (ROS), etc.) was tested. Encouragingly, TEM-FB exhibited a dramatic turn-on fluorescence emission at 719 nm with a 36-fold enhancement of fluorescence intensity only upon addition of PhSH.Simultaneously, the maximum peak of the UV–vis absorbance spectra red-shifted to 521 nm from 425 nm (Figs. 3a and b). Whereas negligible changes occurred in both in fluorescence and UV–vis absorbance upon addition of other species, the fact that even biothiols [cysteine (Cys), homocysteine (Hcy), glutathione (GSH) and NaHS] could not activate fluorescence signal manifests that TEM-FB endows excellent specificity for detecting PhSH. The vivid solution images also showed obvious changes in color and fluorescence before and after the response to PhSH (Fig. 3c). TEM-FB has a low fluorescence quantum yield Φ = 0.008. Upon the interaction of it with PhSH, the quantum yield increases up to Φ = 0.076. In addition, TEM-FB processes a large Stokes shift (~198 nm) (Fig. 3d) in response to PhSH, which can effectively avoid signal interference and fluorescence quenching caused by self-absorption.
Figure 3
Figure 3.
(a) Ultraviolet absorbance and (b) fluorescence spectra of TEM-FB (10 µmol/L) upon the existence of various species (50 µmol/L) in DMSO/PBS (4:6, v/v, 10 mmol/L, pH 7.4). (c) Photographs of TEM-FB in the absence (left) and presence (right) of PhSH. (d) Normalized fluorescence and ultraviolet absorbance spectra of TEM-FB (10 µmol/L) upon the PhSH (50 µmol/L). (e) Fluorescence and (f) ultraviolet absorbance spectra of TEM-FB (10 µmol/L) upon the existence of PhSH (0–150 µmol/L). (g) The pH stability of TEM-FB (10 µmol/L) and TEM-FB (10 µmol/L) in presence of PhSH (50 µmol/L). (h) Fluorescence intensity of TEM-FB (10 µmol/L) in the presence of 1–24 (50 µmol/L) (1. Blank, 2. Lys, 3. Val, 4. Ile, 5. Phe, 6. Tau, 7. Thr, 8. Glu-Na, 9. Tyr, 10. NaCl, 11. PbCl2, 12. FeCl2, 13. Na2SO3, 14. KCl, 15. NaHSO3, 16. AlCl3, 17. NaHS, 18. Na2S, 19. Cys, 20. GSH, 21. Hcy, 22. H2O2, 23. NaClO, 24. PhSH) (Blue columns); the fluorescence intensity of TEM-FB (10 µmol/L) in the presence of PhSH (50 µmol/L) and simultaneously existing 1–24 (50 µmol/L) (Red columns).
To evaluate the quantitative detection capability of TEM-FB for PhSH, the fluorescence and absorbance titration experiment were performed by addition of different concentrations of PhSH (0–150 µmol/L) to TEM-FB. As shown in Fig. 3e, the fluorescence intensity at 719 nm were gradually increased upon addition of PhSH, and it displays an excellent linearity (R2 = 0.9930) against the concentrations of PhSH ranging from 0 to 30 µmol/L. The limit of detection (LOD) was calculated to be 10 nmol/L according to the equation (LOD = 3 σ/k), which approximates to the half effective concentration (EC50) reported in the literature [13]. Moreover, the absorbance at 521 nm also gradually elevated to a plateau until the concentration of PhSH up to 60 µmol/L (Fig. 3f). The results verified the promising quantitative ability of TEM-FB towards PhSH.
The kinetics experiment displayed that the fluorescent intensity (719 nm) of TEM-FB in the presence of PhSH increased rapidly from 0 to 30 min and then tended to be stable for approximately 60 min. Moreover, there almost no obvious changes of TEM-FB at 719 nm within 90 min, which indicates it possesses good stability (Fig. S11 in Supporting information).
To examine the practicability of TEM-FB in complex biological systems, the pH stability and anti-interference property were tested. As shown in Fig. 3g, there were slight changes in fluorescence intensity of TEM-FB, indicating high stability of TEM-FB in a wide pH scope (2.0–12.0). The TEM-FB+PhSH showed a significant fluorescence enhancement during pH = 7.0–9.0, which demonstrated that TEM-FB is effective at the physiological condition. The anti-interference ability of TEM-FB+PhSH upon addition of various other analytes were checked (Fig. 3h). Unexpectedly, the fluorescent intensity fluctuated indistinctively coexisting with all analytes but H2O2, which decreased remarkably. In this regard, we hypothesized that H2O2 may be a scavenger of PhSH.
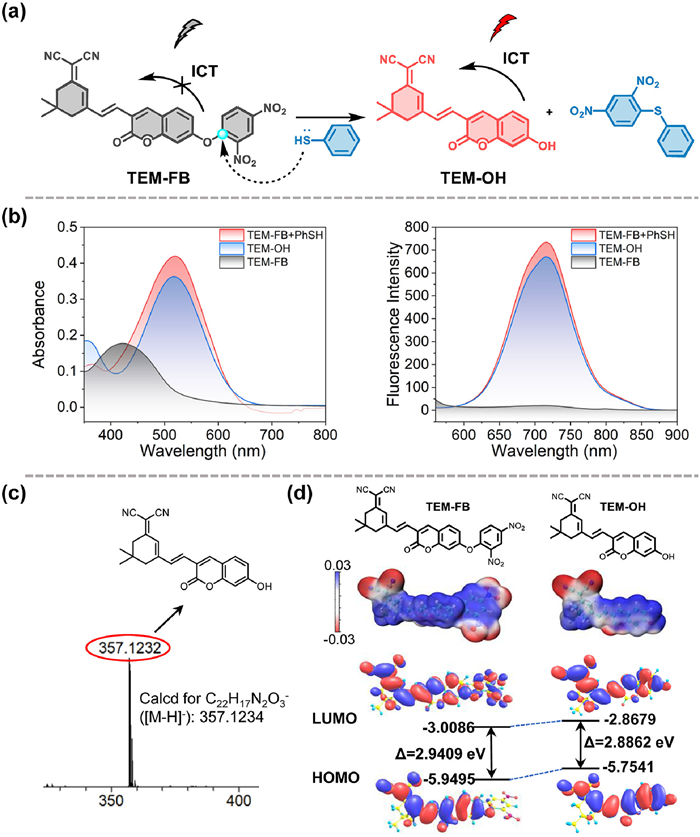
Afterwards, the recognition mechanism was explored. As shown in Fig. 4b, the fluorescence and UV–vis absorbance spectrum of the mixture solution of TEM-FB + PhSH were overlapped with the TEM-OH, indicating that TEM-OH is the production of TEM-FB and PhSH. This result is consistent with the peak at 357.1232 that analyzed by mass spectroscopy (Fig. 4c). Thus, we deduced the sensing mechanism is that PhSH attacks the carbon atom of TEM-FB through nucleophilic aromatic substitution reaction (SNAr) and removes the recognition unit 2,4-dinitrophenyl group, which process would recover ICT characteristic accompanied with a dramatical fluorescence enhancement (Fig. 4a). Subsequently, the responses of TEM-FB to PhSH derivatives were evaluated. The results demonstrated that TEM-FB exhibited a significant response to thiophenol derivatives with electron-donating substituents, while demonstrating a weak or negligible response to those with electron-withdrawing substituents (Fig. S12 in Supporting information). This phenomenon would be attributed to the enhanced nucleophilicity of the sulfhydryl group of thiophenol derivatives with electron-donating substituents, as well as the diminished nucleophilicity of the sulfhydryl group of thiophenol derivatives with electron-withdrawing substituents.
Figure 4
Figure 4.
(a) Proposed reaction mechanism of TEM-FB towards PhSH. (b) Ultraviolet absorbance and fluorescence spectra of TEM-FB (10 µmol/L) upon the existence of PhSH (50 µmol/L). (c) HRMS analysis of the mixture solution of TEM-FB+PhSH. (d) The electrostatic potential and the HOMO/LUMO gaps of TEM-OH and TEM-FB.
Additionally, the electrostatic potential (ESP), the highest occupied molecular orbital (HOMO), and lowest unoccupied molecular orbital (LUMO) distribution of TEM-OH and TEM-FB were calculated to examine their ICT properties by density functional theory (DFT) [72,73]. As shown in Fig. 4d, the ESP of TEM-FB is negative to negative, destroying the push-pull electron system. While this pattern of TEM-OH is negative to positive, exhibiting excellent charge separation (negative in red and positive in blue) and thus it is in accord with ICT process. Furthermore, the HOMO of TEM-FB is merely distributed in the fluorophore unit, while its LUMO distribution are dispersed in fluorophore unit and recognition unit. Differently, both the HOMO and LUMO of TEM-OH are distributed in the conjugate unit, and the gaps of TEM-OH is lower than that of TEM-FB, manifesting that TEM-FB could serve as an ICT-based fluorescent probe.
Inspired by the above results in vitro, we further evaluated the capability of TEM-FB to image intracellular PhSH. First, MTT assay confirmed that TEM-FB almost caused no noticeable toxicity (Fig. S13 in Supporting information). Subsequently, fluorescence imaging in living cells (including normal cells (293T) and cancer cells (A549, HeLa, and HepG2)) were performed (Figs. 5a and b, Fig. S14 in Supporting information). Upon addition of TEM-FB, their displayed significant red fluorescence signals in living A549, HeLa, and HepG2 cells pretreated with PhSH (50 µmol/L). However, the fluorescence intensity in 293T cells were slight and lower than that in other cancer cells, which may be attributed to the low intake capacity of TEM-FB and PhSH by normal cells. Subsequently, HepG2 cells were stained with TEM-FB (30 µmol/L) followed by incubation with PhSH (0, 25, 50, and 75 µmol/L) for 30 min. As shown in Figs. 5c and d, an increased fluorescence intensity was observed with the increased PhSH concentration, which illustrates thatTEM-FB could image different concentration of PhSH in living cancer cells.
Figure 5
Figure 5.
(a) Fluorescence imaging of different living cell lines: 239T cells, A549 cells, HeLa cells, and HepG2 cells treated with PhSH (50 µmol/L) for 30 min before staining with TEM-FB (30 µmol/L) for 30 min. (b) Average fluorescence intensity. Data are presented as the mean ± SD (n = 3). (c) Fluorescence imaging of HepG2 cells treated with different concentrations of PhSH. (0, 25, 50, 75 µmol/L) for 30 min before staining with TEM-FB (30 µmol/L) for 30 min. (d) Average fluorescence intensity. Data are presented as the mean ± standard deviation (SD) (n = 3).
Considering that the fluorescent intensity of TEM-FB for PhSH was greatly decreased in the presence of H2O2in vitro experiments, and to validate our hypothesis mentioned above, we utilized TEM-FB to visualize the distribution of PhSH in the presence of exogenous H2O2 and endogenous H2O2 in living cells, respectively. In contrast with Fig. 6b, there are slight fluorescence signal observed when HepG2 cells treated with exogenous H2O2 or phorbol myristate acetate (PMA, an agent to induce endogenous ROS, including H2O2) in Figs. 6c and d, which similar to cells incubated with TEM-FB only (Figs. 6a and f). It suggested that H2O2 may eliminate PhSH in the living cells and alleviate PhSH poisoning. To investigate whether the toxic PhSH could trigger stress response by oxidative stress process, we examined the fluorescent signals of TEM-FB for PhSH in the living cells and the fixed cells, respectively. The fluorescence intensity in living cells (Fig. 6b) was observed lower than that in fixed cells (Figs. 6e and f), indicating that living cells occurred oxidative stress in the presence of PhSH accompanied with generating endogenous H2O2, while the fixed cells were difficult to occur this process. Consequently, it revealed that H2O2 could alleviate PhSH poisoning by an oxidative stress process.
Figure 6
Figure 6.
Fluorescence imaging of HepG2 cells in different conditions (a) HepG2 cells were incubated with TEM-FB (30 µmol/L) for 30 min. (b) HepG2 cells were pretreated with PhSH (50 µmol/L) for 30 min before staining with TEM-FB (30 µmol/L) for 30 min. (c) HepG2 cells were pretreated with H2O2 (50 µmol/L) for 30 min and treated with PhSH (50 µmol/L) for 30 min before staining with TEM-FB (30 µmol/L) for 30 min. (d) HepG2 cells were pretreated with PMA (10 µg/mL) for 30 min and then treated with PhSH (50 µmol/L) for 30 min before staining with TEM-FB (30 µmol/L) for 30 min. (e) Fixed cells were pretreated with PhSH (50 µmol/L) for 30 min before incubating with TEM-FB (30 µmol/L) for 30 min. (f) Average fluorescence intensity. Data are presented as the mean ± SD (n = 3).
Given the promising imaging performance in live cells, the TEM-FB was further applied to image PhSH in zebrafish. All of animal experiments have been approved by the Animal Ethics Committee of Northwest University. It shows significant increase of fluorescence when zebrafish was incubated with TEM-FB and PhSH (Fig. 7b), while that incubated with TEM-FB only almost no fluorescence (Fig. 7a). Moreover, the liver and the intestine of zebrafish present higher fluorescence intensity than other regions, which may be related to TEM-FB/PhSH metabolism. The results demonstrated that TEM-FB could be used to perform PhSH imaging in living specimens with a high signal-to-noise ratio, and TEM-FB/PhSH is metabolized by the liver and digestive system of zebrafish.
Figure 7
Figure 7.
Confocal fluorescence images of zebrafish in different conditions. (a) Zebrafish were pretreated with TEM-FB (30 µmol/L) for 30 min. (b) Zebrafish were pretreated with PhSH (50 µmol/L) for 30 min before incubating with TEM-FB (30 µmol/L) for 30 min.
In summary, we constructed an ICT-based NIR fluorescent probe TEM-FB for monitoring PhSH with large Stokes shift (198 nm) and high sensitivity (LOD = 10 nmol/L). TEM-FB displayed excellent capability of visualizing PhSH in living cells and in zebrafish with negligible cytotoxicity. Significantly, by using TEM-FB, we revealed that the oxidative stress process caused by PhSH and demonstrated that H2O2 in cells would alleviate the poisoning of PhSH for the first time. This work would provide a valuable tool for monitoring PhSH in physiological processes.
Declaration of competing interest
The authors declare that they have no known competing financial interests or personal relationships that could have appeared to
influence the work reported in this paper.
Acknowledgments
This work was supported by the National Natural Science Foundation of China (Nos. 22077099 and 22171223), the Technology Innovation Leading Program of Shaanxi (No. 2020TG-031), the Innovation Capability Support Program of Shaanxi (Nos. 2023-CXTD-75 and 2022KJXX-32), the Natural Science Basic Research Program of Shaanxi (No. 2023-JC-YB-141), and Young Talent Fund
of Association for Science and Technology in Shaanxi, China (No.
SWYY202206), and the Natural Science Basic Research Plan in
Shaanxi Province of China (Nos. 2022JQ-151 and 2022JQ-125).
Supplementary materials
Supplementary material associated with this article can be
found, in the online version, at doi:10.1016/j.cclet.2023.108507.
Figure 1
(a) The designed fluorescent probe TEM-FB for detecting PhSH. (b) Schematic illustration of intracellular oxidative stress process induced by PhSH and the endogenous H2O2 alleviating the poison of PhSH. PMA, an inducer of endogenous ROS.
Figure 3
(a) Ultraviolet absorbance and (b) fluorescence spectra of TEM-FB (10 µmol/L) upon the existence of various species (50 µmol/L) in DMSO/PBS (4:6, v/v, 10 mmol/L, pH 7.4). (c) Photographs of TEM-FB in the absence (left) and presence (right) of PhSH. (d) Normalized fluorescence and ultraviolet absorbance spectra of TEM-FB (10 µmol/L) upon the PhSH (50 µmol/L). (e) Fluorescence and (f) ultraviolet absorbance spectra of TEM-FB (10 µmol/L) upon the existence of PhSH (0–150 µmol/L). (g) The pH stability of TEM-FB (10 µmol/L) and TEM-FB (10 µmol/L) in presence of PhSH (50 µmol/L). (h) Fluorescence intensity of TEM-FB (10 µmol/L) in the presence of 1–24 (50 µmol/L) (1. Blank, 2. Lys, 3. Val, 4. Ile, 5. Phe, 6. Tau, 7. Thr, 8. Glu-Na, 9. Tyr, 10. NaCl, 11. PbCl2, 12. FeCl2, 13. Na2SO3, 14. KCl, 15. NaHSO3, 16. AlCl3, 17. NaHS, 18. Na2S, 19. Cys, 20. GSH, 21. Hcy, 22. H2O2, 23. NaClO, 24. PhSH) (Blue columns); the fluorescence intensity of TEM-FB (10 µmol/L) in the presence of PhSH (50 µmol/L) and simultaneously existing 1–24 (50 µmol/L) (Red columns).
Figure 4
(a) Proposed reaction mechanism of TEM-FB towards PhSH. (b) Ultraviolet absorbance and fluorescence spectra of TEM-FB (10 µmol/L) upon the existence of PhSH (50 µmol/L). (c) HRMS analysis of the mixture solution of TEM-FB+PhSH. (d) The electrostatic potential and the HOMO/LUMO gaps of TEM-OH and TEM-FB.
Figure 5
(a) Fluorescence imaging of different living cell lines: 239T cells, A549 cells, HeLa cells, and HepG2 cells treated with PhSH (50 µmol/L) for 30 min before staining with TEM-FB (30 µmol/L) for 30 min. (b) Average fluorescence intensity. Data are presented as the mean ± SD (n = 3). (c) Fluorescence imaging of HepG2 cells treated with different concentrations of PhSH. (0, 25, 50, 75 µmol/L) for 30 min before staining with TEM-FB (30 µmol/L) for 30 min. (d) Average fluorescence intensity. Data are presented as the mean ± standard deviation (SD) (n = 3).
Figure 6
Fluorescence imaging of HepG2 cells in different conditions (a) HepG2 cells were incubated with TEM-FB (30 µmol/L) for 30 min. (b) HepG2 cells were pretreated with PhSH (50 µmol/L) for 30 min before staining with TEM-FB (30 µmol/L) for 30 min. (c) HepG2 cells were pretreated with H2O2 (50 µmol/L) for 30 min and treated with PhSH (50 µmol/L) for 30 min before staining with TEM-FB (30 µmol/L) for 30 min. (d) HepG2 cells were pretreated with PMA (10 µg/mL) for 30 min and then treated with PhSH (50 µmol/L) for 30 min before staining with TEM-FB (30 µmol/L) for 30 min. (e) Fixed cells were pretreated with PhSH (50 µmol/L) for 30 min before incubating with TEM-FB (30 µmol/L) for 30 min. (f) Average fluorescence intensity. Data are presented as the mean ± SD (n = 3).
Figure 7
Confocal fluorescence images of zebrafish in different conditions. (a) Zebrafish were pretreated with TEM-FB (30 µmol/L) for 30 min. (b) Zebrafish were pretreated with PhSH (50 µmol/L) for 30 min before incubating with TEM-FB (30 µmol/L) for 30 min.


 DownLoad:


 下载:
下载:


 下载:
下载:
