School of Chemistry and Chemical Engineering, Zhoukou Normal University, Zhoukou 466001, China
b.
Key Laboratory of Green and Precise Synthetic Chemistry and Applications, Ministry of Education, Anhui Province Key Laboratory of Pollutant Sensitive Materials and Environmental Remediation, School of Chemistry and Chemical Engineering, School of Energy Science and Engineering, Huaibei Normal University, Huaibei 235000, China
c.
Songshan Lake Materials Laboratory, Dongguan 523808, China
Received Date:
19 July 2025 Accepted Date:
10 November 2025 Revised Date:
06 November 2025 Available Online:
15 April 2026
Abstract:
The development of efficient and cost-effective non-precious-metal single-atom catalysts (SACs) is crucial for advancing the practical application of electrocatalytic CO2 reduction (CO2RR). However, identifying highly active metal atoms and designing catalysts with uniform active center structures remain significant challenges. To address this, we developed a generic pyrolysis method to synthesize a series of transition metal-based SACs with atomically dispersed metal anchored on carbon nitride support (M-C3N4, M = Fe, Ni, Cu). Benefiting from the unique electronic structure of the Fe-N4 sites supported on C3N4, the Fe-C3N4 catalyst demonstrated exceptional performance, achieving a CO Faradaic efficiency of 99.6% and maintaining excellent stability. Theoretical calculations indicate that the Fe site exhibits a relatively stronger interaction with the *COOH intermediate, thereby helping to lower the energy barrier of the CO2 protonation process. This study provides valuable theoretical insights and practical synthesis strategies for designing high-performance non-precious-metal SACs for CO2RR.
The escalating global energy crisis and the urgent challenge of greenhouse gas emissions have spurred significant interest in the electrocatalytic CO2 reduction reaction (CO2RR) as a sustainable pathway to convert CO2 into valuable chemicals and fuels [1-5]. The efficient and selective electroreduction of CO2 to CO is particularly valuable, as CO serves as a key syngas component for industrial processes like Fischer-Tropsch synthesis [6-9]. However, the inherent stability of the CO2 molecule necessitates overcoming high energy barriers and managing complex multi-electron transfer pathways during its reduction [10-13]. Furthermore, the competing hydrogen evolution reaction (HER) often severely compromises the activity, selectivity, and stability of electrocatalysts [14-18]. Consequently, developing electrocatalysts that are highly active and selective is crucial for the practical implementation of CO2 reduction reactions.
Single-atom catalysts (SACs) have emerged as promising candidates for CO2RR, offering exceptional atom utilization efficiency, well-defined active sites, and unique electronic tunability [19-22]. The choice of support material is critical, as it stabilizes the metal single atoms while simultaneously modulating their electronic environment to influence catalytic performance. Graphitic carbon nitride (g-C3N4) is an attractive support due to its tunable electronic properties and ordered structure. Its framework features abundant pyridinic nitrogen sites, which provide ideal anchoring points for metal single atoms, facilitating the formation of stable M-N4 moieties [23-25]. While g-C3N4-based SACs have demonstrated high performance in various catalytic reactions, their efficacy for the specific CO2-to-CO conversion pathway varies significantly depending on the non-precious metal center (e.g., Fe, Ni, Cu) [26-28]. This performance disparity stems primarily from how the distinct metal atoms influence the electronic characteristics and geometric configuration of the M-N4 site, thereby dictating the adsorption behavior of key reaction intermediates and the resulting structure-activity relationships [29-31]. A systematic comparative study and theoretical elucidation of different metal centers within the same g-C3N4 support framework, specifically for CO2-to-CO reduction, remains lacking, hindering the rational design of high-performance SACs. Therefore, a fundamental investigation into how different metal single atoms, within an identical coordination environment, affect intermediate adsorption energetics and electronic structure is essential not only for elucidating the reaction mechanism but also for providing a solid theoretical foundation for designing efficient CO2RR catalysts.
Based on this, we synthesized a series of transition metal SACs (Fe, Cu, Ni) anchored on g-C3N4 (denoted as M-C3N4). Among these, Fe-C3N4 exhibited superior catalytic performance for CO2-to-CO conversion, achieving a remarkable Faradaic efficiency of 99.6% for CO at −2.5 V vs. Ag/Ag+, alongside a current density approaching 100 mA/cm2. Density functional theory (DFT) calculations reveal that the Fe center promotes greater electron density redistribution towards the *COOH intermediate, significantly lowering its formation energy barrier and thus enhancing catalytic activity. This work highlights the crucial influence of the metal center's electronic structure on the adsorption strength of key intermediates and provides new insights for the rational design of SACs for advancing CO2RR.
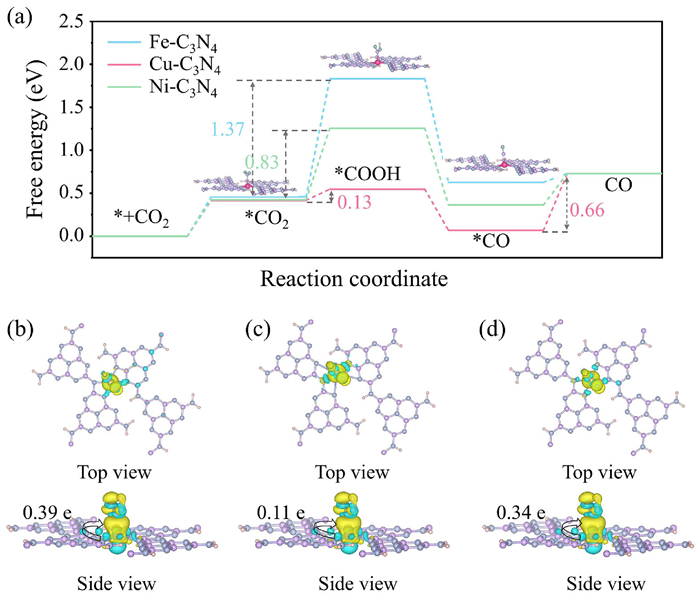
In order to investigate the effect of metal atom type on CO2RR efficiency, we constructed and optimized M-N4 single-atom models based on C3N4-supported metals (M = Fe, Cu, Ni) via DFT simulations as shown in Fig. S1 (Supporting information). We chose Fe-N4, Cu-N4, and Ni-N4 as research models because these structures have been proven to have high efficiency for CO2RR. Firstly, the reaction pathway and Gibbs free energy for the reduction of CO2 to CO on Fe, Cu, Ni single atom supported C3N4 catalysts were calculated (Fig. 1a) [32]. All three catalysts followed a typical reduction pathway: * + CO2 → *COOH → *CO → * + CO. Among them, the Cu-C3N4 and Ni-C3N4 models require overcoming energy barriers of 1.37 and 0.83 eV, respectively, to reduce *CO2 to *COOH. In contrast, the Fe-C3N4 model significantly enhances the adsorption of reaction intermediates, particularly *COOH, by reducing the energy of the rate-determining step to 0.13 eV, thereby facilitating the protonation process of *CO2. Furthermore, the overpotential in the Fe-C3N4 model is reduced to 0.66 eV, with the rate-determining step now shifting to the desorption of *CO. The energy barrier of the overall reaction pathway was the smallest for Fe-C3N4 model, demonstrating the optimal CO2 activation ability and kinetic advantages. This may be due to the strong interaction between Fe-C3N4 and the intermediate *COOH, which is beneficial for stabilizing the *COOH intermediate and reducing the activation energy of CO2. In contrast, the formation of *COOH intermediates is the determining step for CO2RR on Cu-C3N4 and Ni-C3N4, indicating poor stability towards intermediates and limited CO2 activation efficiency.
Figure 1
Figure 1.
(a) The calculated Gibbs free energy diagrams for CO2RR on the Fe-C3N4, Cu-C3N4 and Ni-C3N4 surfaces. The charge density difference and Bard charge of (b) Fe-C3N4, (c) Cu-C3N4 and (d) Ni-C3N4 with *COOH adsorption. The charge accumulation is shown as the yellow region, and the charge depletion is shown as the cyan region.
To further understand the electronic interactions between metal centers and reaction intermediates, we calculated the differential charge density distribution and Bader charge of M-N4 (Figs. 1b-d) [33,34]. The results showed that Fe-C3N4 transferred the largest amount of charge to the intermediate *COOH (0.39 e), indicating that it has stronger electronic coupling with the intermediate in the adsorption state, which helps to stabilize the adsorption configuration and promote the reaction. In addition, the adsorption energy results directly indicate that Fe-C3N4 has stronger adsorption of the intermediate *COOH, which will be beneficial to the protonation process of CO2 (Fig. S2 in Supporting information). In summary, Fe-C3N4 exhibits excellent catalytic activity during the electroreduction of CO2 to CO, attributed to the stronger interaction between the Fe center and the intermediate *COOH, thereby reducing the reaction energy barrier.
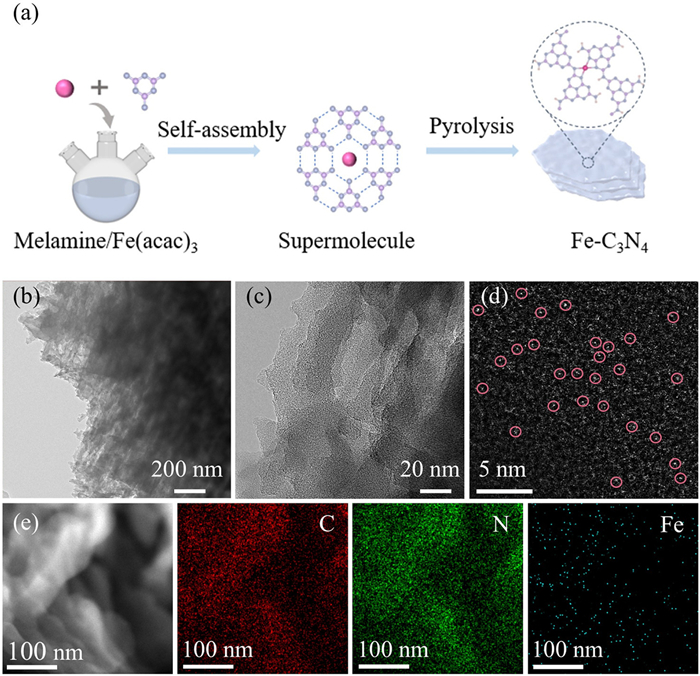
In light of the excellent CO2RR performance of Fe-C3N4 model through DFT studies, we developed the Fe SACs with an optimal FeN4 structure supported on C3N4. Fig. 2a illustrates the synthesis process of Fe-doping carbon nitride (Fe-C3N4). Specifically, ferric acetylacetonate and melamine were mixed, subjected to a hydrothermal treatment, and then calcined at a high temperature to obtain Fe-C3N4 catalyst. For comparison, Ni-doping carbon nitrides and Cu-doping carbon nitrides were synthesized using a similar method and named Ni-C3N4 catalyst and Cu-C3N4 catalyst, respectively. The microstructure of the synthesized catalysts was investigated using scanning electron microscopy (SEM) and transmission electron microscopy (TEM). The SEM image (Fig. S3a in Supporting information) of Fe-C3N4 reveals the highly interconnected ultrathin nanosheets with well-defined porous features. Similarly, other catalysts also exhibit similar structures (Figs. S3b-d in Supporting information). The TEM image of the synthesized Fe-C3N4 catalysts (Fig. 2b) exhibit three-dimensional (3D) framework structure stacked by nanosheets, and notably, they possess a porous characteristic. No obvious metallic particles can be observed in the high-resolution TEM image (HRTEM) of Fe-C3N4 (Fig. 2c). These observations imply that numerous iron moieties may be highly dispersed in the form of tiny clusters or single atoms. Fig. 2d presents an aberration-corrected high-angle annular dark-field scanning transmission electron microscope (HAADF-STEM) image of Fe-C3N4 at atomic resolution. The image clearly reveals numerous bright dots on the carbon matrix (marked by red circles), which signifies the presence of densely and atomically dispersed Fe species [35]. Energy-dispersive X-ray spectroscopy (EDS) mapping images (Fig. 2e) suggest the uniform dispersion of C, N, and Fe elements on the catalyst, with no evidence of large metallic particles, corroborating the atomic-level dispersion of Fe elements on the porous C3N4 support.
Figure 2
Figure 2.
(a) Schematic diagram of the synthesis of Fe-C3N4. (b) TEM image of Fe-C3N4. (c) HRTEM of Fe-C3N4. (d) Aberration corrected HAADF-STEM image of Fe-C3N4. (e) Elemental mapping images of C, N, and Fe in Fe-C3N4.
As shown in the X-ray diffraction (XRD) pattern, the main matrix of C3N4 remains unchanged after Fe doping, with characteristic peaks at 27.2° assigned to the (002) planes, respectively (Fig. S4 in Supporting information) [36,37]. Similar peaks also appear in the XRD patterns of the Ni-C3N4 and Cu-C3N4 catalysts, indicating the absence of Ni- and Cu-based metal particles. In addition, M-C3N4 exhibit two broad peaks located at 400 and 1500 cm-1, belonging to the classical C3N4 peak (Fig. S5 in Supporting information) [38]. The Fe, Ni, and Cu contents in Fe-C3N4, Ni-C3N4, and Cu-C3N4 were estimated to be 1.82 wt%, 1.15 wt%, and 1.59 wt%, respectively, as reveled by inductively coupled plasma-optical emission spectroscopy (ICP-OES, Table S1 in Supporting information). Consequently, Fe-C3N4 exhibited the highest metal loading among the three catalysts. Nitrogen sorption isotherms and the corresponding pore size distribution curves were obtained to evaluate the textural properties of all synthesized catalysts. As depicted in Fig. S5a (Supporting information), all catalysts showed typical typeⅡ isotherms coupled with notable Type H3 hysteresis loops, illustrating the existence of abundant mesopores and macropores [39,40]. Specifically, in all the catalysts, the hysteresis loops rose steadily with P/P0, which was usually regarded as the characteristic of the flake structures [41]. These flake structures were also confirmed in the SEM images. As depicted in Figs. S6b and S7 (Supporting information), the incorporation of metal species induces slight but discernible changes in pore structure, as reflected in the shift of the pore size distribution and the increase in microporosity of M-C3N4 compared to pristine C3N4. Therefore, the porous C3N4 catalysts anchored with high-loading metal single atoms, particularly Fe sites, have been successfully synthesized. This combination of high metal loading density and abundant porosity is anticipated to significantly enhance catalytic activity.
To further characterize the composite, Fourier transform infrared (FT-IR) spectroscopy analysis was performed. As shown in Fig. S8 (Supporting information), the peaks at 810 cm–1 is attributed to the stretching vibration of triazine units, and the absorption bands in the range of 1170–1740 cm–1 correspond to the stretching vibration of C=N, C–N in the triazine rings and C–N outside the triazine rings, whereas the broad peaks at 2960–3420 cm–1 belong to the stretching vibration of the N–H band in amine groups and stretching vibration of the O–H band on the surface water molecules adsorbed. The elemental composition and related valence states on the surface of M-C3N4 catalysts were further studied via X-ray photoelectron spectroscopy (XPS). The XPS survey spectrum indicates C, and N as the predominant elements in M-C3N4 and C3N4 catalysts (Fig. S9a in Supporting information). The Fe, Ni and Cu spectra exhibited weak signal intensity, making it difficult to determine the oxidation states of Fe, Ni and Cu, as only faint Fe 2p, Ni 2p and Cu 2p peaks are observed. Three distinct peaks (Fig. S9b in Supporting information) at ca. 284.8, 286.2 and 288.6 eV can be observed in high-resolution C 1s spectrum of Fe-C3N4, attributed to C–C, C–N, C=O bonding [42,43]. High-resolution N 1s XPS spectrum of Fe-C3N4 (Fig. S9c in Supporting information) display three types of N atoms, including pyridinic N (397.9 eV), metal–N bonding (399.2 eV), pyrrolic N (401.09 eV) [44]. Furthermore, high-resolution N 1s XPS spectra for Fe-C3N4, Cu-C3N4 and Ni-C3N4 confirm the presence of significant metal–N bonds, highlighting the strong interaction between the metal centers and N in the C3N4 framework.
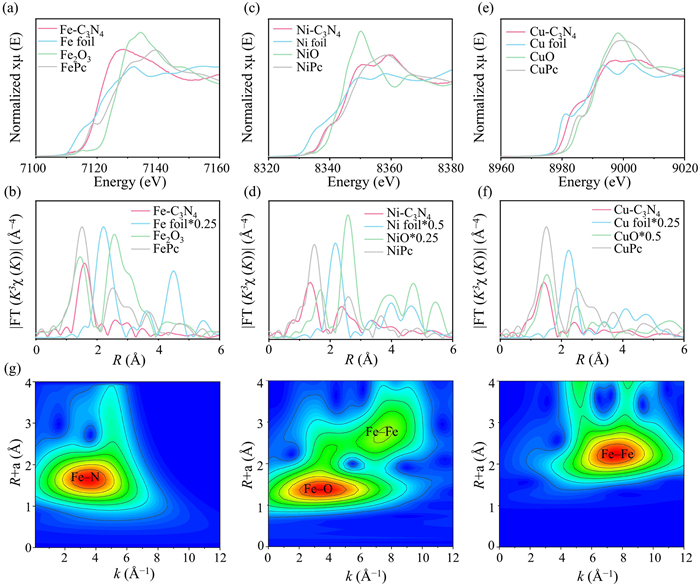
The electronic structures and coordination environments of Fe species in Fe-C3N4 were further investigated using X-ray absorption near edge structure (XANES) and extended X-ray absorption fine structure (EXAFS) characterizations [45-47]. As observed in the Fe K-edge XANES spectra (Fig. 3a), the absorption edge position of Fe-C3N4 is located between those of FePc and Fe2O3 suggesting that the valence state of Fe species in Fe-C3N4 is between +2 and +3. The further quantification of the oxidation state through linear extrapolation confirmed that the oxidation state of Fe in Fe-C3N4 is +2.1 (Figs. S10a and b in Supporting information). The possible coordination environment was identified by Fourier-transformed (FT) k3-weighted EXAFS spectra. Notably, the primary peak of the Fe K-edge in Fe-C3N4 (Fig. 3b) was located at ~1.57 Å, which was similar to the Fe–N bonding environment of FePc. Note that no apparent Fe–Fe coordination peak at ~2.2 Å was observed on Fe-C3N4 compared with Fe-foil and Fe2O3 references, manifesting that Fe atoms in Fe-C3N4 existed as mononuclear Fe species instead of crystalline phase [48]. Furthermore, by analyzing the Ni K-edge XANES spectra (Fig. 3c), it was found that the absorption edge position of Ni- C3N4 fell between those of Ni foil and NiO. This result suggested that the valence state of Ni species in Ni-C3N4 was between 0 and +2. The EXAFS spectra of Ni-C3N4 (Fig. 3d) display a prominent peak around ~1.36 Å, attributed to the Ni–N scattering path with non-phase correction [49]. It is worth noting that, in comparison with the Ni foil and NiO references, no prominent Ni–Ni coordination peak at ~2.2 Å was detected in Ni-C3N4, indicating that Ni atoms also are atomically dispersed in the C3N4 substrate (Fig. 3d). Similarly, the Cu K edge XANES spectrum (Fig. 3e) indicates that the valence state of Cu species in Cu-C3N4 is between 0 and +2. As observed in the Cu k3-weighted EXAFS spectra (Fig. 3f), A major peak located at ~1.43 Å was detected in Cu-C3N4 catalyst, which is attributed to the Cu–N scattering path in the first shell layer. More importantly, the Cu–Cu characteristic peaks are absence on Cu-C3N4, compared to that of Cu foil, confirms the lack of Cu clusters and supports the atomic level dispersion of Cu species [50]. The wavelet transform (WT) was also employed to examine the Fe K-edge EXAFS (Fig. 3g) oscillations for the Fe-C3N4. The WT contour plots of Fe-C3N4 exhibit a singular intensity maximum at approximately 3 Å−1, corresponding to Fe–N coordination. Crucially, no Fe–Fe scattering signature appears at 7.5 Å−1, which distinguishes it from Fe foil and Fe2O3 references. This absence definitively confirms atomic dispersion of Fe throughout the C3N4 matrix. Subsequently, a least-square EXAFS fitting was performed to extract the structural parameters of Fe/Cu/Ni in M-C3N4. The fitting analysis (Fig. S11 in Supporting information) showed that the Fe atom in Fe-C3N4 coordinated with 4 N atoms, forming Fe-N4 atomic interface with average bond length of 1.9 Å. Similarly, Cu-C3N4 (Fig. S12 in Supporting information) and Ni-C3N4 (Fig. S13 in Supporting information) exhibit similar coordination results, as detailed in Table S2 (Supporting information). In summary, we have successfully prepared three different metal supported single atom catalysts on C3N4, with each metal center forming a planar M-N4 coordination structure.
Figure 3
Figure 3.
(a) Fe K-edge XANES spectra. (b) Fourier transform (FT) EXAFS of Fe K-edge. (c) Ni K-edge XANES spectra. (d) Fourier transform (FT) EXAFS of Ni K-edge. (e) Cu K-edge XANES spectra. (f) Fourier transform (FT) EXAFS of Cu K-edge. (g) Wavelet-transformed k3-weighted EXAFS spectra of Fe.
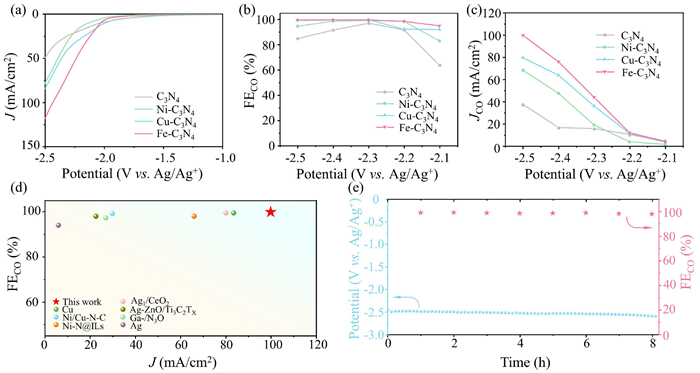
The activity of the electrocatalytic CO2RR over different catalysts were studied systematically in a CO2-saturated [BMIM][BF4]/MeCN solution using the H-cell (Fig. S14 in Supporting information). The H-type cell comprises two compartments, with the electrolyte separated by a Nafion 117 membrane to enable control over solvent exchange. The linear sweep voltammetry (LSV) measurements for the four catalysts were conducted within the range of −1 V to −2.5 V vs. Ag/Ag+. The products were quantified by nuclear magnetic resonance (NMR) spectroscopy and gas chromatography (GC). Only H2 and CO were detected during the CO2RR process. It was found that in the LSV curves (Fig. S15 in Supporting information), the current density in a CO2-saturated [BMIM][BF4]/MeCN solution was higher than that in Ar-saturated electrolyte, which indicated that obvious electrocatalytic CO2RR occurred in a CO2-saturated [BMIM][BF4]/MeCN solution. Notably, Fe-C3N4 (Fig. 4a) demonstrates the highest total current density across the studied potential range and the lowest onset potential among all the prepared catalysts. The M-C3N4 catalysts with metal loading exhibit a higher current density than pure C3N4, indicating the positive impact of metal loading on enhancing the current density (Fig. S16 in Supporting information). Fe-C3N4 (Fig. 4b) exhibits high selectivity (FECO > 95%) over a broad potential range from –2.1 V to –2.5 V, with a maximum FECO of 99.6% at −2.5 V. Throughout the entire potential range, Fe-C3N4 shows relatively the best performance compared to Cu-C3N4, Ni-C3N4 and C3N4, indicating its superior CO2RR catalytic activity. Among all the catalysts, C3N4 displays the lowest FECO under all voltages, highlighting the critical role of metal sites in enhancing catalytic activity. Moreover, Fe-C3N4 demonstrated a higher partial current density for CO (JCO), reaching 100 mA/cm2 at −2.5 V, approximately twice that of Cu-C3N4 and Ni-C3N4 (Fig. 4c). In conclusion, Fe-C3N4 exhibits superior performance in catalyzing the reduction of CO2 to CO, making it a promising candidate for CO2RR applications. comparative analysis with previously reported electrocatalysts positioned Fe-C3N4 as a leading performer in CO2RR performance for the H-cell (Fig. 4d and Table S3 in Supporting information).
Figure 4
Figure 4.
(a) LSV curves of C3N4, Ni-C3N4, Cu-C3N4, and Fe-C3N4 measured in the H-cell with pure CO2 saturated [BMIM][BF4] (0.3 mol/L)/MeCN electrolyte. (b) FECO of the prepared catalysts. (c) JCO of the prepared catalysts. (d) Comparison of CO2RR to CO performance of Fe-C3N4 with other previously reported electrocatalysts in the H-cell. (e) Long-term stability test.
Electrochemical surface area (ECSA), an important indicator of catalytic activity reflecting the amount of catalyst in contact with the electrolyte, was obtained by measuring the CV curves with various scan rates. The ECSA was assessed through the double-layer capacitance (Cdl) measurements [51]. The Cdl of Fe-C3N4 was calculated to be 0.235 mF/cm2, significantly exceeding that of Cu-C3N4 (0.219 mF/cm2) and Ni-C3N4 (0.210 mF/cm2) (Figs. S17 and S18 in Supporting information), indicating a greater abundance of available catalytic active sites in Fe-C3N4. This can be attributed to excellent microstructures in the catalysts, as reflected in the TEM images. In Fe-C3N4, the 3D framework structure exhibited by catalysts and a rough surface on the C3N4 increases the electrochemical surface. Additionally, Tafel plots were used to evaluate the electrode kinetics. As shown in Fig. S19 (Supporting information), Fe-C3N4 exhibited the lowest Tafel slope of 233 mV/dec, indicating a faster CO2 reduction rate, which further enhanced its CO2RR performance. The stability of the Fe-C3N4 catalyst was evaluated through chronopotentiometry testing at 100 mA/cm2, where it demonstrated exceptional durability for CO2RR, retaining 99% of its initial FECO after 10 h of continuous electrolysis (Fig. 4e). Fig. S20 (Supporting information). the XANES and EXAFS spectra of Fe-C3N4 before and after electrolysis, demonstrating the structural stability of the active sites.
In summary, we have successfully synthesized a series of carbon nitride-supported atomically dispersed transition metal (Fe, Ni, Cu) single-atom catalysts using a generic pyrolysis method. Experimental result revealed that the Fe-C3N4 catalyst exhibits exceptional performance for the electrocatalytic reduction of CO₂ to CO, achieving a remarkable Faradaic efficiency of 99.6% and demonstrating excellent stability over 10 h at −2.5 V vs. Ag/Ag+. This superior activity is attributed to the synergistic effect of the well-defined Fe-N4 coordination structure and adjacent nitrogen doping within the g-C3N4 matrix. DFT calculations provide important mechanistic insights, revealing that the Fe center facilitates the transfer of electrons to the *COOH intermediate, effectively lowering the formation energy barrier of *COOH, which is identified as the rate-determining step, thereby enhancing the overall catalytic activity. These findings offer valuable fundamental insights into the structure-activity relationships governing g-C3N4-based SACs.
Declaration of competing interest
We declare that we have no known competing financial interests or personal relationships that could have appeared to influence the work reported in this paper.
This research was funded by the National Natural Science Foundation of China (Nos. 22508135, 22278169), the Natural Science Foundation of Anhui Province (No. 2508085QB067), the Key Foundation of the Educational Commission of Anhui Province (No. 2022AH050376), the Excellent Scientific Research and Innovation Team of Education Department of Anhui Province (No. 2022AH010028), the National Innovation and Entrepreneurship Training Program for College Students, China (No. 202410373008), and Guangxi University Engineering Research Center of Hydrogen/Heat/Electricity-Related Energy Materials and Sensors. We thank the Anhui Absorption Spectroscopy Analysis Instrument Co., Ltd. for XAFS measurements and analysis.
Supplementary materials
Supplementary material associated with this article can be found, in the online version, at doi:10.1016/j.cclet.2025.112096.
[1]
P. Yang, M. Gao, Reviews Chem. Soc. Rev. 52 (2023) 4343–4380. doi: 10.1039/D2CS00849A
[2]
M. Li, H. Wang, W. Luo, et al., Adv. Mater. 32 (2020) 2001848. doi: 10.1002/adma.202001848
Figure 1
(a) The calculated Gibbs free energy diagrams for CO2RR on the Fe-C3N4, Cu-C3N4 and Ni-C3N4 surfaces. The charge density difference and Bard charge of (b) Fe-C3N4, (c) Cu-C3N4 and (d) Ni-C3N4 with *COOH adsorption. The charge accumulation is shown as the yellow region, and the charge depletion is shown as the cyan region.
Figure 2
(a) Schematic diagram of the synthesis of Fe-C3N4. (b) TEM image of Fe-C3N4. (c) HRTEM of Fe-C3N4. (d) Aberration corrected HAADF-STEM image of Fe-C3N4. (e) Elemental mapping images of C, N, and Fe in Fe-C3N4.
Figure 3
(a) Fe K-edge XANES spectra. (b) Fourier transform (FT) EXAFS of Fe K-edge. (c) Ni K-edge XANES spectra. (d) Fourier transform (FT) EXAFS of Ni K-edge. (e) Cu K-edge XANES spectra. (f) Fourier transform (FT) EXAFS of Cu K-edge. (g) Wavelet-transformed k3-weighted EXAFS spectra of Fe.
Figure 4
(a) LSV curves of C3N4, Ni-C3N4, Cu-C3N4, and Fe-C3N4 measured in the H-cell with pure CO2 saturated [BMIM][BF4] (0.3 mol/L)/MeCN electrolyte. (b) FECO of the prepared catalysts. (c) JCO of the prepared catalysts. (d) Comparison of CO2RR to CO performance of Fe-C3N4 with other previously reported electrocatalysts in the H-cell. (e) Long-term stability test.

 DownLoad:

 下载:
下载:


 下载:
下载:
