State Key Laboratory of Flexible Electronics (LOFE) & Institute of Advanced Materials (IAM), Nanjing Tech University, Nanjing 211800, China
b.
Center for Rehabilitation Medicine, Rehabilitation & Sports Medicine Research Institute of Zhejiang Province, Department of Rehabilitation Medicine, Cancer Center, Zhejiang Provincial People's Hospital, Affiliated People's Hospital, Hangzhou Medical College, Hangzhou 310014, China
Received Date:
12 April 2025 Accepted Date:
25 June 2025 Revised Date:
20 June 2025 Available Online:
15 June 2026
Abstract:
The development of organic dyes with fluorescence in the second near-infrared (NIR-Ⅱ, 1000–1700 nm) biological window is crucial for deep-tissue tumor phototheranostics. Herein, we synthesized a thienothiadiazole-based NIR-Ⅱ fluorescent dye TTDOC with donor-acceptor-donor (D-A-D) molecular architecture for photoacoustic/fluorescence imaging-guided photothermal therapy (PTT). NIR-Ⅱ dye TTDOC, taking electron-deficient thienothiadiazole as an acceptor and triphenylamine as a donor, exhibited a high fluorescence quantum yield of 1.7% in dichloromethane (IR-1061 as standard, 1.7% in dichloromethane). Upon encapsulation in biocompatible polymer F-127, TTDOC nanoparticles (NPs) were formulated with NIR absorption and fluorescence band covering 900–1150 nm, and demonstrated an outstanding photothermal conversion efficiency (η) of 51.6% upon 808 nm photoirradiation. In vivo studies, including fluorescence and photoacoustic imaging, revealed that TTDOC NPs effectively accumulated in tumor tissues, reaching maximal tumor enrichment at 20 h post-injection. In vitro and in vivo results confirmed the ability of TTDOC NPs to enable efficient photoacoustic/fluorescence imaging-guided PTT, offering a promising strategy for deep-tissue tumor treatment.
Phototheranostics, an emerging modality leveraging differential excited-state energy dissipation pathways of photoactivated materials, has emerged as a transformative strategy for treating superficial and localized tumors [1–3]. Its clinical promise stems from the advantages of non-invasive operation, precise spatiotemporal controllability, and high effectiveness. Particularly, multimodal phototheranostics integrating fluorescence imaging (FLI), photoacoustic imaging (PAI), photothermal imaging (PTI), photothermal therapy (PTT), and photodynamic therapy (PDT) within a unified platform has gained significant attraction [4–8]. This paradigm shift is driven by the synergistic complementarity of multimodal integration, which overcomes the inherent limitations of individual modalities while amplifying their collective therapeutic outcomes through cascade energy conversion mechanisms. Notably, multimodal phototheranostics is transitioning from the conventional "all-in-one" approach through the physical blending of multiple functional components to innovative "one-for-all" molecular design [9–12]. The latter strategy, wherein a single molecule simultaneously executes diverse phototheranostic functions, offers superior features of defined molecular structures and batch-to-batch reproducibility. However, realizing unimolecular one-for-all systems requires meticulous balancing of competing excited-state energy dissipation pathways: Radiative decay for FLI, intersystem crossing (ISC) for PDT, and non-radiative relaxation for PAI/PTI/PTT, which is a challenge requiring molecular-level orchestration of electronic state interactions [13–15].
In recent years, near-infrared (NIR) fluorescent dyes, especially those operating in the NIR-Ⅱ biological window (1000–1700 nm), have gained significant attention, due to their superior tissue penetration, reduced autofluorescence, and enhanced spatial resolution compared to traditional NIR-Ⅰ dyes [16–18]. These properties make them ideal candidates for in vivo FLI and tumor phototheranostics. To develop NIR-Ⅱ organic fluorescent dyes, three primary molecular design strategies have been employed, including constructing donor-acceptor (D-A) molecular architectures, prolonging the π-conjugated system, and fabricating J-aggregates [19–23]. Recent efforts have focused on developing donor-acceptor-donor (D-A-D) type NIR-Ⅱ fluorophores, which exhibit pronounced intramolecular charge transfer (ICT), making them particularly suitable for phototheranostic applications [24–26]. Thienothiadiazole (TTD), a highly planar thiophene derivative featuring unique π-electron delocalization and a hypervalent sulfur atom, has emerged as a popular electron-deficient building block in NIR-Ⅱ fluorescent dye design. Due to its distinctive electronic structure, TTD has been extensively utilized in designing π-conjugated molecules, facilitating the development of NIR-Ⅱ fluorophores with enhanced photophysical properties for optoelectronic devices and biomedical applications [27–32].
In this contribution, we developed a thienothiadiazole-based NIR-Ⅱ fluorescent dye TTDOC with D-A-D scaffold for FLI/PAI-guided tumor PTT. TTDOC, taking electron-deficient thienothiadiazole as acceptor and triphenylamine as donor, exhibited a high fluorescence quantum yield (QY) of 1.7% in dichloromethane (IR-1061 as reference, 1.7% in dichloromethane). Upon encapsulation with the biocompatible polymer F-127, TTDOC nanoparticles (NPs) were prepared, exhibiting robust NIR absorption peaked at 755 nm and an extensive fluorescence emission concentrated at 980 nm. Moreover, TTDOC NPs demonstrated a high photothermal conversion efficiency (PCE) of 51.6% upon 808 nm photoirradiation. In vivo, studies validated that TTDOC NPs could effectively accomplish FLI/PAI-guided PTT.
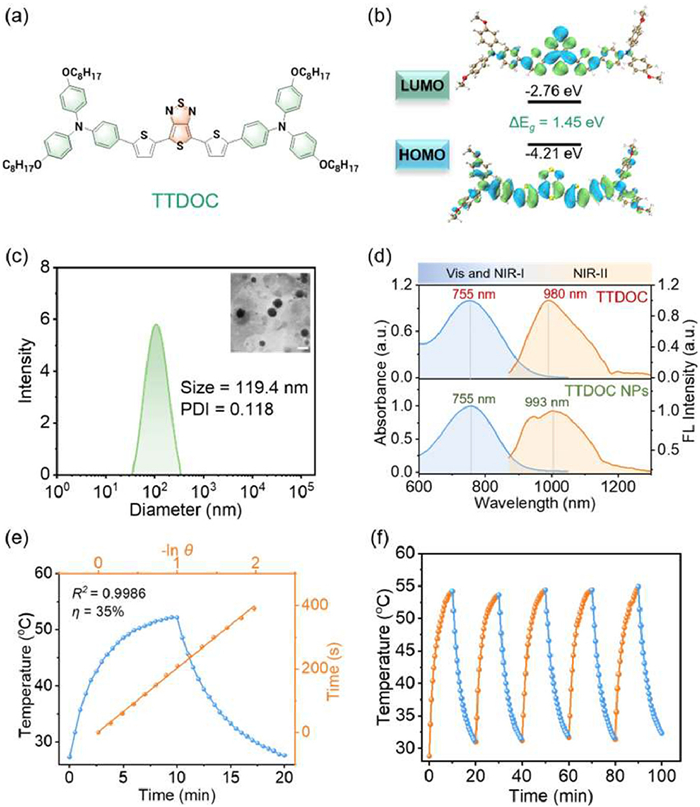
The dye TTDOC with D-A-D motif was efficiently synthesized, taking triarylamine as the donor, thienothiadiazole as the acceptor, and thiophene unit as the π-bridge. The detailed whole synthetic route of TTDOC is provided and outlined (Fig. S1 in Supporting information). To understand the molecular and electronic structures of the dye TTDOC (Fig. 1a), the theoretical calculation was carried out by the density function theory, and Multiwfn and VMD programs were employed for better visualization [33,34]. The highest occupied molecular orbital (HOMO) delocalizes along the whole π-conjugated backbone, while the lowest unoccupied molecular orbital (LUMO) was mainly localized on electron-accepting TTD core and the neighboring thiophene units (Fig. 1b), this distribution suggested effective ICT along the π-skeleton of dye TTDOC, leading to reduced energy gap. The HOMO–LUMO band gaps of TTDOC were determined to be 1.45 eV, indicating that TTDOC was likely to exhibit red-shifted absorption and favorable non-radiative decay.
Figure 1
Figure 1.
(a) Chemical structure of TTDOC. (b) HOMO/LUMO distribution and energy levels of TTDOC. (c) Dynamic light scattering (DLS) profile of TTDOC NPs. Inset, TEM image. (d) Normalized absorbance and fluorescence of TTDOC in dichloromethane and TTDOC NPs in aqueous solution. (e) Photothermal curves of TTDOC NPs (100 µg/mL) exposed to an 808 nm laser (1.0 W/cm2, 10 min). (f) Photothermal stability of TTDOC NPs upon exposure to irradiation (808 nm, 1.0 W/cm2).
In addition, from the optimized ground state (S0) geometry, TTDOC adopted highly planar molecular conformation, with a dihedral angle of 1.0° between the acceptor thienothiadiazole and the π-bridge thiophene, and a dihedral angle of 0.5° between the thiophene and triphenylamine component. As shown in Fig. S2 (Supporting information), this near-planar structure could effectively extend the π-conjugation length, thereby prolonging both the absorption and emission bands (Fig. S2a). Besides, the -OC8H17 groups attached to the periphery of the large π-conjugation system prevent face-to-face π–π stacking in the aggregate state, which helped to maintain the high PCE of NIR-Ⅱ dye TTDOC [35].
To further analyze the electrostatic interactions, electrostatic potential (ESP) distributions of TTDOC were investigated. As shown in Fig. S2b, the ESP distributions reveal a relatively high intramolecular potential difference, which facilitates strong intramolecular D-A-D interaction and intermolecular electrostatic interaction in the aggregates [36]. These increased intra/intermolecular interactions and the long alkyl side chains of TTDOC might enable a suitable structure to coordinate radiative and non-radiative decay processes. Moreover, the charge transfer amounts were calculated to be 0.1435 e between the acceptor core and donor fragments in the excited state (Fig. S2c) [37]. Concomitantly, the root mean square deviation (RMSD) between TTDOC's ground and excited states was also calculated, providing an intuitionistic approach to observing the molecular deformation between the ground and excited states. The RMSD of TTDOC was determined to be 0.725 Å, indicating a moderate deviation from co-planarity, balancing fluorescence, and photothermal performance (Fig. S2d).
To enhance the water solubility of the hydrophobic dye TTDOC, the nanoprecipitation method was employed to self-assemble it with the amphiphilic polymer F127, forming water-dispersible TTDOC nanoparticles (NPs). Dynamic light scattering characterization showed a hydrodynamic diameter of 119.4 nm for TTDOC NPs, with a polydispersity index (PDI) of 0.118. Transmission electron microscopy (TEM) further confirmed the uniformly spherical morphology of TTDOC NPs with an average diameter of ~95 nm (Fig. 1c). Additionally, after storing for seven days, there were no signs of aggregation or deviations in the hydrodynamic particle size distribution, underscoring the robust long-term stability of TTDOC NPs (Fig. S3 in Supporting information).
The ultraviolet-visible (UV–vis)-NIR absorption spectrum of TTDOC in DCM showed an intensive NIR absorption band with a peak at 755 nm, whereas the fluorescence spectrum exhibited a profile in the range of 900–1350 nm, with a fluorescence peak centered at 980 nm. This resulted in a notable Stokes shift of 225 nm in DCM (Fig. 1d). Additionally, the absorption spectra of TTDOC in various organic solvents were also recorded, with the peaks ranging from 745 nm to 760 nm (Fig. S4a in Supporting information). The molar extinction coefficient (ε) of TTDOC in dichloromethane (DCM) at 808 nm was calculated to be 2.41 × 10⁴ L mol−1 cm−1, indicating a promising photo-absorbing property (Fig. S4b in Supporting information). The NIR-Ⅱ fluorescence QY of TTDOC was measured to be 1.7% in DCM, with IR-1061 (1.7%, in DCM) as a reference (Fig. S5 in Supporting information) [38]. The NIR-Ⅱ fluorescence brightness, the key factor for evaluating FLI performance, is the product of the molar extinction coefficient (ε) and fluorescence QY [39]. Accordingly, the brightness of TTDOC in DCM at 808 nm was calculated to be 362.8 L mol−1 cm−1. After self-assembly, TTDOC NPs showed a similar absorption profile to that in DCM, with a peak at 755 nm. The fluorescence profile of TTDOC NPs was broader than that in DCM, covering the range of 900–1300 nm with a peak at 1054 nm, exhibiting great potential for NIR-Ⅱ FLI.
Inspired by the remarkable light absorption capability of TTDOC NPs in the NIR window, their photothermal effect was evaluated under 808 nm photoirradiation. The temperature of TTDOC NPs at different concentrations was monitored by infrared (IR) thermography. To assess the photothermal properties of TTDOC NPs, when subjected to photoirradiation (808 nm, 1.0 W/cm2), 100 µg/mL solution of TTDOC NPs came to a steady state plateau and experienced a temperature rise of 36 ℃, in contrast to a 10.2 ℃ increase observed in deionized water under identical conditions. As shown in Fig. 1e and Fig. S6 (Supporting information), the PCE of TTDOC NPs was calculated as 51.6% upon 808 nm irradiation (Fig. S6a), which was comparable to various photothermal agents [40]. When the concentration of TTDOC NPs increased from 25 µg/mL to 100 µg/mL following 10-min irradiation (808 nm, 1.0 W/cm2), their temperature rose from 18.7 ℃ to 32.6 ℃, indicating a concentration and time-dependent escalation in photothermal response (Fig. S6b). In addition, adjusting the laser power density from 0.25 W/cm2 to 1.0 W/cm2 induced a marked thermal response, confirming that higher energy input amplified the photothermal effect. Particularly, under 10-min photoirradiation (808 nm) at 1.0 W/cm2, the temperature elevation of TTDOC NPs at a concentration of 100 µg/mL was 32.2 ℃ (Fig. S6c). These results directly confirmed their efficient conversion of light to heat upon laser irradiation. We further evaluated the photothermal performance of TTDOC NPs by calculating the value of ε × PCE [41]. With ε of 2.01 × 10⁴ L mol−1 cm−1 for TTDOC NPs at 808 nm, the value of ε808 nm × PCE808 nm for TTDOC NPs was calculated to be 1.04 × 10⁴ L mol−1 cm−1, which was higher than many reported organic photothermal agents (Table S1 in Supporting information). To analyze the sustained performance of TTDOC NPs under irradiation, their thermal behavior was evaluated through five repetitive heating and cooling phases, with corresponding thermal profiles illustrated in Fig. 1f. The TTDOC NPs solution exhibited stable temperature during each cycle test, highlighting its excellent photothermal stability. Then, the photostability of TTDOC NPs was evaluated by the variation of UV–vis absorbance. Indocyanine green (ICG) is one of the typical organic dyes that have been approved by the American FDA for clinical phototheranotics [44]. Under the same irradiation conditions, the absorption of ICG decreased rapidly (Fig. S7a in Supporting information). In contrast, the absorption of TTDOC NPs remained essentially unchanged, showing ultra-high photostability (Figs. S7b and c in Supporting information).
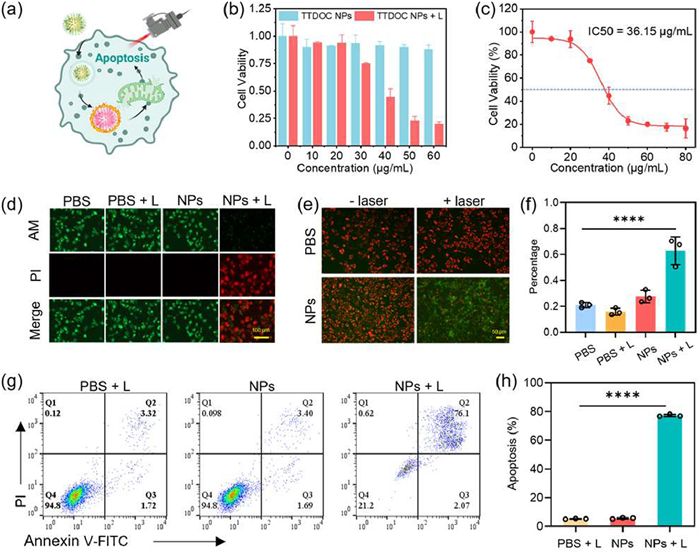
Based on the desirable photothermal effect of TTDOC NPs, the in vitro PTT effect was assessed on 4T1 cancer cells (Fig. 2a). The phototoxicity and dark toxicity of TTDOC NPs were assessed after incubation with different concentrations for 12 h employing 3-(4,5-dimethyl-2-thiazolyl)-2,5-diphenyl-2-H-tetrazolium bromide (MTT) assay. Following co-incubation with TTDOC NPs at 60 µg/mL, the 4T1 cell viability remained above 88%, highlighting their remarkable biocompatibility. Whereas as the concentration of TTDOC NPs increased, the survival of 4T1 cells was reduced under irradiation (808 nm, 1.0 W/cm2), and the viability dropped to 16% at 60 µg/mL, demonstrating the outstanding phototoxicity of TTDOC NPs via the photothermal effect under 808 nm photoirradiation (Fig. 2b). Furthermore, the half-maximal inhibitory concentration (IC50) was determined at 36.15 µg/mL (Fig. 2c).
Figure 2
Figure 2.
(a) Schematic illustration of TTDOC NPs PTT. (b, c) Assessment of cell viability in 4T1 cells subjected to varying concentrations of TTDOC NPs evaluated via MTT. (d) Fluorescence images of cells after staining by calcein-AM/PI. Scale bar: 100 µm. (e, f) JC-1 probe to identify alterations in MMP in 4T1 cells. Scale bar: 50 µm. (g, h) Apoptosis analysis of TTDOC NPs by FCM. ****P<0.0001. Data are presented as mean ± SD (n = 3).
Meanwhile, the calcein-acetoxymethyl ester/propidium iodide (calcein-AM/PI) assay was used to qualitatively evaluate the phototherapeutic effect of TTDOC NPs (Fig. 2d). Only the fluorescence depicts of 4T1 cells combined with TTDOC NPs upon 808 nm laser displayed a pronounced red signal of PI under 5 min of photoirradiation, demonstrating that the majority of 4T1 cells were eradicated by TTDOC NPs under irradiation. In contrast, 4T1 cells treated with phosphate buffer saline (PBS), PBS combined irradiation, or TTDOC NPs only exclusively displayed a distinct green fluorescence signal. The results indicated favorable biocompatibility in darkness, yet significant cytotoxicity of TTDOC NPs.
The depolarization of mitochondrial membrane potential (MMP) represents a hallmark event in apoptotic pathways [42]. To assess MMP disruption caused by the photothermal activity of TTDOC NPs, JC-1 staining was employed (Figs. 2e and f). 4T1 cells in the control group (PBS, PBS + L, TTDOC NPs) exhibited only a red fluorescence of JC-1 aggregates, indicating a normal MMP; however, 4T1 cells after treatment with TTDOC NPs and 808 nm laser irradiation exhibited a distinct green fluorescence of JC-1 monomer, indicating a depolarized MMP induced by TTDOC NPs and laser irradiation. Based on previous studies indicating that hyperthermia can induce cell death via the apoptotic pathway, experiments utilizing Annexin V-fluorescein isothiocyanate isomer I (FITC)/PI staining were conducted to confirm apoptosis triggered by the photothermal effect of TTDOC NPs. The flow cytometry (FCM) analysis of 4T1 cells subjected to various treatments (Figs. 2g and h) demonstrated that the group treated with TTDOC NPs combined with laser irradiation exhibited a significantly higher apoptosis rate (78.17%) than that of other groups (5.04% for PBS + L, 5.09% for NPs). This suggested that the photothermal effect of TTDOC NPs predominantly induced cell death via apoptosis, Combined with the results above, it was supposed that the photothermal heating of TTDOC NPs could result in rupture and oxidative damage of the mitochondrial membrane, affecting mitochondrial function and other mechanisms, thereby activating the apoptosis signaling pathway [43–45].
The exceptional optical properties of TTDOC NPs further inspired us to explore their NIR-Ⅱ FLI performance. As shown in Fig. S9 (Supporting information), the fluorescence signals of TTDOC NPs progressively increased along with the concentration rising from 50 µg/mL to 100 µg/mL (Fig. S9a), highlighting their promising capability for NIR-Ⅱ FLI. The scattering and penetration depth of TTDOC NPs were then assessed in a tissue-mimicking model (Fig. S9b). Even at a depth of 5 mm, the fluorescence signals remained detectable, with a signal-to-noise ratio (SNR) of 4.42, suggesting their strong potential for deep tissue imaging.
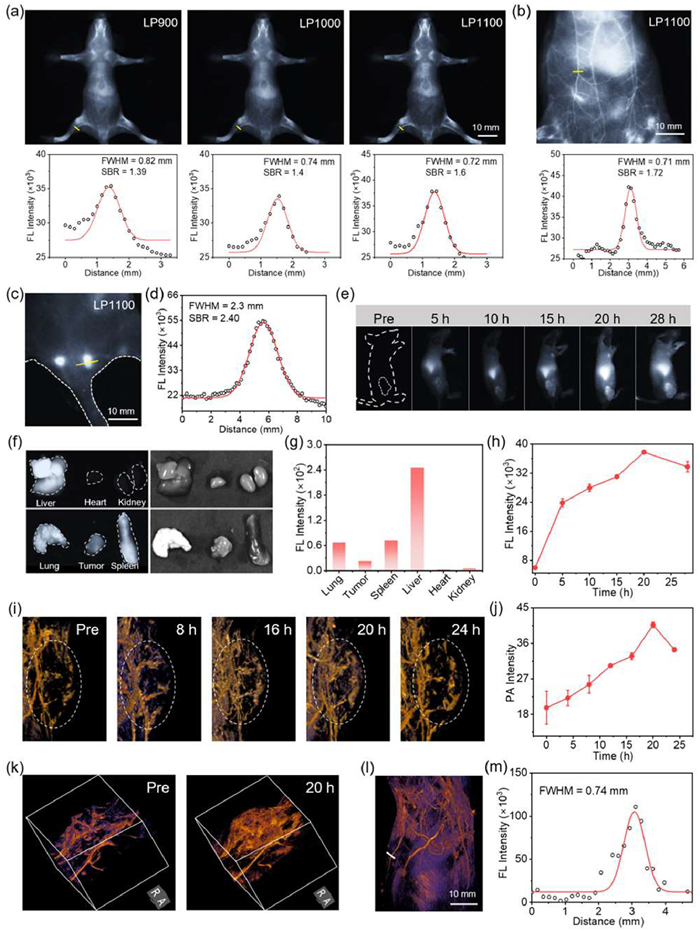
Subsequently, whole-body blood vessel FLI was performed to assess the deep-tissue NIR-Ⅱ FLI performance of TTDOC NPs on healthy mice after tail vein injection of TTDOC NPs (300 µg/mL, 200 µL). All experimental animal procedures were performed with approval from the Institutional Animal Care and Use Committee of the Zhejiang Provincial People's Hospital. As shown in Fig. 3a and Fig. S8c (Supporting information), the blood vessels were visualized post-injection. Notably, imaging with an 1100 nm long pass (LP) filter provided much-improved contrast compared to the images obtained using 900 and 1000 nm LP filters, significantly reducing background interference. The fluorescence intensity profiles of the blood vessels were also plotted, showing a decrease in full width at half-maximum (FWHM) from 0.82 mm with the 900 nm LP filter to 0.72 mm with the 1100 nm LP filter, thereby validating the improved resolution associated with the longer wavelength LP filter. TTDOC NPs displayed intense NIR-Ⅱ fluorescence in the abdominal blood vessels 5 min after injection, achieving a signal-to-background ratio (SBR) of 1.72, further confirming the high spatial resolution of TTDOC NPs in vivo (Fig. 3b).
Figure 3
Figure 3.
(a) Whole-body blood vessel FLI of TTDOC NPs with different LP filters, with the yellow line indicating the location and the direction of cross-sectional fluorescence intensity profiles. (b) NIR-Ⅱ FLI of the mouse abdominal blood vessels, with the yellow line indicating the precise position and direction corresponding to the cross-sectional fluorescence intensity profiles. (c) NIR-Ⅱ fluorescence image of lymph nodes, with the yellow line indicating the precise position and direction corresponding to the cross-sectional fluorescence intensity profiles depicted in (d). (e) NIR-Ⅱ FLI of the tumor location every 5 h after administration of TTDOC NPs. (f) NIR-Ⅱ FLI of the major organs ex vivo. Fluorescence intensity analysis of TTDOC NPs distribution in major organs ex vivo in (g). (h) Fluorescence intensity curve of the tumor sites over various time intervals corresponding to (e). (i) In vivo photoacoustic images of tumors at various points following tail-vein injection of TTDOC NPs upon 808 nm laser irradiation. (j) Corresponding photoacoustic values after intravenous administration of TTDOC NPs over different time intervals. (k) 3D image of the tumor at 20 h post-injection. (l) 3D photoacoustic images of blood vessels at 2 h post-injection, and the highlighted line indicates the precise position and direction corresponding to the cross-sectional fluorescence intensity profiles depicted in (m). Data are presented as mean ± SD (n = 3).
In addition, in vivo NIR-Ⅱ FLI of TTDOC NPs was conducted on the lymph nodes of healthy mice. Lymph node fluorescence images were captured with an 1100 nm LP filter under 808 nm laser excitation (Fig. 3c). The lymph nodes were clearly visible, and the signal from these regions exhibited an FWHM of 2.3 mm, along with a high SBR of 2.30 (Fig. 3d), demonstrating the high spatiotemporal resolution and superior contrast of TTDOC NPs. The enhanced contrast was attributed to the reduced photon scattering inherent in NIR-Ⅱ light.
Furthermore, in vivo, NIR-Ⅱ FLI was investigated on tumor-bearing mice to study the tumor accumulation of TTDOC NPs (Figs. 3e and h). NIR-Ⅱ fluorescence images were captured at various time intervals following TTDOC NPs administration, showing a gradual increase in fluorescence intensity, which peaked at 20 h post-injection before gradually diminishing. As results suggested that 20 h post-injection represented the optimal time window for phototherapy. For the study of the biological distribution of TTDOC NPs, ex vivo NIR-Ⅱ fluorescence pictures of major organs and tumors were captured (Figs. 3f and g). The results showed that TTDOC NPs predominantly accumulated in the liver and tumor regions, indicating their potential for targeted tumor treatment. The liver's significant role in blood circulation and drug metabolism likely contributed to the observed accumulation and higher fluorescence brightness in the organ.
In light of the notable photonic hyperthermia efficacy of TTDOC NPs, as shown in Fig. S10 (Supporting information), in vitro PAI of TTDOC NPs at different concentrations was carried out (Fig. S10a). Under 808 nm excitation, a robust linear correlation was observed between the PA signal intensity and TTDOC NPs concentration, indicating the significant promise of TTDOC NPs for in vivo PAI. Subsequently, following injection of TTDOC NPs into mice bearing 4T1 tumor via tail vein, the photoacoustic signals at the tumor location were captured at various temporal intervals for in vivo PAI investigation (Fig. S10b). As shown in Figs. 3i and j, the photoacoustic signals at the tumor location were progressively enhanced over time, reaching their maximum around 20 h post-injection, which was consistent with the fluorescence enrichment time. In addition, the photoacoustic signals were reconstructed into three dimensional (3D) photoacoustic images with high contrast and high resolution using 3D software, allowing detailed information about the tumor to be obtained by slicing through different cross-sections (Fig. 3k). These 3D images provided a more intuitive view of TTDOC NPs accumulation in the tumor. Additionally, 3D NIR-Ⅱ PAI revealed detailed vascular structures in the abdomen, with Gaussian fits measuring the widths of marked vessels at 0.74 mm (Figs. 3l and m).
To capture real-time temperature fluctuations and monitor PTI directly within tumor areas during laser exposure, an infrared thermal camera was utilized (Fig. S10c). At 20 h after administering TTDOC nanoparticles intravenously, the temperature at the tumor site surged by 17.5 ℃ within 10 min of exposure to an 808 nm laser (Fig. S10d). In contrast, tumors in the PBS control group experienced only a slight temperature rise, peaking at 40.1 ℃. These results confirmed that TTDOC NPs could significantly enhance the local tumor temperature when subjected to 808 nm photoirradiation.
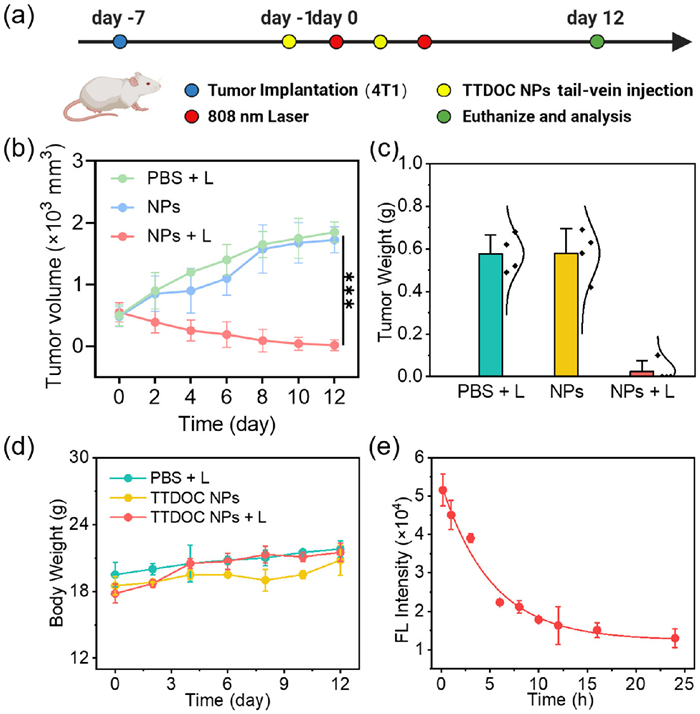
Motivated by the remarkable photothermal conversion performance of TTDOC NPs observed in vitro, we evaluated the in vivo PTT efficacy (Fig. 4a). In this investigation, mice bearing 4T1 tumors served as the experimental model and were randomly assigned into random by three groups (n = 4): (ⅰ) PBS followed by 808 nm laser exposure, (ⅱ) TTDOC NPs without irradiation, and (ⅲ) TTDOC NPs with subsequent 808 nm irradiation. As illustrated in Fig. 4b, tumor volumes increased markedly in both the PBS with laser group and the TTDOC NPs only group. In contrast, complete tumor eradication was achieved in the group receiving both TTDOC NPs and laser irradiation by the 12th day. Representative tumor images (Fig. S11 in Supporting information) and the corresponding average tumor weights (Fig. 4c) further underscore the potent antitumor efficacy of TTDOC NPs when combined with light irradiation.
Figure 4
Figure 4.
(a) Schematic diagram of the treatment of 4T1 tumor-bearing mice. (b) Tumor progression curves (n = 4). ***P<0.001. (c) Tumor weight after treatments (n = 4). (d) Body weight after treatments (n = 4). (e) Characterization of TTDOC NPs' blood circulation following intravenous injection (n = 3). Data are presented as mean ± SD.
To further evaluate the photothermal treatment efficacy, the tumors were collected for histological examination via hematoxylin and eosin (H & E) staining. As illustrated in Fig. S12 (Supporting information), tumors subjected to TTDOC NPs induced PTT displayed pronounced nuclear condensation, fragmentation, and extensive tissue necrosis, corroborating the outstanding PTT efficacy. Additionally, the proliferative capacity of tumor cells in vivo was evaluated using a Ki-67 immunostaining assay across the different treated groups. Compared to the groups receiving PBS with laser or TTDOC NPs alone, the cohort treated with both TTDOC nanoparticles and laser irradiation exhibited a pronounced suppression of tumor cell proliferation. To further elucidate the anti-cancer mechanism activated by TTDOC nanoparticles under laser exposure, histological analyses were performed using terminal deoxynucleotidyl transferase uridine triphosphate nick end labeling (TUNEL) assays 24 h after various treatments. Notably, extensive necrosis and apoptosis were observed in Group Ⅲ with TTDOC NPs + laser, while the other groups (PBS with laser and TTDOC NPs only) revealed negligible cellular damage.
Moreover, the treatments did not alter the body weights of the tumor-bearing mice, implying that PTT mediated by TTDOC nanoparticles exhibits considerable biosafety (Fig. 4d). The in vivo circulation of these nanoparticles was assessed by measuring their concentration in the bloodstream at various time intervals following intravenous injection. Initially, their levels declined swiftly, with the diffusion and elimination half-lives calculated as 2.25 and 1.64 h, respectively, highlighting their outstanding pharmacokinetic properties (Fig. 4e).
Furthermore, there were no histological changes or indications of inflammation in the main organs sampled when stained with H & E. (Fig. S13 in Supporting information). A blood compatibility assay for TTDOC NPs was performed, and in the water-positive control, the supernatant was bright red. On the contrary, in the PBS/TTDOC NPs group, the supernatant had almost no red color (Fig. S14a in Supporting information). The results of detailed blood biochemistry analysis revealed no apparent difference compared with the control group even after 12 d following injection with TTDOC NPs (Figs. S14b–f in Supporting information). These results collectively demonstrated the biological security of TTDOC NPs.
In conclusion, we designed and successfully synthesized an innovative thienothiadiazole-derived NIR-Ⅱ fluorescent dye, TTDOC, with a D-A-D scaffold that exhibited promising potential for photoacoustic/fluorescence imaging-guided PTT. The integration of electron-deficient thienothiadiazole as an acceptor with triphenylamine as a donor in the TTDOC structure resulted in a significant fluorescence QY of 1.7% in DCM. The encapsulation of TTDOC with biocompatible polymer F-127 led to the formation of stable TTDOC NPs with significant NIR absorption peaked at 755 nm. Upon 808 nm laser irradiation, TTDOC NPs exhibited a PCE of 51.6%, along with a weak fluorescence band spanning 900–1150 nm, peaking at 1054 nm. These optical properties enabled the effective use of TTDOC NPs in vivo settings, where they demonstrated the capability to perform dual-modal imaging (photoacoustic and fluorescence) and guide PTT with high precision. The promising results obtained from this study underscored the capability of TTDOC NPs as a multifunctional theranostic material for cancer therapy.
Declaration of competing interest
The authors declare that they have no known competing financial interests or personal relationships that could have appeared to influence the work reported in this paper.
CRediT authorship contribution statement
Xu Sun: Writing – review & editing, Writing – original draft, Visualization, Formal analysis, Data curation, Conceptualization. Mengchen Luo: Formal analysis, Data curation, Conceptualization. Xinyu Xie: Formal analysis, Data curation. Mengyao Liu: Formal analysis, Data curation. Weili Wang: Formal analysis, Data curation, Conceptualization. Tian Zhang: Formal analysis, Data curation, Conceptualization. Lei An: Formal analysis, Data curation, Conceptualization. Jinjun Shao: Project administration, Methodology, Investigation, Funding acquisition, Formal analysis, Data curation, Conceptualization. Xiaochen Dong: Project administration, Methodology, Investigation, Funding acquisition, Formal analysis, Data curation, Conceptualization. Yu Cai: Project administration, Methodology, Investigation, Funding acquisition, Formal analysis, Data curation, Conceptualization.
Acknowledgments
The work was supported by the National Natural Science Foundation of China (Nos. 62235007, 62275119), and the Natural Science Foundation of Jiangsu Province (No. BZ2024040). Research Innovation Plan for Graduate Students in Jiangsu Province (No. KYCX24_1638).
Supplementary materials
Supplementary material associated with this article can be found, in the online version, at doi:10.1016/j.cclet.2025.111509.
[1]
S. Wang, L. Gai, Y. Chen, et al., Chem. Soc. Rev. 53 (2024) 3976–4019. doi: 10.1039/d3cs00456b
[2]
G. Feng, G. Zhang, D. Ding, Chem. Soc. Rev. 49 (2020) 8179–8234. doi: 10.1039/d0cs00671h
L. He, L. Wang, Z. He, et al., Chin. Chem. Lett. 35 (2024) 110717.
Figure 1
(a) Chemical structure of TTDOC. (b) HOMO/LUMO distribution and energy levels of TTDOC. (c) Dynamic light scattering (DLS) profile of TTDOC NPs. Inset, TEM image. (d) Normalized absorbance and fluorescence of TTDOC in dichloromethane and TTDOC NPs in aqueous solution. (e) Photothermal curves of TTDOC NPs (100 µg/mL) exposed to an 808 nm laser (1.0 W/cm2, 10 min). (f) Photothermal stability of TTDOC NPs upon exposure to irradiation (808 nm, 1.0 W/cm2).
Figure 2
(a) Schematic illustration of TTDOC NPs PTT. (b, c) Assessment of cell viability in 4T1 cells subjected to varying concentrations of TTDOC NPs evaluated via MTT. (d) Fluorescence images of cells after staining by calcein-AM/PI. Scale bar: 100 µm. (e, f) JC-1 probe to identify alterations in MMP in 4T1 cells. Scale bar: 50 µm. (g, h) Apoptosis analysis of TTDOC NPs by FCM. ****P<0.0001. Data are presented as mean ± SD (n = 3).
Figure 3
(a) Whole-body blood vessel FLI of TTDOC NPs with different LP filters, with the yellow line indicating the location and the direction of cross-sectional fluorescence intensity profiles. (b) NIR-Ⅱ FLI of the mouse abdominal blood vessels, with the yellow line indicating the precise position and direction corresponding to the cross-sectional fluorescence intensity profiles. (c) NIR-Ⅱ fluorescence image of lymph nodes, with the yellow line indicating the precise position and direction corresponding to the cross-sectional fluorescence intensity profiles depicted in (d). (e) NIR-Ⅱ FLI of the tumor location every 5 h after administration of TTDOC NPs. (f) NIR-Ⅱ FLI of the major organs ex vivo. Fluorescence intensity analysis of TTDOC NPs distribution in major organs ex vivo in (g). (h) Fluorescence intensity curve of the tumor sites over various time intervals corresponding to (e). (i) In vivo photoacoustic images of tumors at various points following tail-vein injection of TTDOC NPs upon 808 nm laser irradiation. (j) Corresponding photoacoustic values after intravenous administration of TTDOC NPs over different time intervals. (k) 3D image of the tumor at 20 h post-injection. (l) 3D photoacoustic images of blood vessels at 2 h post-injection, and the highlighted line indicates the precise position and direction corresponding to the cross-sectional fluorescence intensity profiles depicted in (m). Data are presented as mean ± SD (n = 3).
Figure 4
(a) Schematic diagram of the treatment of 4T1 tumor-bearing mice. (b) Tumor progression curves (n = 4). ***P<0.001. (c) Tumor weight after treatments (n = 4). (d) Body weight after treatments (n = 4). (e) Characterization of TTDOC NPs' blood circulation following intravenous injection (n = 3). Data are presented as mean ± SD.

 DownLoad:

 下载:
下载:


 下载:
下载:
