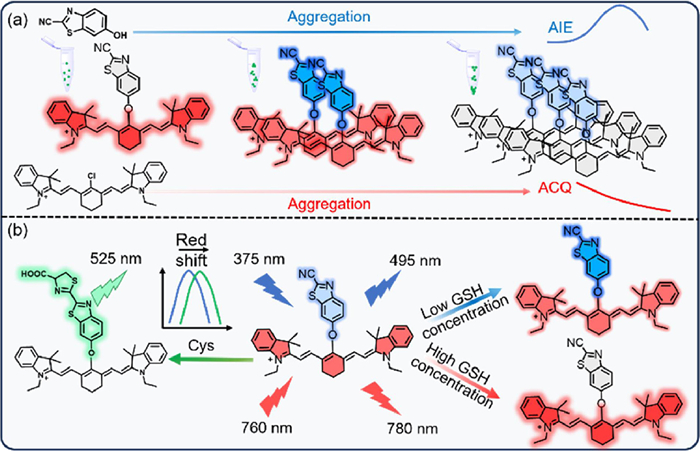
Scheme 1.
(a) The aggregation of NPCS and corresponding AIE and ACQ effects. (b) The sensing mechanism of NPCS for Cys and GSH with dual-channel response.

Biothiols, such as glutathione (GSH) and cysteine (Cys), not only serve as precursors for the synthesis of proteins and enzymes in cells but also participate in many physiological processes in living systems [1-3]. Recently, studies have shown that the depletion of GSH always leads to abnormalities in iron metabolism and activation of cellular stress responses. For example, GSH depletion in the central nervous system would induce ferroptosis, leading to neurological damage, cognitive dysfunction, and neurodegenerative diseases [4,5]. Besides, it has been demonstrated that the depletion of Cys directly inhibits GSH synthesis [6,7], leading to severe ferroptosis [8-13]. In terms of molecular structure, although the spatial distance between the thiol group and amino group in GSH is larger than that of Cys, however, they both contain sulfhydryl, carboxyl, and amino functional groups. Due to the similar chemical structures in Cys and GSH, their chemical properties are extremely similar, which remains a major challenge for the differential recognition of these biomolecules.
Several multichannel fluorescent probes have been developed for the differential detection of thiols. In 2018, Zhao et al. [14] reported a turn-on fluorescent probe which has been used for differential detection of Cys and homocysteine (Hcy)/GSH in different channels, and it has been successfully used for imaging Cys and GSH in HeLa cells. In 2019, Yao et al. [15] developed a novel fluorescent probe with multiple response sites based on different reaction mechanisms between the probe and thiols, with three emission channels: blue, green, and yellow channel, respectively. Similarly, in 2021, Yin et al. [16] synthesized a multisite-binding fluorescent probe that responded to mitochondrial Cys, GSH, and Hcy from three fluorescent channels simultaneously, which was successfully applied to monitor mitochondrial Cys, GSH, and Hcy from blue, green, and red fluorescent channels in live cells and zebrafish, respectively. In terms of fluorescence emission spectra, there is still spectral overlap between channels, which can cause false positives due to the response signals interfering with each other. Additionally, these probes exhibit a specific response to each biothiol based on corresponding alterations in single-channel fluorescence intensity, which may be susceptible to false positives or human interference arising from complex environments.
In order to solve these problems, it is an urgent to develop new probes for the differential detection of biothiols, which should meet the following characteristics. Firstly, there should be an independent response channel between multiple signals to avoid spectral overlap. Secondly, each biothiol may respond to the probe with at least two independent emission channels to verify the corresponding results. Thirdly, significant fluorescence changes could achieve when it refers to the biothiols depletion.
Based on the requirements presented above, we attempted to develop an ideal biothiol probe in this work. The Nobel Prize in Chemistry 2022 was awarded jointly to Carolyn R. Bertozzi, Morten Meldal, and K. Barry Sharpless for the development of click chemistry and bioorthogonal chemistry. Such a rapid and selective concept was completely consistent with our design in fluorescent probes. Previously, our group proposed a thiol-chromene click chemistry strategy for the detection of thiols [17,18], however, this strategy still did not satisfy the above proposed problem well. It is well known that the condensation reaction between 2-cyanobenzothiazole (CBT) and Cys is one of the classical bioorthogonal click chemistry reactions [19-22]. And it was also found the fluorescence of CBT would be quenched with the physiological concentrations of GSH. These results indicated that CBT might be used for discriminative recognition of GSH and Cys. However, the short emission wavelength of CBT limits its applications. It is well known that the near-infrared (NIR) and short-wave emission channels are well separated from each other with no spectrum overlap. Besides, cyanine dye shows emission in the NIR region with excellent fluorescence quantum yield, high absorption coefficient, and excellent biocompatibility, which fulfills the meets mentioned above [23]. Nowadays, lots of works have been reported on the development of NIR fluorescent probes for the detection of thiols by using cyanine dyes as NIR fluorophores [24-30]. Therefore, we introduced the NIR cyanine dye and CBT for the synthesis of a dual-channel fluorescent probe, named NPCS, for the differential monitoring of GSH and Cys in living cells (Scheme 1). In particular, we found that both aggregation-caused quenching (ACQ) and aggregation-induced emission (AIE) were present in the molecule NPCS. As far as we know, it was the first time that a single fluorescent molecular displayed both AIE and ACQ effects together [31-33]. Moreover, it could be also used to discriminate recognition of both high and low concentrations of GSH with different signals. For Cys, it could induce the red-shift of blue fluorescence in the blue channel and quench the NIR fluorescence by the specific click reaction (CBT-Cys). As a whole, the probe NPCS produced opposite fluorescent signal changes in two separate channels for GSH and Cys, which greatly improved the accuracy of differentiating for monitoring of GSH and Cys. Eventually, the probe was successfully used for visualization of intracellular Cys and GSH as well as its depletion, and tracking the reactive oxygen species (ROS)-induced cellular GSH and Cys levels changes in biological systems. Besides, we also evaluated the fluctuations of Cys and GSH in cancer cells under the effects of different anticancer drugs by using the probe NPCS.
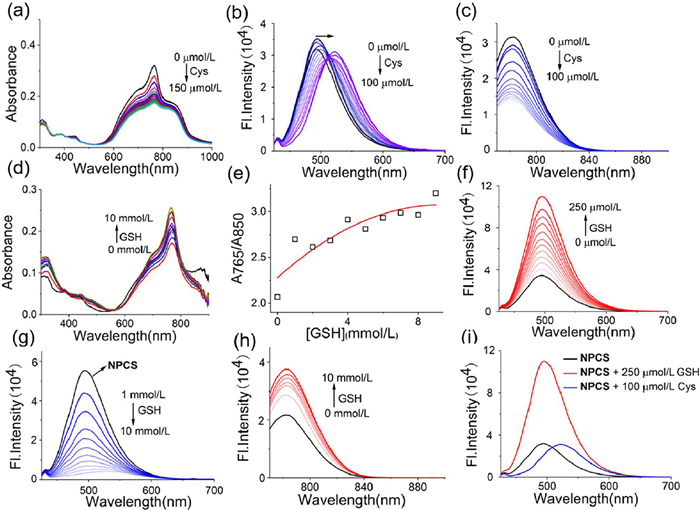
The probe NPCS was synthesized according to the synthesis steps in Supporting information. First, we investigated the optical properties and fluorescence response of the NPCS in phosphate-buffered saline (PBS) (pH 7.4) with GSH and Cys, respectively. As shown in Fig. 1a, the NPCS itself showed a major absorption peak at 760 nm, which gradually decreased with increasing Cys. However, when GSH (0–10 mmol/L) was continuously added to NPCS, the absorption at 760 nm gradually increased, while the shoulder peak at 850 nm gradually disappeared (Figs. 1d and e). For fluorescence investigation, NPCS displayed a blue emission peak at 495 nm, and it was red-shifted to 525 nm with the continuous increase of Cys (Fig. 1b). Meanwhile, the probe NPCS showed a NIR fluorescence emission at 780 nm, and the NIR fluorescence intensity gradually decreased with the increase of Cys (Fig. 1c). After that, we tested the dual-channel fluorescence response with GSH. After the addition of GSH (0–250 µmol/L) to the solution of NPCS, we noticed that the fluorescence intensity at 495 nm gradually enhanced with the excitation of 375 nm. And the NIR fluorescence at 780 nm was also increased with 760 nm excitation (Figs. 1f and h). However, we found that when GSH (1–10 mmol/L) was added to the NPCS system, the fluorescence intensity at 495 nm was gradually decreased until quenched (Fig. 1g). However, the NIR fluorescence emission at 780 nm was enhanced under the same condition (Fig. 1h). From Fig. 1i, we could clearly see that after the reaction of the probe with 100 µmol/L Cys the emission wavelength was shifted forward from 495 nm to 525 nm, whereas the presence of 250 µmol/L GSH would induce the increase of fluorescence intensity at 495 nm. The above results indicated that the probe was capable of differentially detection Cys and GSH both in the short-wave (blue channel) and NIR emission regions. Besides, as shown in Fig. S10 (Supporting information), the fluorescence ratio obtained by NPCS with Cys at 525 nm and 495 nm was linearly correlated with Cys concentration (R2 = 0.9949); and fluorescence changes at 495 nm were linearly correlated with GSH concentration (R2 = 0.9962). In addition, the corresponding detection limits of the probe for Cys and GSH were calculated to be 2.19 and 3.49 µmol/L, respectively, according to the International Union of Pure and Applied Chemistry (IUPAC) definition (limit of detection (LOD) = 3Sb/m).
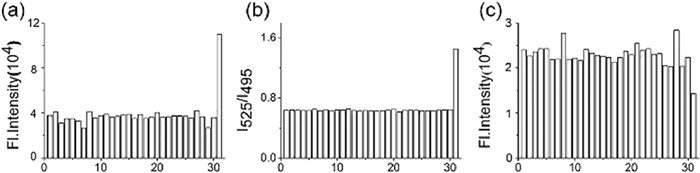
To examine the selection of NPCS for GSH and Cys detection in biological systems, we investigated the fluorescence changes of probe NPCS with various biologically relevant species, including amino acids (Cys, Hcy, GSH, Arg, Asp, Leu, Glu, His, Lys, Met, Pro, Ser, Thr, Tyr and Val), metal ions (Ca2+, Fe2+, K+, Mg2+ and Zn2+) and anions (SO42−, CO32−, HPO42−, SO32−, F−, HSO3−, NO2−, S2−, SCN−, OAc−, S2O32−). As shown in Fig. 2a, only the presence of GSH significantly enhanced the fluorescence intensity of the NPCS at 495 nm under the excitation of 375 nm, and the changes induced by other analytes were negligible. Besides, only Cys caused a significant increase in fluorescence ratio at 525 and 495 nm (Fig. 2b). Meanwhile, under excitation at 760 nm, Cys significantly reduced the fluorescence intensity of NPCS at 780 nm compared with the other analytes (Fig. 2c). Based on these results, we could conclude that NPCS was highly specific for Cys and GSH. Next, we tested the effect of pH on the sensing performance of NPCS with Cys and GSH. The results showed that NPCS worked quite well with Cys or GSH over a wide pH range of 6.0–9.0, reflecting the fact that probe NPCS was suitable for Cys or GSH in physiological conditions.
Next, we investigated the sensing mechanism of the probe NPCS with Cys and GSH by high-performance liquid chromatography-mass spectrometry (HPLC-MS). As shown in Fig. S6 (Supporting information), the retention time at 11.99 min corresponded to the m/z value of 651.31921, and the compound was the probe NPCS. As shown in Fig. S7 (Supporting information), after the probe reacted with Cys, a new peak with the retention time at 11.31 min corresponded to the m/z value of 755.31360 appeared, which corresponded to the addition product of NPCS and Cys. These results verified our prediction about the mechanism of NPCS reaction with Cys. As shown in Fig. S8 (Supporting information), when GSH was added to the solution of NPCS, we could only observe the peak with a retention time of 12.05 min, which corresponded to the m/z value of 651.31946 (NPCS). Apart from this peak, we did not find the possible product peaks corresponding to NPCS and GSH adducts, which suggested that NPCS could not react with GSH in the nucleophilic aromatic substitution-rearrangement manner as it has been proved before. As a result, the HPLC-MS experiment could not explain the fluorescence changes of NPCS with GSH. Hence, we speculated that these changes obtained in the fluorescence and ultraviolet-visible (UV–vis) spectrum might be due to the effect related to typical weak interactions.
Considering the possible aggregation of the NPCS itself in the UV absorption spectra (wide and inconspicuous peak), we further investigated the possible aggregation effect of the NPCS in the following studies. As shown in Figs. 3a and b, the absorption at 765 nm gradually increased with increasing probe concentration, while the shoulder front at 850 nm gradually strengthened, indicating the possibility of forming J-aggregates of NPCS. However, when the content of organic solvents such as DMSO (Figs. 3c and d) and EtOH (Figs. 3e and f) increased, the absorption peaks at 765 nm gradually increased and formed the typical shape of the characteristic peak of cyanine dyes. Meanwhile, the ratio of A765/A850 increased along with the addition of organic solvent, which indicated that the presence of organic solvents could induce the disaggregation of NPCS aggregates. Besides, as shown in Fig. 3h, the fluorescence intensity gradually decreased with increasing probe concentration under 760 nm excitation, which suggested an ACQ of the fluorescence of cyanine in NPCS. However, the fluorescence emission continued to increase with the addition of DMSO and EtOH under 760 nm excitation, which also demonstrated that the disaggregation could enhance the NIR fluorescence (Figs. 3j and l). Importantly, the aggregation and disaggregation behaviors observed in the fluorescence spectra and ultraviolet absorption spectra were consistent with those of GSH, which indicated the disaggregation roles of GSH towards NPCS aggregates.
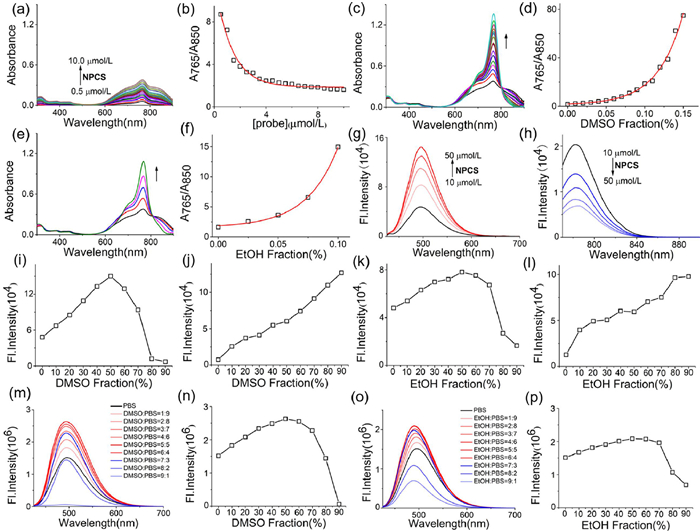
Next, we explored the mechanism of fluorescence changes of NPCS at 495 nm. As shown in Fig. 3g, under excitation at 375 nm, the fluorescence intensity gradually increased with increasing probe NPCS concentration. As shown in Figs. 3i and k, under the excitation of 375 nm, the fluorescence intensity of NPCS increased with the addition of DMSO or EtOH, then gradually decreased when the volume ratio was over 50%, and the fluorescence was almost quenched with DMSO/PBS (9/1, v/v). As a result, we could conclude that the observed fluorescence of CBT moiety was due to the AIE. To confirm the AIE properties of CBT, then we tested the fluorescence changes of CBT in different mixtures (PBS with DMSO/EtOH). As shown in Figs. 3m–p, with the increased proportion of DMSO/EtOH, the fluorescence was eventually quenched as observed before in Figs. 3i and k. Therefore, the fluorescence changes at 495 nm in the blue channel with NPCS and GSH were due to the AIE effect. As a whole, the spectral changes of the NPCS and GSH were triggered by the AIE and the corresponding disaggregation effect of GSH. Furthermore, we found that NPCC, the product of the NPCS and Cys also displayed aggregated performance in PBS (Fig. S9 in Supporting information). In summary, an aggregation of ACQ and AIE phenomenon was discovered in NPCS, which had never been used before in the emergence of our work. Besides, within the unique property of AIE and ACQ in NPCS, we have realized the differential detection of different concentrations of GSH for the first time. In addition, considering that almost all of the reported differential recognition probes face an unavoidable competitive response of analytes with limited probes, especially when it comes to abundant GSH (about 10 mmol/L), the results obtained always suffer from interference. In contrast, the proposed non-responsive GSH detection in this work would not consume the probe and therefore possessed a potential application for discriminating GSH from Cys.
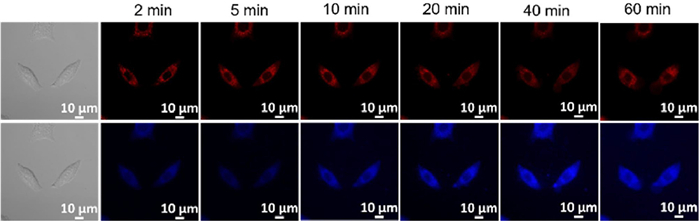
Before cell imaging, we first evaluated the biocompatibility of the NPCS by cell counting kit-8 (CCK-8) toxicity assay. As shown in Fig. S12 (Supporting information), the presence of NPCS caused slight damage to the cells. We then applied the NPCS to A549 cells to evaluate its application for cell imaging. A549 cells were co-incubated with NPCS (10 µmol/L) for 60 min. As shown in Fig. 4, after 2 min of incubation, we could observe fluorescent signals both in the red channel and the blue channel, which indicated that NPCS could easily permeate the cell membrane.
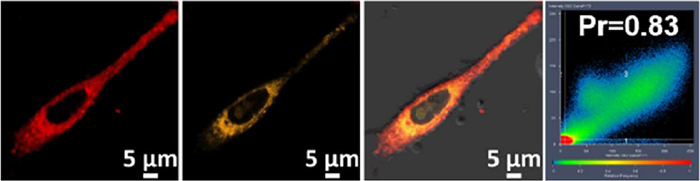
To test the mitochondrial targeting ability of the NPCS, a fluorescence co-localization experiment was performed by using Mito-Tracker red (a well-known mitochondrial dye). As shown in Fig. 5, the fluorescence signal of NPCS in the red channel overlapped well with the fluorescence signal of Mito-Tracker red in the yellow channel with a high Pearson's correlation coefficient (0.83). These results indicated that NPCS exhibited excellent mitochondrial target ability.
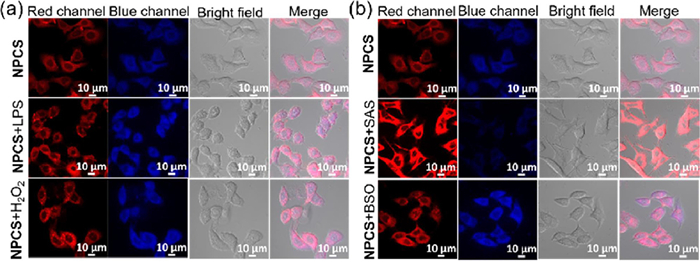
Next, we investigated the performance of NPCS for imaging endogenous GSH and Cys in A549 cells. After A549 cells were pretreated with lipopolysaccharides (LPS) for 24 h, NPCS was added to the treated cells for another 30 min. As shown in Fig. 6a, both the fluorescent signals in the red channel and the blue channel were enhanced compared to that of the control group (without LPS). These results indicated the presence of LPS would lead to the depletion of endogenous GSH and Cys. Similarly, results were observed when A549 cells were pretreated with H2O2, an oxidizer of biothiols. Next, we further investigated the sensing performance of NPCS with Cys scavenger (SAS) and GSH scavenger, L-buthionine-sulfoximine (BSO) treatment. As shown in Fig. 6b, after A549 cells were pretreated with SAS for 24 h, the fluorescence signals in the red channel were enhanced, however, the signals in the blue channel were decreased compared with the NPCS group. Besides, after A549 cells were pretreated with BSO for 24 h, we noticed that the fluorescent signals were increased in both the red channel and blue channel. All these results suggested that NPCS displayed excellent performance for imaging intracellular Cys and GSH concentration fluctuations.
Then we evaluated the ability of NPCS to monitor of exogenous Cys and GSH in living cells. As shown in Fig. 7a, A549 cells were pretreated with Cys (200 µmol/L) for 1 h, then incubated with NPCS for another 30 min. It could be noticed that the fluorescence in the blue channel was gradually enhanced, suggesting that the addition of exogenous Cys may reduce the level of endogenous GSH. Besides, glutathione ethyl ester (GSHee) has been demonstrated to increase intracellular GSH, hence we pretreated A549 cells with 200 µmol/L GSHee for 1 h. As shown in Fig. 7b, a gradual enhancement of blue fluorescence was observed over time, which suggested that the addition of GSHee also induced the exhaustion of endogenous GSH under normal cell conditions.
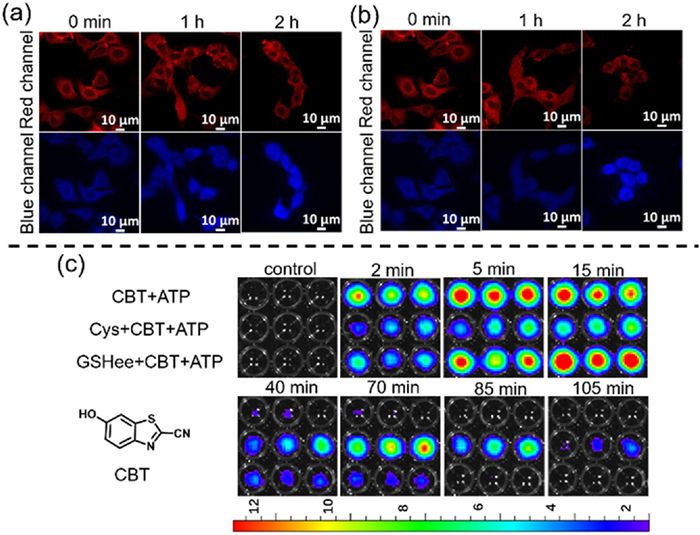
To further investigate this unusual phenomenon, we utilized click chemistry (CBT-Cys) and corresponding luminescence to evaluate the Cys levels under exogenous Cys and GSH treatment. The cells of the CBT+adenosine triphosphate (ATP) group were incubated with only 50 µmol/L CBT and 500 µmol/L ATP, and the Cys+CBT+ATP group was pretreated with 200 µmol/L Cys for 1 h before treating A549-Luc cells with 50 µmol/L CBT and 500 µmol/L ATP, and the GSHee+CBT+ATP group was pretreated with 200 µmol/L GSHee for 1 h followed with 50 µmol/L CBT and 500 µmol/L ATP treatment. As shown in Fig. 7c, we could notice that the bioluminescence intensity of the Cys+CBT+ATP group was weaker than that of the CBT+ATP group, suggesting that the addition of Cys decreased the level of endogenous Cys. Moreover, as shown in Fig. 7c, the bioluminescence intensity of this group gradually increased within 70 min and lasted about 2 h. These results clearly demonstrated that the presence of Cys would decrease intracellular Cys. The reason might be that the presence of exogenous Cys induced the generation of ROS to translate extra Cys as cystine. Similarly, we also observed a weaker bioluminescence intensity in the GSHee+CBT+ATP treated group, which suggested that the addition of GSHee would also decrease the endogenous Cys. However, the bioluminescence of the GSHee+CBT+ATP group increased after 5 min and lasted until 70 min. These results might be due to the fact that GSHee could converted into Cys for replenishment when it was consumed. In conclusion, the addition of either Cys or GSH would reduce the level of endogenous Cys and GSH, which is contrary to conventional wisdom.
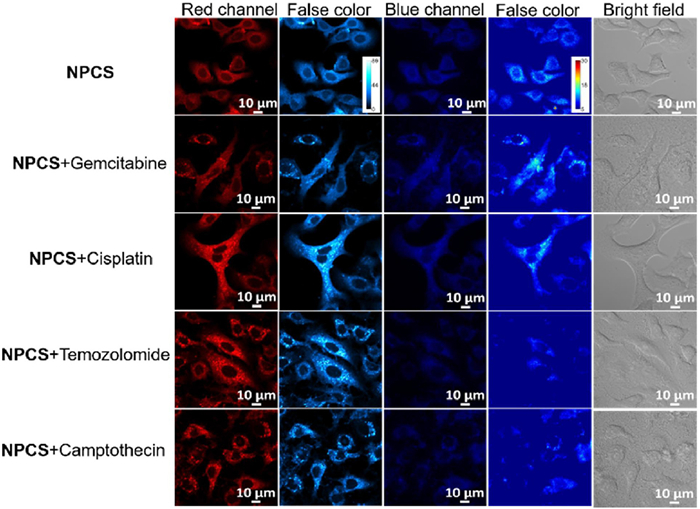
Finally, we investigated the levels of intracellular GSH and Cys under the treatment of different anticancer drugs. As shown in Fig. 8, the fluorescence intensity of both the red channel and the blue channel enhanced in the groups of gemcitabine and cisplatin compared with the control group, suggesting that these two anticancer drugs led to a decrease of intracellular GSH and Cys. However, the temozolomide and camptothecin groups showed enhanced signals in the red channel and weakened fluorescence in the blue channel, suggesting that it would lead to the up-regulation of GSH in living cells.
In summary, we developed and synthesized the first two-channel fluorescent probe NPCS, which showed the non-competitive differentiation of GSH and Cys. Particularly, for the first time the otherwise opposing ACQ and AIE fluorescence behaviors simultaneously existed in a single fluorescent molecule. Due to the specific manners, it has been successfully used to distinguish between high and low concentrations of GSH responses. The presence of Cys would react with NPCS by a well-known click reaction to induce changes in fluorescence emission. In addition, the proposed non-reactive GSH detection strategy would not consume NPCS, so it may be more suitable for the discriminative recognition of GSH and Cys. Based on such a unique probe, herein we have witnessed the dynamic changes of GSH and Cys in living cells under the treatment of different drugs. We believe that this strategy will be widely used for the design of dual-site fluorescent probes in the future.
The authors declare that they have no known competing financial interests or personal relationships that could have appeared to influence the work reported in this paper.
Pei Huang: Writing – original draft, Investigation. Weijie Zhang: Validation, Software, Formal analysis. Fangjun Huo: Supervision, Conceptualization. Caixia Yin: Writing – review & editing, Project administration.
We thank the National Natural Science Foundation of China (Nos. 22207069, 22477074), Research Project Supported by Shanxi Scholarship Council of China (No. 2022–002), the Shanxi Province Science Foundation (No. 202203021221009), Shanxi Province science and technology activities for overseas people selected funding project (No. 2024001).
Supplementary material associated with this article can be found, in the online version, at doi:
R. He, D. Tang, N. Xu, et al., Chin. Chem. Lett. 35 (2024) 108658. doi: 10.1016/j.cclet.2023.108658
Y. Cheng, X. Wang, J. Chen, et al., Chin. Chem. Lett. 35 (2024) 109156. doi: 10.1016/j.cclet.2023.109156
H. Zhang, R. Feng, W. Yu, et al., Chin. Chem. Lett. 36 (2025) 110528. doi: 10.1016/j.cclet.2024.110528
K. Chen, X. Jiang, M. Wu, et al., Front. Cell Dev. Biol. 9 (2021) 704298. doi: 10.3389/fcell.2021.704298
Q. Tan, Y. Fang, Q. Gu, Front. Pharmacol. 12 (2021) 657033. doi: 10.3389/fphar.2021.657033
X. Liu, K. Olszewski, Y. Zhang, et al., Nat. Cell Biol. 22 (2020) 476–486. doi: 10.1038/s41556-020-0496-x
Z. Shi, N. Naowarojna, Z. Pan, Y. Zou, Nat. Commun. 12 (2021) 4792. doi: 10.1038/s41467-021-25159-5
X. Cheng, H.D. Xu, H.H. Ran, et al., ACS Nano 15 (2021) 8039–8068. doi: 10.1021/acsnano.1c00498
Z. Tang, P. Zhao, H. Wang, Y. Liu, W. Bu, Chem. Rev. 121 (2021) 1981–2019. doi: 10.1021/acs.chemrev.0c00977
B.R. Stockwell, Cell 185 (2022) 2401–2421. doi: 10.1016/j.cell.2022.06.003
J.A. Combs, G.M. DeNicola, Cancers (Basel) 11 (2019) 678. doi: 10.3390/cancers11050678
M.A. Badgley, D.M. Kremer, H.C. Maurer, et al., Science 368 (2020) 85–89. doi: 10.1126/science.aaw9872
M. Gao, J. Yi, J. Zhu, et al., Mol. Cell 73 (2019) 354–363. e3. doi: 10.1016/j.molcel.2018.10.042
J. Zhang, X. Ji, H. Ren, et al., Sens. Actuators B: Chem. 260 (2018) 861–869. doi: 10.1016/j.snb.2018.01.016
G. Yin, T. Niu, T. Yu, et al., Angew. Chem. Int. Ed. 58 (2019) 4557–4561. doi: 10.1002/anie.201813935
H. Jiang, G. Yin, Y. Gan, et al., Chin. Chem. Lett. 33 (2022) 1609–1612. doi: 10.1016/j.cclet.2021.09.036
Y. Yang, F. Huo, C. Yin, et al., Biosens. Bioelectron. 47 (2013) 300–306. doi: 10.1016/j.bios.2013.03.007
Y. Yue, C. Yin, F. Huo, et al., Sens. Actuators B: Chem. 223 (2016) 496–500. doi: 10.1016/j.snb.2015.09.127
Y. Zhu, X. Zhang, Q. You, et al., Bioorg. Med. Chem. 68 (2022) 116881. doi: 10.1016/j.bmc.2022.116881
K. Li, Q. Wang, X. Gao, et al., J. Control. Release 373 (2024) 967–977. doi: 10.1016/j.jconrel.2024.07.005
X. Hu, R. Tang, L. Bai, et al., View 4 (2023) 20220065. doi: 10.1002/VIW.20220065
Y. Qing, M.D. Liu, D. Hartmann, et al., Angew. Chem. Int. Ed. 59 (2020) 15711–15716. doi: 10.1002/anie.202005729
Y. Li, Y. Zhou, X. Yue, et al., Adv. Healthc. Mater. 9 (2020) 2001327. doi: 10.1002/adhm.202001327
K. Yin, F. Yu, W. Zhang, et al., Biosens. Bioelectron. 74 (2015) 156–164. doi: 10.1016/j.bios.2015.06.039
J. Li, J. Ge, Z. Zhang, et al., Sens. Actuators B: Chem. 296 (2019) 126578. doi: 10.1016/j.snb.2019.05.055
L. Yue, Y. Ai, G. Liu, et al., Analyst 148 (2023) 4829–4836. doi: 10.1039/d3an00871a
T. Guo, X. Chen, W. Qu, et al., Anal. Chem. 94 (2022) 5006–5013. doi: 10.1021/acs.analchem.1c04895
Y. Xu, R. Li, X. Zhou, et al., Talanta 205 (2019) 120125. doi: 10.1016/j.talanta.2019.120125
S. Qi, H. Zhang, X. Wang, et al., Talanta 234 (2021) 122685. doi: 10.1016/j.talanta.2021.122685
X. Zhang, N. He, Y. Huang, et al., Sens. Actuators B: Chem. 282 (2019) 69–77282. doi: 10.1016/j.snb.2018.11.056
D. Zhai, W. Xu, L. Zhang, et al., Chem. Soc. Rev. 43 (2014) 2402–2411. doi: 10.1039/c3cs60368g
J. Qi, X. Hu, X. Dong, et al., Adv. Drug Deliv. Rev. 143 (2019) 206–255. doi: 10.3390/ijms20010206
J. Xu, M. Huang, H. Pang, et al., Aggregate 5 (2024) 206–255.

Scheme 1 (a) The aggregation of NPCS and corresponding AIE and ACQ effects. (b) The sensing mechanism of NPCS for Cys and GSH with dual-channel response.

Figure 1 Absorption spectral response (a) and fluorescence spectral response (b, c) of probe NPCS (10 µmol/L) detecting Cys. Absorption spectral response (d) and fluorescence spectral response (f, h) of probe NPCS (10 µmol/L) detecting GSH. (e) The UV absorption ratio (A765/A850) of the probe NPCS versus GSH concentration (0–10 mmol/L). (g) Fluorescence spectral changes of probe NPCS (10 µmol/L) upon the addition of GSH (1–10 mmol/L) in visible channel. (i) Fluorescence response of probe NPCS (10 µmol/L) to GSH (250 µmol/L) or Cys (100 µmol/L) in visible channel. The excitations wavelengths of visible and NIR channels were set as 375 and 760 nm, respectively.

Figure 2 (a) Selectivity of probe NPCS (10 µmol/L) upon various species (2.5 mmol/L, 31-GSH: 250 µmol/L) excited at 375 nm. (b) Selectivity of probe NPCS (10 µmol/L) upon various species (1 mmol/L, 31-Cys: 100 µmol/L) excited at 375 nm. (c) Selectivity of probe NPCS (10 µmol/L) upon various species (1 mmol/L, 31-Cys: 100 µmol/L) excited at 760 nm. Analytes including 1-SO42−, 2-Arg, 3-Asp, 4-Ca2+, 5-Leu, 6-Fe2+, 7-Glu, 8-Hcy (5 µmol/L), 9-His, 10-K+, 11-Lys, 12-Met, 13-Mg2+, 14-CO32−, 15-HPO42−, 16-SO32− (5 µmol/L), 17-F−, 18-HSO3− (5 µmol/L), 19-NO2−, 20-S2− (5 µmol/L), 21-SCN− (5 µmol/L), 22-OAc−, 23-Pro, 24-S2O32−, 25-Ser, 26-Thr, 27-Tyr, 28-Val (5 µmol/L), 29-Zn2+, 30-probe NPCS.

Figure 3 (a) UV absorption spectra of the probe NPCS (0.5–10 µmol/L). (b) Plot of the UV absorption ratio (A765/A850) of probe NPCS (0.5–10 µmol/L). (c) UV absorption plots of the probe with increased DMSO fraction. (d) Plot of the UV absorption ratio (A765/A850) of probe NPCS versus increased DMSO fraction (DMSO: PBS, %). (e) UV absorption plots of the probe with increased EtOH fraction (EtOH: PBS, %). (f) Plot of the UV absorption ratio (A765/A850) of probe NPCS versus increased EtOH fraction (EtOH: PBS, %). (g) Fluorescence spectral changes of probe NPCS (10–50 µmol/L) in visible channel. (h) Fluorescence spectral changes of probe NPCS (10–50 µmol/L) in NIR channel. (i) The plot of peak intensity (at 495 nm) vs. the increased DMSO fraction (DMSO: PBS, %) of probe NPCS. (j) The plot of peak intensity (at 810 nm) vs. the increased DMSO fraction (DMSO: PBS, %) of probe NPCS. (k) The plot of peak intensity (at 495 nm) vs. the increased EtOH fraction (EtOH: PBS, %) of probe NPCS. (l) The plot of peak intensity (at 800 nm) vs. the increased EtOH fraction (EtOH: PBS, %) of probe NPCS. (m) Fluorescence spectra of CBT at different DMSO fraction. (n) The plot of peak intensity (at 495 nm) vs. the increased DMSO fraction (DMSO: PBS, %) of CBT. (o) Fluorescence spectra of CBT at different EtOH fraction. (p) The plot of peak intensity (at 495 nm) vs. the increased EtOH fraction (EtOH: PBS, %) of CBT. The excitations wavelengths of visible and NIR channels were set as 375 and 760 nm, respectively.

Figure 4 Real-time fluorescence imaging of A549 cells upon addition of probe NPCS (10 µmol/L). Red channel: λem = 670–754 nm (λex = 633 nm); blue channel: λem = 450–550 nm (λex = 405 nm). Scale bar: 10 µm.

Figure 5 (a) Colocalization imaging of NPCS in A549 cells. Cells were stained with mito-tracker red (200 nmol/L, 40 min) followed by NPCS (10 µmol/L, 10 min). Red channel: λex = 633 nm; yellow channel: λex = 568 nm. Scale bar: 5 µm.

Figure 6 (a) Fluorescence images of A549 cells pretreated with no agent, LPS (2 µg/mL, 24 h), H2O2 (0.3 mmol/L, 30 min), respectively, and then treated with NPCS (10 µmol/L, 30 min) in PBS. (b) Fluorescence images of A549 cells pretreated with no agent, SAS (200 µmol/L, 24 h), BSO (20 µmol/L, 24 h), respectively, and then treated with NPCS (10 µmol/L, 30 min) in PBS. Red channel: λem = 670–754 nm (λex = 633 nm); blue channel: λem = 450–550 nm (λex = 405 nm). Scale bar: 10 µm.

Figure 7 (a) Time-dependent fluorescence images of the cells preincubated with 200 µmol/L Cys for 1 h and then cultured with probe NPCS for 120 min. (b) Time-dependent fluorescence images of the cells preincubated with 200 µmol/L GSHee for 1 h and then cultured with probe NPCS for 120 min. (c) Bioluminescence images of A549-Luc cells at different time intervals: incubation of A549-Luc cells with 50 µmol/L CBT and 500 µmol/L ATP (top row); pretreatment of A549-Luc cells with 200 µmol/L Cys for 1 h followed by 50 µmol/L CBT and 500 µmol/L ATP (middle row); and treatment with 200 µmol/L GSHee pretreatment of A549-Luc cells for 1 h followed by 50 µmol/L CBT and 500 µmol/L ATP treatment (bottom row) was collected at 2, 5, 15, 40, 70, 85 and 105 min, respectively. Red channel: λem = 670–754 nm (λex = 633 nm); blue channel: λem = 450–550 nm (λex= 405 nm). Scale bar: 10 µm.

Figure 8 (a) Fluorescence images of A549 cells pretreated with no agent, gemcitabine (2 µmol/L, 24 h), cisplatin (2 µmol/L, 24 h), temozolomide (2 µmol/L, 24 h), camptothecin (2 µmol/L, 24 h), respectively, and then treated with NPCS (10 µmol/L, 30 min) in PBS. Red channel: λem = 670–754 nm (λex = 633 nm); blue channel: λem = 450–550 nm (λex = 405 nm). Scale bar: 10 µm.

 扫一扫看文章

扫一扫关注我们
 DownLoad:
 下载:
下载:
 下载:
下载: