Citation:
WANG Ying, LIN Xiao-Meng, BAI Feng-Ying, ZHANG Rui, ZHANG Xiao-Xi. Syntheses, Structures and Biomimetic Catalytic Bromination of Copper-Triflusal Complexes[J]. Chinese Journal of Inorganic Chemistry,
2017, 33(9): 1667-1677.
doi:
10.11862/CJIC.2017.202

铜三氟柳配合物的合成, 结构和仿生催化溴化
摘要:
合成了一系列2-羟基-4-三氟甲基苯甲酸(h2tba)-铜配合物:[Cu(htba)2(pz)2](1),[Cu(htba)(2,2'-bipy)](htba)(2)和[Cu(htba)2(4,4'-bipy)](3)(h2tba=2-羟基-4-三氟甲基苯甲酸,pz=吡唑,2,2'-bipy=2,2'-联吡啶,4,4'-bipy=4,4'-联吡啶),并且通过元素分析、红外光谱、紫外光谱、粉末X射线衍射、单晶X射线衍射和热重分析方法对配合物结构进行了表征。这些配合物能够在过氧化氢和溴化物存在的条件下催化苯酚红溴化,并且展示出了较高的催化溴化活性。
English
Syntheses, Structures and Biomimetic Catalytic Bromination of Copper-Triflusal Complexes
Abstract:
A series of 2-hydroxy-4-trifluoromethylbenzoic acid(h2tba)-copper complexes:[Cu(htba)2(pz)2] (1), [Cu(htba)(2, 2'-bipy)](htba) (2) and[Cu(htba)2(4, 4'-bipy)] (3) (h2tba=2-hydroxy-4-trifluoromethylbenzoic acid, pz=pyrazole, 2, 2'-bipy=2, 2'-bipyridine, 4, 4'-bipy=4, 4'-bipyridine) have been synthesized and characterized by elemental analysis, IR spectra, UV-Vis, spectroscopy, powder X-ray diffraction, single-crystal X-ray diffraction and thermal gravimetric analysis (TG). The complexes which catalyzed phenol red bromination in the presence of H2O2 and bromide, exhibited high catalytic bromination activity.CCDC:1041787,1;1041788,2;1041789,3.
-
Key words:
- copper complexes
- / triflusal
- / crystal structure
- / catalytic bromination
-
0 Introduction
Continuing interest in the chemistry of copper complexes has been promoted owing to their biological and catalytic properties. While the different property of the copper complexes is mainly dependent on different kinds of ligands, and the key structural feature of the ligands gives rise to a rich variety of complexes with unusual properties. Among the organic ligands, N-heterocyclic ligands[1-3] (e.g. pyrazole, pyri-dine, imidazole) and their derivatives have been widely used in synthesis in coordination chemistry. Especially for pyrazole/pyridine and its derivatives, which have attracted much attention of pharmacy experts for their good biological activity and compatibility[4-8].
Vanadium-dependent haloperoxidases (VHPOs) are a class of peroxidases that utilize a vanadate cofactor to perform two electron oxidation of halides or organic sulfides[9-11]. The compounds were designed to mimick the active centre of these haloperoxidases which have also been reported to catalyze in vitro oxidations of substrates, emphasizing the importance of biologically oriented model investigations for industrially relevant processes. Although the synthesis of some oxovanadium complexes with various organic ligands has been reported[12-16], the detailed investigation on the VHPO mimicking activity as well as the mechanism of action of such complexes containing organic ligands are very scanty. Recent researches show that copper complexes have also similar VHPOs behavior. Recently, our group has reported some related research results[17-20], it is proved that transition metal complexes can be useful models in studying the biomimetic catalytic reaction mechanism[21]. Here, a series of new metal-medicine complexes: [Cu(htba)2(pz)2] (1), [Cu(htba)(2, 2′-bipy)](htba) (2) and [Cu(htba)2(4, 4′-bipy)] (3) (h2tba=2-hydroxy-4-trifluoromethylbenzoic acid, pz=pyrazole, 2, 2′-bipy=2, 2′-bipyridine, 4, 4′-bipy=4, 4′-bipyridine) were synthesized under hydro-thermal conditions. The spectral and structures of complexes 1~3 were characterized. Their cytotoxicity in hADSCs and Chang liver cells was evaluated using a multiple parallel perfused microbioreactor, and the mimicking catalytic bromination reaction dynamics was also tested for the study of whether the copper complexes is potential functional model compound of bromoperoxidase.
1 Experimental
1.1 Materials and methods
The reagents include CuCl2·2H2O (Beijing Chem-ical Works), Cu(NO3)2·3H2O (Aladdin), h2tba (Aladdin), pz (J & K Scientific), 2, 2′-bipy (Taizhou MaiBo Chem-ical Co., Ltd), 4, 4′-bipy (Taizhou MaiBo Chemical Co., Ltd). All of the above reagents are of analytical grade and used without further purification.
Elemental analyses for C, H, and N were carried out on a PE 240C automatic analyzer (Perkin-Elmer, Waltham, MA). The infrared spectra were recorded on a JASCO FT/IR-480 spectrometer (JASCO, Tokyo, Japan) with pressed KBr pellets in the range of 200~ 4 000 cm-1. UV-Vis spectra were recorded with a V-570-UV/VIS/NIR spectrophotometer (JASCO, Tokyo, Japan) (200~2 000 nm, in the form of the solid sample). The X-ray powder diffraction data were collected on a Bruker AXS D8 Advance diffractometer using Cu Kα radiation (λ=0.154 18 nm) in the 2θ range of 5°~60° (U=30 kV, I=30 mA). Thermogravimetric analyses (TG) were performed under N2 atmosphere with a heating rate of 10 ℃·min-1 on a Perkin Elmer Diamond TG/DTA.
1.2 Syntheses of the complexes
1.2.1 Synthesis of [Cu(htba)2(pz)2] (1)
CuCl2·2H2O (0.017 9 g, 0.1 mmol), h2tba (0.049 6 g, 0.2 mmol) and pz (0.014 g, 0.2 mmol) were mixed in the ethanol-water (1:2, V/V) solution (15 mL), and the mixture was stirred at room temperature for 1.5 h to get a blue solution. The final reaction mixture was sealed in a 30 mL flask and heated at 100 ℃ for 24 h. Finally, purple crystals suitable for X-ray diffraction analysis were obtained. Yield (based on Cu): 73%. Anal. Calcd. for C11H8N2O3F3Cu0.5(%): C, 43.33; H, 2.65; N, 9.19. Found(%): C, 43.32; H, 2.59; N, 9.16. IR (KBr, cm-1): 3 356(m), 3 153(w), 1 638(m), 1 591(s), 1 500(m), 1 472(w), 1 480(s), 1 335(s), 1 298(w), 1 225(s), 1 161(s), 1 060(s). UV-Vis (λmax / nm): 300, 552.
1.2.2 [Cu(htba)(2, 2′-bipy)](htba) (2)
The synthetic method of complex 2 was similar to that of complex 1. For complex 2, the starting material pyrazole was replaced by 2, 2′-bipy (0.031 5 g, 0.2 mmol). Yield (based on Cu): 78%. Anal. Calcd. for C26H16N2O6F6Cu(%): C, 49.57; H, 2.56; N, 4.45. Found(%): C, 49.65; H, 2.61; N, 4.41. IR (KBr, cm-1): 3 118(w), 3 073(w), 1 609(s), 1 492(w), 1 438(s), 1 392(w), 1 338(s), 1 230(m), 1 158(w), 1 122(s), 1 058(m). UV-Vis (λmax / nm): 304, 586.
1.2.3 [Cu(htba)2(4, 4′-bipy)] (3)
The synthetic method of complex 3 was also similar to that of complex 1. In the reaction, starting material Cu(NO3)2·3H2O (0.018 8 g, 0.1 mmol) and 4, 4′-bipy (0.031 4 g, 0.2 mmol) were chosen instead of CuCl2·2H2O and pyrazole. Yield (based on Cu): 78%. Anal. Calcd. for C13H8NO3F3Cu0.5(%): C, 49.57; H, 2.56; N, 4.45. Found(%): C, 49.51; H, 2.59; N, 4.49. IR (KBr, cm-1): 3 103(w), 1 603(s), 1 504(m), 1 433(s), 1 332(s), 1 233(s), 1 152(m), 1 116(s), 1 061(m). UV-Vis (λmax / nm): 302, 602.
1.3 X-ray crystallographic determination
Suitable single crystals of the three complexes were mounted on glass fibers for X-ray measurement. Reflection data were collected at room temperature with a Bruker AXS SMART APEX Ⅱ CCD diffracto-meter (Bruker AXS, Karlsruhe, Germany) with graphite-monochromated Mo Kα radiation (λ=0.071 07 nm) and an ω scan mode. All measured independent reflections (I>2σ(I)) were used in the structural analysis and semi -empirical absorption corrections were applied using the SADABS program[22]. The structures were solved by the direct method using SHELXL-97[23]. Crystal data and structure refinements are shown in Table 1. All non-hydrogen atoms were refined anisotropically and by temperature factor with the full-matrix least squares method. Hydrogen atoms of the organic frameworks were fixed at calculated positions with isotropic thermal parameters and refined using a riding model. The F atoms were found to be disordered, which were given occupancy parameters of 0.5 in order to retain acceptable displacement parameters.
 Table 1.
Crystallographic data for complexes 1~3
Table 1.
Crystallographic data for complexes 1~3
Complex 1 2 3 Empirical formula C22H16N4O6F6Cu C52H32N4O12F12Cu2 C26H16N2O6F6Cu Formula weight 609.93 1259.92 743.95 Crystal system Triclinic Triclinic Monoclinic Space group P1 P1 P21/c a / nm 0.492 1(3) 0.789 42(9) 0.555 08(3) b / nm 0.998 4(6) 1.205 08(15) 2.410 84(15) c / nm 1.218 7(7) 1.382 47(16) 0.944 29(6) α/(°) 102.499(7) 91.639(2) 90 β/(°) 90.536(8) 101.223(2) 92.127 0(10) γ/(°) 94.397(7) 106.161(2) 90 V / nm3 0.582 6(6) 1.234 2(3) 1.262 79(13) Z 1 1 2 Dc / (g·cm-3) 1.738 1.695 1.657 Absorption coefficient/mm-1 1.034 0.977 0.955 F(000) 307 634 634 Range of θ / (°) 2.10 to 25.35 1.77 to 28.45 2.32 to 28.33 Reflections collected 2 977 6 286 7 896 Independent reflections 2 071 4 328 3 015 Observed reflections [I>2σ(I)] 1 685 3 731 2 185 Parameters 206 385 217 Goodness of fit on F2 1.066 1.058 1.042 Final R* indices [I>2σ(I)] R1=0.046 5, wR2=0.102 9 R1=0.039 0, wR2=0.105 7 R1=0.041 9, wR2=0100 6 R indices (all data) R1=0.061 1, wR2=0.111 0 R1=0.047 4, wR2=0.109 6 R1=0.065 3, wR2=0.110 5 (Δρ)max, (Δρ)min/(e·nm-3) 1 075, -264 637, -378 612, -250 *R1=∑||Fo|-|Fc||/∑|Fo|, wR2={∑[w(Fo2-Fc2)2]/∑[w(Fo2)2]}1/2; Fo>4σ(Fo) CCDC: 1041787, 1; 1041788, 2; 1041789, 3.
1.4 Measurement of bromination activity in solution
The reactions were started with the existence of phenol red solution, copper complex, KBr and H2O2 with a buffer solution of NaH2PO4-Na2HPO4 (pH=5.8)[24]. The UV spectral changes were recorded using a UV-1000 spectrophotometer at 5 min intervals. By seque-ntial collecting the UV absorption spectrum data during the reaction and executed data treatment and fitting, the bromine reaction rate constant of copper complexes were obtained by the method in the literature[10, 20, 25-27].
2 Results and discussion
2.1 Synthesis
Three copper complexes have been successfully synthesized by copper salt (CuCl2·2H2O and Cu(NO3)2 ·3H2O), h2tba and nitrogen heterocyclic ligands (pz, 2, 2′-bipy and 4, 4′-bipy) in the system of ethanol-water with a hydrothermal reaction in 100 ℃. It is worth to mention that, for complex 3, we tried to use almost all kinds of copper salt, but only Cu(NO3)2·3H2O as the starting material could get the best crystal morphology of the complexes.
It is interesting to note that the starting material of h2tba was used in the synthesis process of the complexes. However, the ester groups in the ligand become hydroxy during the reaction. The possible disengaging reason is that the reaction condition could result in the hydrolysis of the ester.
2.2 IR spectra
The IR spectra of the complexes 1~3 are shown in Table 2 and Fig.S1. The weak peaks observed at 3 059~3 153 cm-1 are attributed to the stretching vibrations of the N-H in the pyrazolyl rings and the C-H stretching vibrations of the pyridine/pyrazolyl rings. The strong peaks at 1 591~1 637 cm-1 and around 1 330 cm-1 are attributed to the asymmetric and symmetric stretching vibration of the C=O group. Peaks in the range of 1 000~1 500 cm-1 are assigned to the stret-ching vibration characterization of the pyrazolyl, pyridine and phenyl rings.
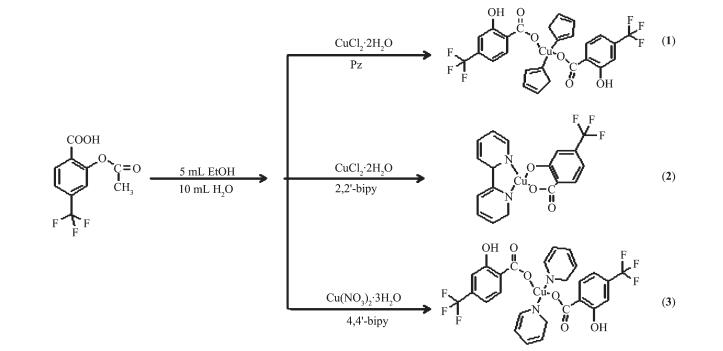 图Scheme1
Reaction process of the complexes 1~3
Scheme1.
Reaction process of the complexes 1~3
Table 2.
IR data for complexes 1~3
图Scheme1
Reaction process of the complexes 1~3
Scheme1.
Reaction process of the complexes 1~3
Table 2.
IR data for complexes 1~3
cm-1 Complex 1 2 3 v(=C-H) 3 153 3 118, 3 073 3 103 vas(COO-) 1 638. 1 591 1 609 1 603 vs(COO-) 1 335 1 338 1 332 pyridine 1 500, 1 472, 1 480, 1 298 1 492, 1 438, 1 392, 1 230 1 504, 1 433, 1 233, 1 152 pyrazolyl 1 225, 1 161, 1 060 1 158, 1 122, 1 058 1 116, 1 061 2.3 UV-Vis spectra
The UV-Vis absorption spectra of complexes 1~3 are recorded in form of the solid sample (Table 3 and Fig.S2). They have similar absorption patterns. In the high-frequency region, the absorption peaks at 210~212 nm and 300~304 nm are attributed to the π-π* transition of the pyrazoly ring and the htba ligand. In the visible range, the broad peak at 552 nm for 1, 586 nm for 2 and 602 nm for 3 can be caused by the charge transitions from the ligands to Cu(Ⅱ) ion (LMCT).
Table 3.
UV-Vis data for complexes 1~3
nm Complex π-π* transition d-d* transition 1 300 552 2 304 586 3 302 602 2.4 Crystal structure
The molecular structures of the complexes 1~3 are depicted in Fig. 1~3, and some selected bond distances and angles are summarized in Table S1. The hydrogen bonds parameters of complexes 1~3 are listed in Table S2.
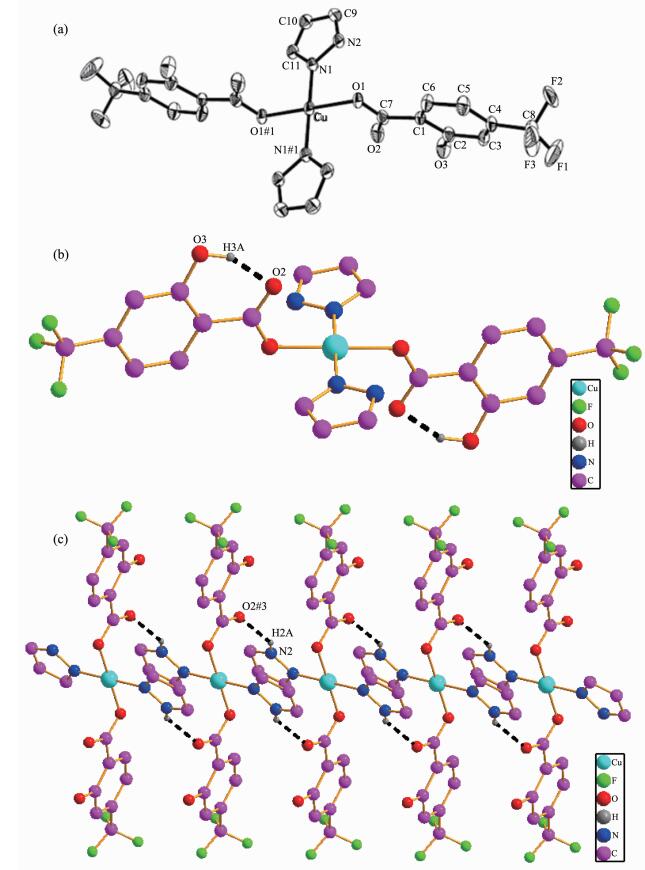 图1
(a) Molecular structure of the complex 1 with probability level of 30%; (b) One dimensional chain structure; (c) Two dimensional planar structure
Figure1.
(a) Molecular structure of the complex 1 with probability level of 30%; (b) One dimensional chain structure; (c) Two dimensional planar structure
图1
(a) Molecular structure of the complex 1 with probability level of 30%; (b) One dimensional chain structure; (c) Two dimensional planar structure
Figure1.
(a) Molecular structure of the complex 1 with probability level of 30%; (b) One dimensional chain structure; (c) Two dimensional planar structure
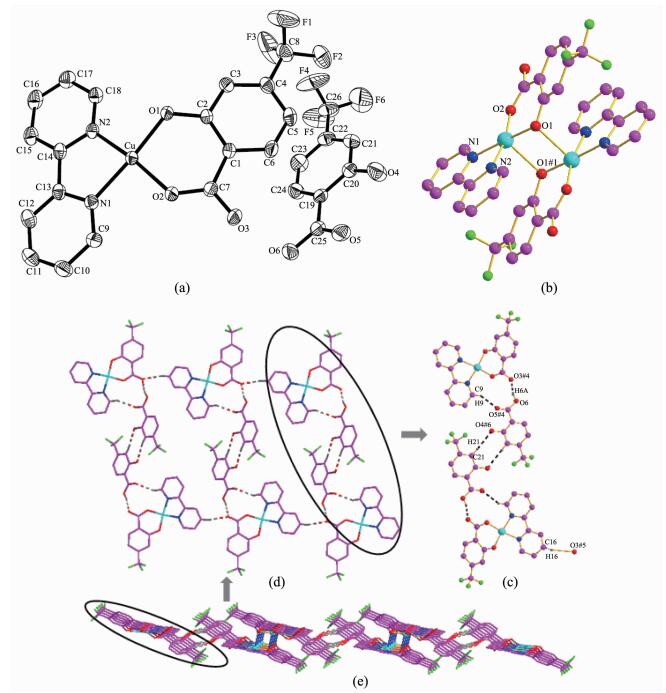 图2
(a) Molecular structure of complex 2 with probability level of 30%; (b) Dimer structure; (c) One dimensional chain structure; (d) Two dimensional planar structure; (e) Three dimensional network structure
Figure2.
(a) Molecular structure of complex 2 with probability level of 30%; (b) Dimer structure; (c) One dimensional chain structure; (d) Two dimensional planar structure; (e) Three dimensional network structure
图2
(a) Molecular structure of complex 2 with probability level of 30%; (b) Dimer structure; (c) One dimensional chain structure; (d) Two dimensional planar structure; (e) Three dimensional network structure
Figure2.
(a) Molecular structure of complex 2 with probability level of 30%; (b) Dimer structure; (c) One dimensional chain structure; (d) Two dimensional planar structure; (e) Three dimensional network structure
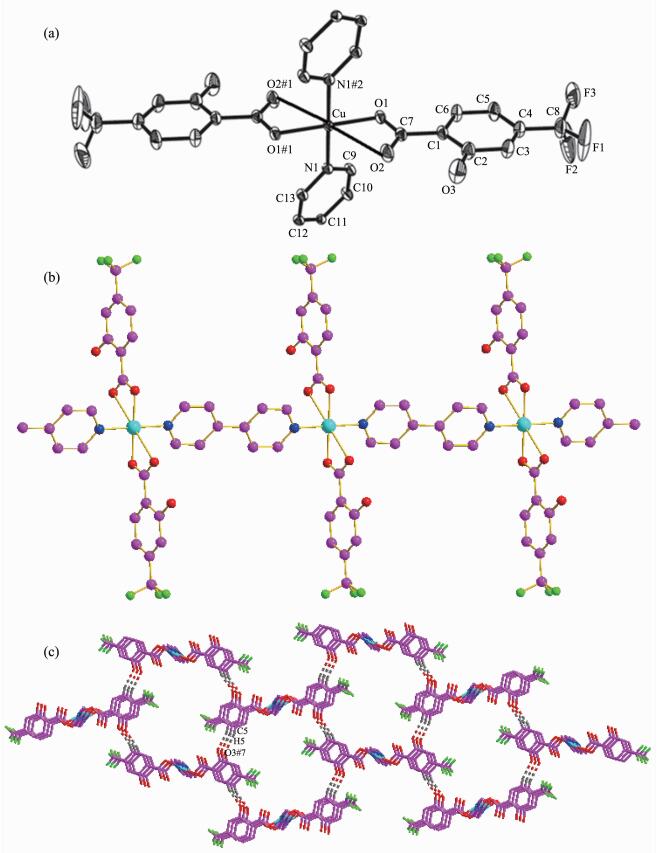 图3
(a) Molecular structure of the complex 3 with probability level of 30%; (b) View of 1D chain linked by 4, 4′-bipy in 3; (c) View of 3D structure formed by hydrogen bonding interaction in 3
Figure3.
(a) Molecular structure of the complex 3 with probability level of 30%; (b) View of 1D chain linked by 4, 4′-bipy in 3; (c) View of 3D structure formed by hydrogen bonding interaction in 3
图3
(a) Molecular structure of the complex 3 with probability level of 30%; (b) View of 1D chain linked by 4, 4′-bipy in 3; (c) View of 3D structure formed by hydrogen bonding interaction in 3
Figure3.
(a) Molecular structure of the complex 3 with probability level of 30%; (b) View of 1D chain linked by 4, 4′-bipy in 3; (c) View of 3D structure formed by hydrogen bonding interaction in 3
Single-crystal X-ray structure analyses reveals that complex 1 crystallizes in the Triclinic system with P1 space group. The molecular structure of 1 contains one copper ion, two htba ligands and two pz moieties. As shown in Fig. 1a, Cu(Ⅱ) ion in complex 1 is coordinated with two oxygen(O1 and O1#1, Symmetry codes: #1: -x+1, -y, -z+1) from two htba ligands and two nitrogen atoms from two pz moieties, respectively, forming a CuN2O2 plane square geometry. There is no deviation of the plane atoms. The bond lengths of Cu-N1 and Cu-O1 are 0.196 3(3) and 0.193 7(2) nm, respectively. The angles of O1-Cu-N1 and O1-Cu-N#1 are 89.93(11)° and 90.07(12)°, respectively.
In addition, there are two kinds of hydrogen bonds in the molecular structure: (ⅰ) intramolecular hydrogen bond (O3…O2, 0.258 36 nm, 153.95°) between the oxygen atoms from oxhydryl and carboxy-late group; (ⅱ) hydrogen bond (N2…O2#3, 0.282 35 nm, 139.20°, Symmetry codes: #3: -1+x, y, z) between oxygen from carboxylae group and nitrogen from pyrazolyl. The molecules of the complex 1 are conne-cted to an infinite 1D chain structure by the hydrogen bonds of O3-H3A…O2 (Fig. 1b), and connected to a 2D planar structure by N2-H2A…O2#3 (Fig. 1c).
Single-crystal X-ray structure analyses reveals that complex 2 crystallizes in the Triclinic system with P1 space group. The crystal structure comprises a monomeric Cu(htba)(2, 2′-bipy) neutral molecule and one free htba molecule. The coordination environment of the central Cu(Ⅱ) ion in complex 2 is shown in Fig. 2a. The Cu(Ⅱ) ion is five-coordinated by three oxygen atoms (O1, O2 and O1#1, Symmetry codes: #1: -x+1, -y, -z+1) from htba ligands with Cu-O bond distances in the range of 0.189 76(17)~0.242 45(19) nm and two nitrogen atoms (N1 and N2) from 2, 2′-bipy with Cu-N bond distances in the range of 0.198 9(2)~ 0.200 3(2) nm to form a CuN2O3 tetragonal structure. The deviations of Cu, O1, O2, N1 and N2 atoms that composed of the least-squares plane are 0.007 60, 0.005 49, -0.009 63, 0.006 35 and -0.009 81 nm, respectively, showing that these atoms are almost on one plane. The angles of O1-Cu-O2 and N1-Cu-N2 are 89.93(11)° and 81.18(9)°, respectively, and the angles of O-Cu-N are in the range of 92.29(8)°~174.29(8)°.
There are two kinds of hydrogen bonds, O-H…O (O…O 0.250 75 nm) and C-H…O (C…O 0.321 66~0.340 08 nm), in complex 2. Hereinto, the O-H…O hydrogen bonds come from the coordinated htba ligand and the free htba ligand: O6-H6A…O3#4 (O6…O3#4 0.250 75 nm, O6-H6A…O3#4 163.40°, Symmetry codes: #4: 2-x, 1-y, 1-z); the C-H…O hydrogen bonds are from the carbon atoms from 2, 2′-bipy, oxygen atoms from the coordinated htba and free htba: C9-H9…O5#4 (0.321 66 nm, 147.41°); C21-H21…O4#6 (0.340 08 nm, 165.77°); C16-H16…O3#5 (0.336 78 nm, 166.68°, Symmetry codes: #6: 1-x, 1-y, -z; #5: x, -1+y, z). Two independent molecules form a dimer by bridging coordination oxygen (O1) (Fig. 2b). The dimer is further linked through the C9-H9…O5#3 hydrogen bond to generate a 1D chain structure, as illustrated in Fig. 2c and then the adjacent chains are connected through the weak interaction between the cooper atom and oxygen atom to form a 2D structure (Fig. 2d). Eventually the 2D structure of 2 is connected into a 3D network structure (Fig. 2e).
Structural analysis shows that complex 3 crystall-izes in the Monoclinic system with P21/c space group. The molecular structure of 3 contains one copper ion, two htba ligands and one 4, 4′-bipy ligand. The coordination environment of the central Cu(Ⅱ) atom in complex 3 is shown in Fig. 3a. The Cu(Ⅱ) atom is six-coordinated by four oxygen atoms (O1, O2, O1#1 and O2#1, Symmetry codes: #1: -x+2, -y, -z+1) from htba ligands and two nitrogen atoms from 4, 4′-bipy moiety, respectively, forming a CuN2O4 octahedral structure. There is no deviation of the plane atoms. The bond lengths of Cu-N and Cu-O1 are 0.202 6(3) and 0.195 5(2) nm, respectively. The angles of O1-Cu-N and O1-Cu-N#2 (Symmetry codes: #2: 2-x, -0.5+y, 2.5-z) are 89.49(11)° and 90.52(11)°, and the angles of O(1)-Cu-O(1)#2 and N(1)#2-Cu-N(1) are 180.00(7)° and 180.0°, respectively. The molecules are linked to an infinite 1D chain (Fig. 3b) by 4, 4′-bipy. The chains are further linked through the hydrogen bonds C5-H5…O3#7 (Symmetry codes: #7: -1+x, 0.5-y, -0.5+z) to generate a 3D hydrogen bond network (Fig. 3c).
2.5 Thermal properties and XRD analysis
To examine the thermal stability of the complexes 1~3, TG was carried out with the temperature range of 30~1 000 ℃ (Fig. 4). For complex 1, the result shows the initial weight loss of 44.88% before 298 ℃ is due to the release of two pz and two -CF3 moieties (Calcd. 44.94%). The second weight loss occurs in the range of 298~1 000 ℃, which is ascribed to the release of the remaining part of h2tba (Obsd. 44.87%; Calcd. 44.64%), and the final residue corresponds to copper oxide (Obsd. 10.25%; Calcd. 13.03%). The TG curve of 2 can be divided into three stages. The first weight loss of 44.44% in the range of 30~291 ℃ is attributed to the free htba and two -CF3 moieties (Calcd. 43.67%). The second weight loss occurs in the range of 291~369 ℃ with a weight loss of 20.96%, which is ascribed to the release of the remaining part of h2tba (Calcd. 21.45%). The last step of decomposition occurred within the range of 369~1 000 ℃, which is attributed the loss of 2, 2′-bipy (Obsd. 24.76%; Calcd. 24.79%), and the final residue corresponds to copper oxide (Obsd. 9.84%; Calcd. 12.61%). The first weight loss in the complex 3 occurs in the range of 30~298 ℃, implying the removal of two -CF3 moieties and two 4, 4′-bipy (Obsd. 45.82%; Calcd. 46.69%). The second weight loss of 43.69% occurs in the temperature range of 298~495 ℃, which is ascribed to the release of the remaining part of h2tba ligand (43.22%). And finally, the residue might be copper oxide (Obsd. 10.49%; Calcd. 12.61%).
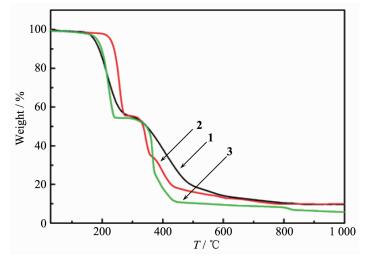 图4
TG curves for the complexes 1~3
Figure4.
TG curves for the complexes 1~3
图4
TG curves for the complexes 1~3
Figure4.
TG curves for the complexes 1~3
The powder X-ray diffraction data of the complexes 1~3 were obtained and compared with the corresponding simulated single-crystal diffraction data (Fig.S3~S5). The phase of the complexes is considered as purities owning to the agreement of the peak positions. The different intensity may be due to the preferred orientation of the powder samples.
2.6 Functional mimics of complexes 1~3
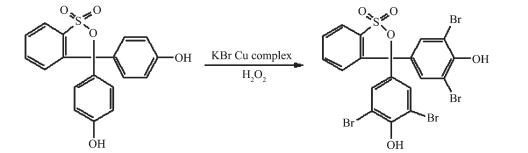
As we know, oxidovanadium complexes can mimic a reaction in which vanadium haloperoxidases could catalyze the bromination of organic substrates in the presence of bromide and H2O2[28-29]. However, it is found that copper complexes showed obviously catalytic bromination activities in the experiment system, and the catalytic activity of copper complexes were close to the vanadium complexes[9-12]. Herein, the bromination reaction activities of complexes 1~3 are shown by the conversion of phenol red as an organic substrate to bromophenol blue. The reaction is efficient and rapid, producing the halogenated product by the reaction of oxidized halogen species with the organic substrate, and the reactive process is shown in Scheme 2.
 图Scheme2
Reactive process of bromination reaction catalysed by the complexes
Scheme2.
Reactive process of bromination reaction catalysed by the complexes
图Scheme2
Reactive process of bromination reaction catalysed by the complexes
Scheme2.
Reactive process of bromination reaction catalysed by the complexes
The solution color visibly changed from yellow to blue when complex 1 was added to the standard reaction of bromide in a phosphate buffer with phenol red as a trap for oxidized bromine. The UV absorption spectra recorded a decrease in absorbance of the peak at 443 nm due to the loss of phenol red and an increase of the peak at 592 nm with production of the bromophenol blue, investigating that complex 1 possess better catalytic activity. The results of the mimic catalytic activity for 2 and 3 is similar to that for 1. In order to evaluate the catalytic reaction of phenol red based on vanadium complex 1 as a catalyst exactly, we have designed and carried out an experiment system: the DMF-water solution of the complexes was added to the reaction system involving phosphate buffer, KBr, H2O2 and phenol red which acted as a substrate to be brominated, resulting in visible color change of the solution from yellow to blue. Spectral intensity change was recorded at 10 min intervals (Fig. 5). The conversion rate of the phenol red (α) can be expressed as follow:
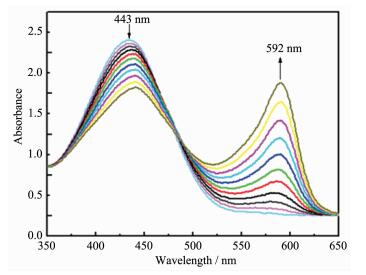 图5
Mimic catalytic activity of complex 1
Figure5.
Mimic catalytic activity of complex 1
图5
Mimic catalytic activity of complex 1
Figure5.
Mimic catalytic activity of complex 1
where ct=equilibrium concentration, c0=initial concen-tration. Because of the relationship of c∝A, we could convert the conversion of phenol red based on Eq.1 into (1-At /A0)×100% (At=equilibrium absorbance, A0=initial absorbance). So, α=(1-At /A0)×100%=(1-1.734 6 /2.366 2)×100%=26.7%.
Take complex 1 as an instance to execute kinetic studies of mimicking bromination reaction. A series of dA/dt data were acquired by changing the concentration of the complex shown in Fig. 6. According to Lambert-Beer′s law, A=εbc, dA/dt=εb(dc/dt), where A is the measurable absorbance of the resultant; ε is molar absorption coefficient, which is measured as 14 500 L ·mol-1·cm-1 at 592 nm for bromophenol blue; and b is the light path length of sample cell (b=1 cm). Then, the catalytic reaction kinetic equation: dc/dt=kc1xc2yc3z, was treated into lg(dc/dt)=lgk+xlgc1+ylgc2+zlgc3. In the equation, the reaction rate constant, k, is determined by the concentrations of complex 1, KBr and phenol red (c1, c2 and c3, respectively), the reaction orders of complex 1, KBr and phenol red (x, y and z), as well as lg(dc/dt). While in the experiment, in view of the reaction orders of KBr and phenol red (y and z) being 1 according to the literature[30-31]; c2 and c3 are known to be 0.4 and 1×10⁻⁴ mol·L-1, respectively, then the plot of -lg(dc/dt) vs -lgc1 for complex 1 was depicted with the data in Fig. 5, obtaining a straight line (Fig. 7) with a slope of 1.07 and intercept of -0.917 4. The former confirms the first-order reaction being dependent on copper ion. According to the intercept, the reaction rate constant (k) for complex 1 was calculated as 3.023 ×10³ L2·mol-2·s-1. Similar plots for 2 and 3 were generated in the same way (Fig.S6~S9), and values of the slope and the intercept are 1.060 3 and -1.272 1 for 2, 1.036 9 and -1.063 8 for 3, and the reaction rate constants (k) for complexes 2 and 3 can be calculated as 1.336×10³ and 2.158×10³ L2·mol-2·s-1, respectively. Through the experimental results, we gave conclusion that (ⅰ) the reaction orders for phenol red in the bromination reactions catalyzed by copper-complexes are all close to 1; (ⅱ) the reaction rate constants of the three complexes are similar.
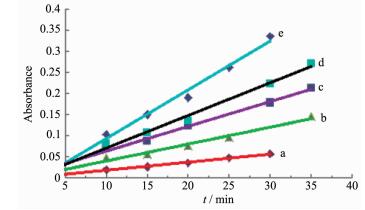 图6
Linear calibration plots of the absorbance (at 592 nm) vs time for bromination reaction of phenol red with different concentrations of complex 1
Figure6.
Linear calibration plots of the absorbance (at 592 nm) vs time for bromination reaction of phenol red with different concentrations of complex 1
图6
Linear calibration plots of the absorbance (at 592 nm) vs time for bromination reaction of phenol red with different concentrations of complex 1
Figure6.
Linear calibration plots of the absorbance (at 592 nm) vs time for bromination reaction of phenol red with different concentrations of complex 1
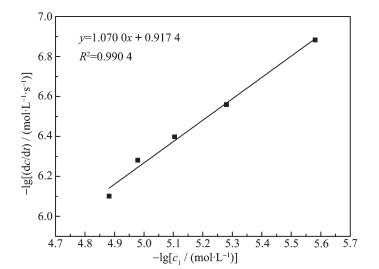 图7
-lg(dc/dt) dependence of -lgc1 for complex 1 in DMF-H2O at (30±0.5) ℃
Figure7.
-lg(dc/dt) dependence of -lgc1 for complex 1 in DMF-H2O at (30±0.5) ℃
图7
-lg(dc/dt) dependence of -lgc1 for complex 1 in DMF-H2O at (30±0.5) ℃
Figure7.
-lg(dc/dt) dependence of -lgc1 for complex 1 in DMF-H2O at (30±0.5) ℃
3 Conclusions
In this work, by selecting appropriate ligands, three new copper complexes have been successfully synthesized for the first time. In order to further explore the efficacious copper model complexes with the active center which is similar to the structure of VHPOs, we tested the bromination reaction activity with phenol red as an organic substrate in the presence of the complex, H2O2, KBr and a phosphate buffer solution. The results show that three cooper complexes all could catalyzed phenol red bromination rapidly and efficiently, exhibiting good catalytic activity, which may be applied as potential functional catalytic model in future.
Supporting information is available at http://www.wjhxxb.cn
-
-
[1]
Wang X, Xing Y H, Bai F Y, et al. RSC Adv., 2013, 3(36):16021-16033 doi: 10.1039/c3ra41459k
-
[2]
Govindaswamy P, Carroll P J, Mozharivskyj Y A, et al. J. Organomet. Chem., 2005, 690(4):885-894 doi: 10.1016/j.jorganchem.2004.10.039
-
[3]
Gupta G, Prasad K T, Das B, et al. J. Organomet. Chem., 2009, 694(16):2618-2627 doi: 10.1016/j.jorganchem.2009.03.043
-
[4]
万丽娟, 邢娜, 万丽英, 等.应用化学, 2012, 29(11):1266-1271 http://kns.cnki.net/KCMS/detail/detail.aspx?filename=yyhx201211010&dbname=CJFD&dbcode=CJFQWAN Li-Juan, XING Na, WAN Li-Ying, et al. Chin. J. Appl. Chem., 2012, 29(11):1266-1271 http://kns.cnki.net/KCMS/detail/detail.aspx?filename=yyhx201211010&dbname=CJFD&dbcode=CJFQ
-
[5]
王欣羽, 邢娜, 宋鸽, 等.高等学校化学学报, 2012, 33(6):1143-1150 doi: 10.3969/j.issn.0251-0790.2012.06.005WANG Xin-Yu, XING Na, SONG Ge, et al. Chem. J. Chinese Universities, 2012, 33(6):1143-1150 doi: 10.3969/j.issn.0251-0790.2012.06.005
-
[6]
Reger D L, Pascui A E, Smith M D. Eur. J. Inorg. Chem., 2012(29):4593-4604 http://med.wanfangdata.com.cn/Paper/Detail/PeriodicalPaper_PM23043562
-
[7]
Wang S, Zang H Y, Sun C Y, et al. CrystEngComm, 2010, 12(11):3458-3462 doi: 10.1039/c0ce00137f
-
[8]
Manzur J, Acuňa C, Vega A, et al. Inorg. Chim. Acta, 2011, 374(1):637-642 doi: 10.1016/j.ica.2011.03.031
-
[9]
Feng X D, Zhang X X, Wang Z N, et al. New J. Chem., 2016, 40(2):1222-1229 doi: 10.1039/C5NJ01905B
-
[10]
Zhang R, Zhang X X, Bai F Y, et al. J. Coord. Chem., 2014, 67(9):1613-1628 doi: 10.1080/00958972.2014.926007
-
[11]
Cao Y Z, Zhao H Y, Bai F Y, et al. Inorg. Chim. Acta, 2011, 368(1):223-230 doi: 10.1016/j.ica.2011.01.031
-
[12]
Rehder D, Santoni G, Licini G M, et al. Coord. Chem. Rev., 2003, 237(1/2):53-63
-
[13]
Kraehmer V, Rehder D. Dalton Trans., 2012, 41(17):5225-5234 doi: 10.1039/c2dt12287a
-
[14]
Si T K, Paul S S, Drew M G B, et al. Dalton Trans., 2012, 41(19):5805-5815 doi: 10.1039/c2dt12505f
-
[15]
Soedjak H S, Butler A. Inorg. Chem., 1990, 29(25):5015-5017 doi: 10.1021/ic00350a003
-
[16]
Patra S, Chatterjee S, Si T K, et al. Dalton Trans., 2013, 42(37):13425-13435 doi: 10.1039/c3dt51291f
-
[17]
Feng X D, Zhang X X, Wang X Y. Polyhedron, 2015, 90(18):69-76
-
[18]
Wang J X, Wang C, Wang X, et al. Spectrochim. Acta Part A, 2015, 142(5):55-61
-
[19]
Ren D X, Xing N, Shan H, et al. Dalton Trans., 2013, 42(15):5379-5389 doi: 10.1039/c3dt32472a
-
[20]
Zhang R, Liu J, Chen C, et al. Spectrochim. Acta Part A, 2013, 115:476-482 doi: 10.1016/j.saa.2013.06.081
-
[21]
Sharma R K, Sharma C. Tetrahedron Lett., 2010, 51(33):4415-4418 doi: 10.1016/j.tetlet.2010.06.067
-
[22]
Sheldrick G M. SADABS, Program for Empirical Absorption Correction of Area Detector Data, University of Göttingen, Germany, 1996.
-
[23]
Sheldrick G M. SHELXS-97, Program for Crystal Structure Refinement, University of Göttingen, Germany, 1997.
-
[24]
Verhaeghe E, Buisson D, Zekri E, et al. Anal. Biochem., 2008, 379(1):60-65 doi: 10.1016/j.ab.2008.04.041
-
[25]
Rehder D. Coord. Chem. Rev., 1999, 182(1):297-322 doi: 10.1016/S0010-8545(98)00194-5
-
[26]
Chen C, Bai F Y, Zhang R, et al. J. Coord. Chem., 2013, 66(4):671-688 doi: 10.1080/00958972.2013.765561
-
[27]
Schneider C J, Penner J E, Hahn J E, et al. J. Am. Chem. Soc., 2008, 130(9):2712-2713 doi: 10.1021/ja077404c
-
[28]
Maurya M R, Kumar A, Ebel M, et al. Inorg. Chem., 2006, 45(15):5924-5937 doi: 10.1021/ic0604922
-
[29]
Clague M J, Butler A. J. Am. Chem. Soc., 1995, 117(12):3475-3484 doi: 10.1021/ja00117a016
-
[30]
Colpas G J, Hamstra B J, Kampf J W, et al. J. Am. Chem. Soc., 1996, 118(14):3469-3478 doi: 10.1021/ja953791r
-
[31]
Zampella G, Kravitz J Y, Webster C E, et al. Inorg. Chem., 2004, 43(14):4127-4136 doi: 10.1021/ic0353256
-
[1]
-

Figure 1 (a) Molecular structure of the complex 1 with probability level of 30%; (b) One dimensional chain structure; (c) Two dimensional planar structure
All H atoms expect for the hydrogen bonds are omitted for clarity; Symmetry codes: #1:-x+1, -y, -z+1; #3: -1+x, y, z

Figure 2 (a) Molecular structure of complex 2 with probability level of 30%; (b) Dimer structure; (c) One dimensional chain structure; (d) Two dimensional planar structure; (e) Three dimensional network structure
All H atoms expect for the hydrogen bonds are omitted for clarity; Symmetry codes: #1:-x+1, -y, -z+1; #4: 2-x, 1-y, 1-z; #5: x, -1+y, z; #6: 1-x, 1-y, -z

Figure 3 (a) Molecular structure of the complex 3 with probability level of 30%; (b) View of 1D chain linked by 4, 4′-bipy in 3; (c) View of 3D structure formed by hydrogen bonding interaction in 3
All H atoms expect for the hydrogen bonds are omitted for clarity; Symmetry codes: #1:-x+2, -y, -z+1; #2: 2-x, -0.5+y, 2.5-z; #7: -1+x, 0.5-y, -0.5+z

Figure 6 Linear calibration plots of the absorbance (at 592 nm) vs time for bromination reaction of phenol red with different concentrations of complex 1
Condition: pH=5.8, cKBr=c2=0.4 mol·L-1, cH2O2=1 mol·L-1, cphenol red=c3=1×10⁻⁴ mol·L-1; From (a) to (e): ccomplex=c1=2.62×10⁻⁶, 5.24×10⁻⁶, 7.86×10⁻⁶, 1.05×10⁻⁵, 1.31×10⁻⁵ mol·L-1, respectively
Table 1. Crystallographic data for complexes 1~3
Complex 1 2 3 Empirical formula C22H16N4O6F6Cu C52H32N4O12F12Cu2 C26H16N2O6F6Cu Formula weight 609.93 1259.92 743.95 Crystal system Triclinic Triclinic Monoclinic Space group P1 P1 P21/c a / nm 0.492 1(3) 0.789 42(9) 0.555 08(3) b / nm 0.998 4(6) 1.205 08(15) 2.410 84(15) c / nm 1.218 7(7) 1.382 47(16) 0.944 29(6) α/(°) 102.499(7) 91.639(2) 90 β/(°) 90.536(8) 101.223(2) 92.127 0(10) γ/(°) 94.397(7) 106.161(2) 90 V / nm3 0.582 6(6) 1.234 2(3) 1.262 79(13) Z 1 1 2 Dc / (g·cm-3) 1.738 1.695 1.657 Absorption coefficient/mm-1 1.034 0.977 0.955 F(000) 307 634 634 Range of θ / (°) 2.10 to 25.35 1.77 to 28.45 2.32 to 28.33 Reflections collected 2 977 6 286 7 896 Independent reflections 2 071 4 328 3 015 Observed reflections [I>2σ(I)] 1 685 3 731 2 185 Parameters 206 385 217 Goodness of fit on F2 1.066 1.058 1.042 Final R* indices [I>2σ(I)] R1=0.046 5, wR2=0.102 9 R1=0.039 0, wR2=0.105 7 R1=0.041 9, wR2=0100 6 R indices (all data) R1=0.061 1, wR2=0.111 0 R1=0.047 4, wR2=0.109 6 R1=0.065 3, wR2=0.110 5 (Δρ)max, (Δρ)min/(e·nm-3) 1 075, -264 637, -378 612, -250 *R1=∑||Fo|-|Fc||/∑|Fo|, wR2={∑[w(Fo2-Fc2)2]/∑[w(Fo2)2]}1/2; Fo>4σ(Fo)  下载: 导出CSV
Table 2. IR data for complexes 1~3
cm-1 Complex 1 2 3 v(=C-H) 3 153 3 118, 3 073 3 103 vas(COO-) 1 638. 1 591 1 609 1 603 vs(COO-) 1 335 1 338 1 332 pyridine 1 500, 1 472, 1 480, 1 298 1 492, 1 438, 1 392, 1 230 1 504, 1 433, 1 233, 1 152 pyrazolyl 1 225, 1 161, 1 060 1 158, 1 122, 1 058 1 116, 1 061
下载: 导出CSV
Table 3. UV-Vis data for complexes 1~3
nm Complex π-π* transition d-d* transition 1 300 552 2 304 586 3 302 602
下载: 导出CSV
-


 扫一扫看文章
计量
- PDF下载量: 2
- 文章访问数: 1269
- HTML全文浏览量: 164
 下载:
下载:
