Citation:
BAI Ming-Cheng, PAN Ming-Yan, WANG Lin, QI Hong-Ji, WANG Hu. Synthesis, Structure, and Properties of Zintl Phase Compound α-BaZn2P2[J]. Chinese Journal of Inorganic Chemistry,
2018, 34(2): 277-282.
doi:
10.11862/CJIC.2018.056

Zintl相化合物α-BaZn2P2的合成、结构和性能
摘要:
通过Sn助熔剂法在高温下合成一种Zintl相化合物α-BaZn2P2,通过X射线单晶衍射确定其晶体结构与α-BaCu2S2同构,属于Pnma空间群。α-BaZn2P2的晶格参数为:a=0.976 78(5)nm,b=0.413 34(2)nm,c=1.060 55(5)nm。与高温相β-BaZn2P2的层状结构不同,低温相α-BaZn2P2具有三维网格结构。其中ZnP4四面体通过共边和共顶2种方式连接形成阴离子框架,Ba2+作为阳离子填隙其中。基于密度泛函理论计算了该化合物的能带结构和态密度,结果表明该化合物是窄带隙半导体(Eg=0.4 eV)。另外,DSC和变温XRD结果表明高温下α-BaZn2P2分解为Ba4P5,ZnP4等二元相。
English
Synthesis, Structure, and Properties of Zintl Phase Compound α-BaZn2P2
Abstract:
A Zintl phase compound α-BaZn2P2, was synthesized through the high-temperature Sn-flux reaction. Single-crystal X-ray diffraction was used to accurately determine its structure, which is similar to α-BaCu2S2-type structure (Pnma). The cell parameters of α-BaZn2P2 are a=0.976 78(5) nm, b=0.413 34(2) nm, c=1.060 55(5) nm. Unlike high-temperature-phase β-BaZn2P2, which has a layer structure, low-temperature-phase α-BaZn2P2 has a three-dimensional network structure, where ZnP4 tetrahedra form an anion frame by sharing sides or vertices, with Ba2+ cations residing within. The band structure and state density of the compound were calculated using density functional theory. The results indicate that the compound is a narrow-bandgap semiconductor (Eg=0.4 eV). In addition, differential scanning calorimetry and temperature-dependent XRD results show that α-BaZn2P2 decomposes into binary phases like Ba4P5 and ZnP4 at high temperatures.
-
Key words:
- Zintl phase compound
- / phosphorus compounds
- / crystal structure
- / electronic structure
-
0 Introduction
Zintl phase compounds are special polar intermetallics comprising metals with very different electronegativities, and the electropositive elements can usually be assumed to completely transfer their valence electrons to the electronegative ones; thus, each constituent atom obeys the 8-N octet rule and a closed-shell configuration is achieved. Such an electron-precise nature has been observed frequently in Zintl phases, and plays a critical role in governing the formation of the structures of these compounds[1-4]. Because of their complex crystal structures, Zintl phase compounds exhibit specific physical and chemical properties. For example, Yb14MnSb11[5-6], which has a high molecular mass of 3 783.088 and very low thermal conductivity, has a figure of merit (zT) of 1.0 at 1 200 K. BaFe2As2, another Zintl compound, with a tetragonal ThCr2Si2-type structure and space group I4/mmm, has been reported to show great superconductivity. It exhibits a structural and magnetic phase transition at 140 K, at which a spin-density-wave anomaly has been observed, and the superconducting transition temperature can be increased to 38 K by doping with K((Ba1-xKx)Fe2As2, x=0.4)[7-9]. Many other Zintl phase compounds exhibit excellent thermoelectric perfor-mances, magnetic properties, and superconductivities.
The formula RM2X2 (R=rare or alkaline earth metal, M=metal, and X=group ⅢA~ⅥA element) represents a very large family of compounds with more than five crystal types (I4/mmm, P3m1, Pnma, and Cmcm)[10]. RM2X2 compounds crystallize mainly into the structure of ThCr2Si2[7], with the tetragonal space group I4/mmm, and contain practically identical layers of edge-sharing MX4 tetrahedra separated by R atom layers. The second-most common crystal structure of RM2X2 compounds is the CaAl2Si2-type structure[11], with the space group P3m1. The trigonal structure for these RM2X2 compounds can be viewed as polyanionic M2X2 layers stacked along the c-axis and separated by layers of R cations[12]. The least common crystal struc-ture among RM2X2 compounds is the α-BaCu2S2-type structure[13-14], with an orthogonal phase featuring the Pnma space group, in which MX4 tetrahedra form a three-dimensional (3D) network frame with large cavities where R cations are located.
The different structure types are closely connected, and phase transitions may occur between them. For example, BaAl2Ge2[15] and BaCu2S2 undergo a reversible phase change process, where the α (low-temperature phase; space group Pnma) phase changes to the β (high-temperature phase; space group I4/mmm) phase when the temperature rises, and the reverse occurs when the temperature is lowered. For BaZn2P2, the high-temperature phase (group I4/mmm) was reported in 1978[16], but the low-temperature phase has not been reported yet. In this study, α-BaZn2P2 was obtained via the high-temperature Sn-flux reaction. The synthesis, crystal structure, and electronic band structure of α-BaZn2P2 are presented and discussed in this paper, and the results of differential scanning calorimetry (DSC) and temperature-dependent X-ray diffraction (XRD) show that thermal decomposition occurs during the heating process.
1 Experimental
1.1 Synthesis
All manipulations were performed either in an argon-filled glovebox or under vacuum. The starting materials P (99.999%), Zn (99.99%), Ba (99+%), and Sn (99.9%) were obtained from Alfa and used as received. The elements, Ba, Zn, P, and Sn, were arranged in an alumina crucible in a molar ratio of 2: 1: 3: 20. The reactions were sealed in quartz ampoules under vacuum, and the ampoules were placed in a high-temperature programmable furnace. The reactions were heated to 300 ℃ over 5 h, and held at that temperature for an additional 5 h. Afterwards, the sealed mixtures were heated to 950 ℃ and held at that temperature for 20 h, and then slowly cooled to 400 ℃ at a rate of -5 ℃·h-1. Then, they were centrifuged at 2 500 r·min-1 for 5 min to separate the products from the Sn flux. The main products were silver block crystals of Ba3Sn2P4 and needle crystals of α-BaZn2P2. The α-BaZn2P2 crystals were stable in air, water, and alcohol, and reacted slowly with dilute acid.
1.2 X-ray powder diffraction
Powder XRD patterns were obtained at room temperature using an Ultima Ⅳ X-ray powder diffractometer using Cu Kα radiation (λ=0.154 18 nm). The operating voltage and current were 40 kV and 40 mA, respectively. The data were recorded in 2θ mode with a step size of 0.02° and a counting time of 10 s, and the scanning range was from 20° to 80°. The results were used for the phase purity analysis only.
Temperature-dependent XRD was conducted using an Empyrean with a temperature platform in order to analyze the changes in α-BaZn2P2 during the heating process from 30 to 920 ℃. A powdered sample was placed on the platform and heated at 10 ℃·min-1 from room temperature. Measurements were taken at 30, 200, 400, 600, 800, 850, 870, 900 and 920 ℃ and the results were compared with DSC.
1.3 Single-crystal X-ray diffraction
Single crystal of the title compound were selected and cut in Patatone-N oil to suitable size (0.3 mm×0.06 mm×0.06 mm) and then mounted on glass fiber for data collection, which was performed on a Bruker SMART APEX-Ⅱ CCD area detector with graphite-monochromated Mo Kα radiation (λ=0.071 073 nm) at 296 K using ω scan. Data reduction and integration, along with global unit cell refinements, were performed by the INTEGRATE program incorporated in the APEX2 software. Semi-empirical absorption corrections were applied using the SCALE program for the area detector. The structures were solved using direct methods and refined using full matrix least-squares methods on F2 using SHELX-2014[17]. All structures were refined to converge with anisotropic displacement parameters.
CCDC: 433850.
1.4 Elemental analysis
Several single crystals of the title compound were selected and energy dispersive X-ray spectroscopy (EDS) measurements were performed using a Zeiss Auriga scanning electron microscope with an energy dispersive spectrometer to determine the elemental composition. The spectra obtained from visibly clean surfaces provided results identical to those of the crystallographic data. The compositions were homo-geneous within one crystal, and, within standard unce-rtainty, identical to those of crystals selected at random from different reactions (Supporting Information).
1.5 Thermogravimetry (TG)/DSC
A Netzsch Thermal Analysis STA 449 F3 Jupiter® was used to evaluate the thermal properties of α-BaZn2P2 between 50 and 950 ℃. After a baseline was established, 166.598 6 mg of prepared powdered sample was placed in an alumina crucible and heated under argon at 10 K·min-1.
1.6 Calculation of electronic and energy band structures
The calculations were based on density functional theory (DFT) and used first-principles approaches. Similar calculation results for BaZn2As2 were reported by Shein et al in 2014[18]. The Vienna ab initio simul-ation package using the projector augmented wave method was used to calculate the equilibrium structural parameters and elastic properties of the polymorphs[19-20]. The exchange correlation potentials were calculated using the Perdew-Burke-Ernzerhof generalized gradient approximation (PBE-GGA)[21]. A kinetic energy cutoff of 500 eV and k-mesh of 5×10×5 for an orthorhombic structure were used. The geometry optimization was performed with a force cutoff of 10 meV·nm-1.
2 Results and discussion
2.1 Structure description
The α-BaZn2P2 single crystals were prepared via a Sn-flux reaction. The EDS results were consistent with the stoichiometry as written. Single-crystal X-ray diffraction confirm that BaZn2P2 crystallizes with the α-BaCu2S2-type structure (space group Pnma). Crys-tallographic data and structural refinements are summarized in Table 1. The cell parameters are a=0.976 78(5) nm, b=0.413 34(2) nm, c=1.060 55(5) nm. Selected atomic positional and displacement parameters are shown in Table S1, and the most important interatomic distances and angles are presented in Table S2.
 Table 1.
Crystal data and structure refinement for α-BaZn2P2
Table 1.
Crystal data and structure refinement for α-BaZn2P2
Formula BaZn2P2 Formula weight 330.2 Crystal ststem Orthorhombic Space group Pnma a/nm 0.976 78(5) b/nm 0.413 34(2) c/nm 1.060 55(5) V/nm3 0.428 19(4) Z 4 Dc/(g·cm-3) 5.ll9 GOF l.04 Final R indices[I>2σ(I)]a R1=0.025 8, wR2=0.063 9 Final R indices(all data)a R1=0.025 8, wR2=0.064 0 aR1=[Σ||Fo|-|Fc||]/Σ|Fo|, wR2=[Σw(|Fo2|-|Fc2|)2]/Σw(|Fo|2)2]1/2 The crystal structures of α-and β-BaZn2P2 are shown in Fig. 1; the Ba atoms are orange, Zn atoms are yellow, and P atoms are green. As shown in Fig. 1(a), α-BaZn2P2 features a 3D network of Zn and P atoms that form large cavities in which Ba atoms reside. Ba is in seven-fold coordination with respect to Zn, with Ba-Zn distances ranging from 0.326 17(7) to 0.364 30(6) nm (distances here and later in the article were obtained from X-ray data at 296 K). Seven P atoms surround each Ba, and the Ba-P distances range from 0.319 66(14) to 0.350 26(12) nm. The Zn1 and Zn2 atoms both have tetrahedral coordination with P atoms, with Zn-P distances ranging from 0.243 26(8) to 0.255 04(15) nm. The polyhedral view with ZnP4 tetrahedra is shown in Fig.S1. Fig.S1(a) shows that the ZnP4 tetrahedra form the anion frame by sharing sides or vertices and that Ba2+ cations are located in the large cavities. Fig.S1(b, c) show the chains in the b-axis formed by sharing sides of Zn1-and Zn2-centered ZnP4 tetrahedra. Fig.S1(d) shows the cavity where Ba atoms are located; the cavities were formed through the sharing of the vertices (P atoms) of the ZnP4 tetrahedra. The bond angles of ZnP4 tetrahedra are presented in Table S2, and are 94°~117° for Zn1, 106°~115° for Zn2, 84°~143° for P1, and 73°~138° for P2.
 图1
(a) Polyhedral and ball-and-stick models of the crystal structure of α-BaZn2P2; (b) Ball-and-stick model of β-BaZn2P2
Figure1.
(a) Polyhedral and ball-and-stick models of the crystal structure of α-BaZn2P2; (b) Ball-and-stick model of β-BaZn2P2
图1
(a) Polyhedral and ball-and-stick models of the crystal structure of α-BaZn2P2; (b) Ball-and-stick model of β-BaZn2P2
Figure1.
(a) Polyhedral and ball-and-stick models of the crystal structure of α-BaZn2P2; (b) Ball-and-stick model of β-BaZn2P2
For comparison, Fig. 1(b) shows the ball-and-stick model of β-BaZn2P2, which crystallizes in a tetragonal phase, with the ThCr2Si2-type structure and the space group I4/mmm. The high-temperature β phase of BaZn2P2 contains layers of edge-sharing ZnP4 tetra-hedra separated by Ba atom layers (Fig.S1(e, f)).
2.2 XRD
XRD was conducted for α-BaZn2P2, and the results are shown in Fig. 2(a). For comparison, the calculated XRD patterns of α-BaZn2P2 (Pnma) and β-BaZn2P2 (I4/mmm) are shown in Fig. 2(b) and 2(c), respectively. Fig. 2 shows that the collected samples are α-BaZn2P2 (Pnma); the small peaks indicated with an asterisk (*) in the collected data curve are Sn peaks. The α-BaZn2P2 peak (2θ=32.23°) in the collected data spectrum is very intense because it partially overlaps with a Sn peak (2θ=32.04°).
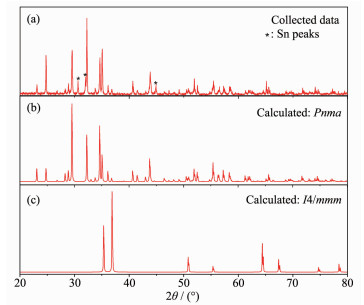 图2
XRD pattern of α-BaZn2P2 single crystals ground into a powder (a), calculated XRD patterns of α-BaZn2P2 with space group Pnma (b) and β-BaZn2P2 with space group I4/mmm (c)
Figure2.
XRD pattern of α-BaZn2P2 single crystals ground into a powder (a), calculated XRD patterns of α-BaZn2P2 with space group Pnma (b) and β-BaZn2P2 with space group I4/mmm (c)
图2
XRD pattern of α-BaZn2P2 single crystals ground into a powder (a), calculated XRD patterns of α-BaZn2P2 with space group Pnma (b) and β-BaZn2P2 with space group I4/mmm (c)
Figure2.
XRD pattern of α-BaZn2P2 single crystals ground into a powder (a), calculated XRD patterns of α-BaZn2P2 with space group Pnma (b) and β-BaZn2P2 with space group I4/mmm (c)
Fig. 3 shows the temperature-dependent XRD results. As the temperature increased to 920 ℃, α-BaZn2P2 was basically retained, while the peak positions were shifted to the left and the small peaks of α-BaZn2P2 shrank and gradually disappeared. During the experiment, the general structure of α-BaZn2P2 was retained even at 920 ℃. However, with the increase in temperature during the heating process, the atomic vibration of α-BaZn2P2 increased, the interplanar spacing became larger, and the degree of disorder increased. At the same time, the main peak (2θ≈29°) of α-BaZn2P2 indicate cleavage with increasing temperature, which was the result of the exacerbation of atomic vibration.
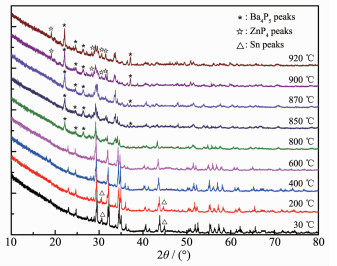 图3
Temperature-dependent XRD patterns of α-BaZn2P2 from 30 to 920 ℃
Figure3.
Temperature-dependent XRD patterns of α-BaZn2P2 from 30 to 920 ℃
图3
Temperature-dependent XRD patterns of α-BaZn2P2 from 30 to 920 ℃
Figure3.
Temperature-dependent XRD patterns of α-BaZn2P2 from 30 to 920 ℃
In addition, the peaks changed during the heating process (Fig. 3). At 30 ℃, the main species is α-BaZn2P2 with a bit of Sn (small peaks indicated with a triangle △), and the Sn peaks disappeared when the temperature reached 400 ℃. When the temperature reached 800 ℃, some new peaks of Ba4P5 appeared, which were indicated with an asterisk (*). When the temperature reached 900 ℃, new peaks of ZnP4 appe-ared, which were indicated with a white star (☆), and there may be some other new binary phases. There-fore, α-BaZn2P2 can decompose during the heating process. This is consistent with the results of DSC.
2.3 Thermal stability analysis
Differential thermal analysis (DTA) and TG experiments were performed over the 50~950 ℃ temperature range with the sample under the protec-tion of an Ar atmosphere, and the results are pres-ented in Fig. 4. For α-BaZn2P2, no significant mass loss was observed in the TG curve over the entire measured temperature range, and the endothermic peak appearing at around 230 ℃ in the DSC curve should be attributed to the melting of remaining Sn from the flux. The endothermic peaks appearing at around 860 ℃ in the DSC curve indicate the decomposition of α-BaZn2P2, which results in binary phases such as Ba4P5 and ZnP4, as confirmed by XRD patterns.
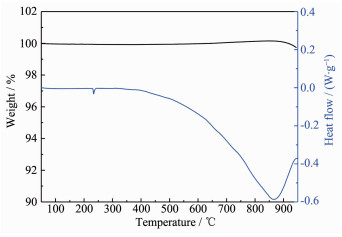 图4
TG (black) and DSC (blue) curves for α-BaZn2P2
Figure4.
TG (black) and DSC (blue) curves for α-BaZn2P2
图4
TG (black) and DSC (blue) curves for α-BaZn2P2
Figure4.
TG (black) and DSC (blue) curves for α-BaZn2P2
2.4 Electronic and energy band structure calculations
To understand better the properties of the new Zintl phase, electronic structure calculations were performed for α-BaZn2P2. The results are presented in Fig. 5. α-BaZn2P2 has a small bandgap of approximately 0.4 eV, typical for a narrow-bandgap semiconductor. In Fig. 5(a), the electrons in the 4d orbitals of Ba atoms are still in the conduction band, while those in the s and p orbitals are all transferred to Zn or P atoms. In the ZnP4 tetrahedron structures in α-BaZn2P2, Zn2+ provides four unoccupied orbitals with the lowest energy and forms coordination bonds (Zn-P bonds) with P. So Fig. 5(a) shows the orbital hybridization, which should be sp3 hybridization. The energy band structures are presented in Fig. 5(b), and direct transi-tions were found in this semiconducting material.
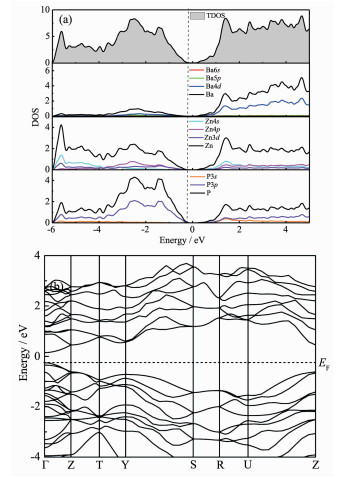 图5
(a) Calculated total density of states (TDOS) and partial density of states (PDOS) for various constituent atoms in α-BaZn2P2; (b) Energy band structures of α-BaZn2P2
Figure5.
(a) Calculated total density of states (TDOS) and partial density of states (PDOS) for various constituent atoms in α-BaZn2P2; (b) Energy band structures of α-BaZn2P2
图5
(a) Calculated total density of states (TDOS) and partial density of states (PDOS) for various constituent atoms in α-BaZn2P2; (b) Energy band structures of α-BaZn2P2
Figure5.
(a) Calculated total density of states (TDOS) and partial density of states (PDOS) for various constituent atoms in α-BaZn2P2; (b) Energy band structures of α-BaZn2P2
3 Conclusions
A new Zintl phase compound, α-BaZn2P2, with the space group Pnma was synthesized through metal-flux reactions. The structure was accurately determined using single-crystal XRD techniques. α-BaZn2P2 has a three-dimensional network structure, where ZnP4 tetra-hedra form an anion frame by sharing sides or vertices, with Ba2+ cations residing within. There was no phase transition, but decomposition occurred during the heating process. The electronic and energy band structures were calculated in order to understand clearly the properties of α-BaZn2P2. The energy gap was approximately 0.4 eV, which indicates that α-BaZn2P2 is a narrow-bandgap semiconductor.
Supporting information is available at http://www.wjhxxb.cn
-
-
[1]
Miller G J, Schmidt M W, Wang F, et al. Struct. Bond., 2011, 139:1-57 doi: 10.1007/978-3-642-21150-8
-
[2]
Wang F, Miller G J. Inorg. Chem., 2011, 50:7625-7636
-
[3]
Bojin M D, Hoffmann R. Helv. Chim. Acta, 2003, 86:1653-1682 doi: 10.1002/hlca.200390141/pdf
-
[4]
Pan M Y, Xia S Q, Liu X, et al. Eur. J. Inorg. Chem., 2015, 46(33):2724-2731
-
[5]
Brown S R, Kauzlarich S M, Gascoin F, et al. Chem. Mater., 2006, 18(7):1873-1877
-
[6]
赵立冬.西华大学学报:自然科学版, 2015(1):1-13ZHAO Li-Dong. Journal of Xihua University:Natural Science Edition, 2015(1):1-13
-
[7]
Ban Z, Sikirica M. Acta Crystallogr., 1965, 18:594-599 doi: 10.1107/S0365110X6500141X
-
[8]
Rotter M, Pangerl M, Tegel M, et al. Angew. Chem. Int. Ed., 2008, 47(41):7949-7952 doi: 10.1002/anie.v47:41
-
[9]
Rotter M, Tegel M, Johrendt D, et al. Phys. Rev. B, 2008, 78(2):1436-1446
-
[10]
Condron C L, Hope H, Piccoli P M, et al. Inorg. Chem., 2007, 46(11):4523-4529 doi: 10.1021/ic070078h
-
[11]
Gladyshevskii E I, Kripyakevich P I, Bodak O I. Ukr. Fiz. Zh., 1967, 12:447-452
-
[12]
Sun J, Singh D J. J. Mater. Chem. A, 2017, 5(18):8499-8509 http://meetings.aps.org/Meeting/MAR17/Session/H8.8
-
[13]
Iglesia J E, Pachali K E, Steinfink H. J. Solid State Chem., 1974, 9(1):6-14 http://www.sciencedirect.com/science/article/pii/0022459674900498
-
[14]
Huster J, Bronger W. Z. Anorg. Allg. Chem., 1999, 625:2033-2040
-
[15]
Leoni S, Carrillo-Cabrera W, Schnelle W, et al. Solid State Sci., 2003, 5(1):139-148 doi: 10.1016/S1293-2558(02)00088-2
-
[16]
Klüfers P, Mewis A. Z. Naturforsch., B:Chem. Sci., 1978, 33(2):151-155 doi: 10.1515/znb-1978-0207
-
[17]
Sheldrick G M. SHELX-2014, Program for the Solution and the Refinement of Crystal Structures, University of Göttingen, Germany, 2014.
-
[18]
Shein I R, Ivanovskii A L. J. Alloys Compd., 2014, 583:100-105 doi: 10.1016/j.jallcom.2013.08.118
-
[19]
Kresse G, Joubert D. Phys. Rev. B, 1999, 59(3):1758-1775 http://adsabs.harvard.edu/abs/1999PhRvB..59.1758K
-
[20]
Kresse G, Furthmuller J. Phys. Rev. B, 1996, 54(16):11169-11186
-
[21]
Perdew J P, Burke S, Ernzerhof M. Phys. Rev. Lett., 1996, 77(18):3865-3868
-
[1]
-

Figure 1 (a) Polyhedral and ball-and-stick models of the crystal structure of α-BaZn2P2; (b) Ball-and-stick model of β-BaZn2P2
Ba, Zn, and P atoms are shown in orange, yellow, and green, respectively

Figure 2 XRD pattern of α-BaZn2P2 single crystals ground into a powder (a), calculated XRD patterns of α-BaZn2P2 with space group Pnma (b) and β-BaZn2P2 with space group I4/mmm (c)

Figure 5 (a) Calculated total density of states (TDOS) and partial density of states (PDOS) for various constituent atoms in α-BaZn2P2; (b) Energy band structures of α-BaZn2P2
Fermi energy was chosen for energy reference in (a)
Table 1. Crystal data and structure refinement for α-BaZn2P2
Formula BaZn2P2 Formula weight 330.2 Crystal ststem Orthorhombic Space group Pnma a/nm 0.976 78(5) b/nm 0.413 34(2) c/nm 1.060 55(5) V/nm3 0.428 19(4) Z 4 Dc/(g·cm-3) 5.ll9 GOF l.04 Final R indices[I>2σ(I)]a R1=0.025 8, wR2=0.063 9 Final R indices(all data)a R1=0.025 8, wR2=0.064 0 aR1=[Σ||Fo|-|Fc||]/Σ|Fo|, wR2=[Σw(|Fo2|-|Fc2|)2]/Σw(|Fo|2)2]1/2  下载: 导出CSV
-


 扫一扫看文章
计量
- PDF下载量: 13
- 文章访问数: 2307
- HTML全文浏览量: 320
 下载:
下载:
