Received Date:
21 May 2025 Accepted Date:
09 September 2025 Revised Date:
08 September 2025 Available Online:
15 August 2026
Abstract:
Calcitonin (CT), a 32-amino acid polypeptide drug, is crucial in regulating calcium homeostasis and inhibiting osteoclast activity. CT is primarily administered via injections and nasal sprays. However, injections usually suffer from poor patient compliance, while nasal sprays may cause side effects such as epistaxis, rhinitis, and nasal mucosal ulcers, coupled with low bioavailability. Deep eutectic solvents (DESs), formed by hydrogen-bond donors and acceptors, have shown potential in overcoming intestinal permeability barriers and facilitating the oral delivery of peptide drugs. Herein, we developed an intestinal drug delivery system for CT using DESs, which is expected to facilitate the subsequent development of oral preparations. We first prepared and characterized DESs with different stoichiometric ratios of choline (Ch) and geranate (Ge), followed by the investigation of the interaction between CT and Ch-Ge-based DESs (CAGE). Intestinal transport studies revealed that CAGE significantly promoted the jejunal absorption of CT-CAGE 1:2 (Ch and Ge in a 1:2 ratio), exhibiting the most pronounced pro-permeability effect. In vivo pharmacokinetic and pharmacodynamic results indicated that, compared with the aqueous CT solution, the CT-CAGE formulation increased bioavailability to 3.53%, with a significant hypocalcemic effect. In vitro studies further demonstrated that CAGE increased the transmembrane transport and membrane permeability of CT. The pro-permeability mechanism of CAGE may be related to the opening of tight junctions between intestinal cells and the improvement of paracellular transport efficiency. This DES-based drug delivery system offers a novel and promising approach for the oral delivery design of CT, addressing the limitations of administration routes.
With the rapid development of biotechnology, an increasing number of protein and peptide drugs with potent biological activity have emerged for the treatment of diverse diseases. Calcitonin (CT), a 32-amino-acid polypeptide, is clinically used to manage osteoporosis and hypercalcemia [1-3]. However, its therapeutic application faces significant challenges: the short plasma half-life (< 1 h) of CT necessitates frequent administration via daily or alternate-day injections. The clinical formulations primarily consist of injectable and nasal spray preparations. For instance, salmon CT injection (e.g., Miacalcin) is administered subcutaneously at a dose of 50–100 IU daily, with high bioavailability (~70%–80%). But this invasive regimen poses challenges for chronic treatment, often resulting in poor patient adherence and consequent economic/psychological burdens [4]. While nasal sprays offer improved patient acceptability compared to injections, they are associated with local adverse effects, including nasal irritation, epistaxis, rhinitis, and nasal mucosal ulceration [5]. Furthermore, their clinical application is severely constrained by low bioavailability, as demonstrated by the commercially available Miacalcin® nasal formulation, which achieves merely 3% systemic absorption [6]. These limitations have driven substantial research interest in developing novel CT delivery systems.
Oral-based drug delivery systems have remained a priority in peptide drug delivery due to their economic viability, dosing convenience, and superior patient compliance [7]. Nevertheless, the hydrophilic nature of CT renders it susceptible to gastrointestinal degradation while impeding mucosal permeation, collectively contributing to suboptimal oral bioavailability [8]. Consequently, two critical challenges dominate the CT oral delivery: gastrointestinal stability and systemic absorption. Several strategies, including permeation enhancers [9], nanoparticulate carriers [10] and pH-responsive formulations for targeted intestinal release [11], were employed to enhance the oral bioavailability of CT. However, most existing studies focus on nanoparticle delivery systems and suffer from drawbacks, including complex preparation processes, high costs, instability induced by external factors (such as temperature and pH), and potential toxicity.
Deep eutectic solvents (DESs) are eutectic mixtures mainly formed through hydrogen-bond interactions between hydrogen-bond donors (HBDs) and hydrogen-bond acceptors (HBAs) [12,13]. These DESs demonstrate multifunctional pharmaceutical applications, acting as solubilizers, permeation enhancers, antibacterial agents, and stabilizers for macromolecules in poorly soluble active pharmaceuticals [14-18]. In particular, DESs based on choline (Ch) and geranate (Ge) exhibit high biocompatibility, biodegradability, and negligible toxicity, demonstrating significant application potential in drug delivery [19-21]. Emerging evidence has shown that the Ch-Ge-based DESs (CAGE) can promote the paracellular transport of protein and peptide therapeutics while concurrently protecting against enzymatic degradation in the gastrointestinal tracts [22]. As a result, CAGE is a promising strategy for the oral delivery of biological drugs.
In this study, we developed an oral drug delivery platform integrating CT with CAGE (CT-CAGE). We first synthesized and characterized various DESs with different Ch-Ge molar ratios, then intensively investigated the interactions between CT and CAGE. Also, the hypocalcemic effect of the preparation was proved both in vitro and in vivo. CT-CAGE may reversibly open the tight junctions between cells, thereby improving the paracellular transport efficiency of CT and enhancing its oral absorption. More importantly, CT-CAGE had a significant hypocalcemic effect and showed no obvious irritation to the intestine. Therefore, CAGE is a promising strategy for designing the oral CT delivery system.
DESs with different Ch-Ge molar ratios (2:1, 1:1, and 1:2) were prepared using the heating and stirring method. CAGEs with various molar ratios exhibit distinct colors. As the content of Ch increases, the color deepens, and the viscosity rises (Fig. S1 in Supporting information). Meanwhile, the properties of CAGE prepared with different molar ratios are different. For example, as the content of Ch in the ratio increases, the density, pH value, and electrical conductivity of CAGE all increase (Fig. S2 in Supporting information). Subsequently, we utilized proton nuclear magnetic resonance spectroscopy (1H NMR) and Fourier transform infrared (FTIR). In 1H NMR, the singlet peak of Ge in CAGE at 11.87 ppm disappeared, indicating the formation of hydrogen bonds between Ge and Ch (Fig. S3 in Supporting information). In the FTIR spectrum, the absorption peaks of O-H and C = O in Ch appeared at 3403 and 1692.1 cm−1, respectively. The absorption peaks of O-H and C = O in Ge were observed at 2970.4 and 1692.1 cm−1, respectively. The shifts of the O-H and C = O absorption bands in DESs varied with the molar ratio of Ch to Ge. The -OH and C = O peaks in CAGE shifted to 3396.3–3422.9 and 1645.6–1689.8 cm−1, respectively (Fig. S4 in Supporting information). These results collectively confirmed the formation of CAGE.
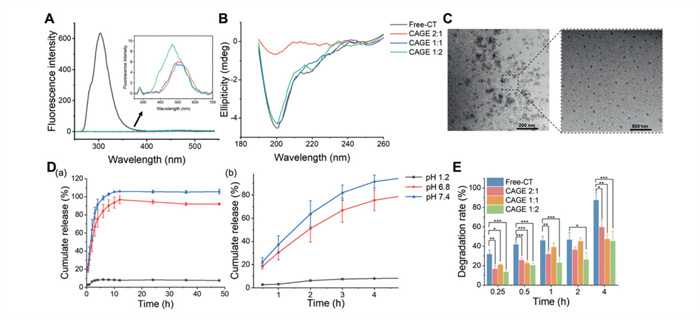
Next, we prepared CT-CAGE (with a 40% CAGE proportion in the solution) by vortexing. We investigated the interaction between CT and CAGE using fluorescence and circular dichroism (CD) spectroscopy. In the fluorescence spectrum, due to the presence of tyrosine in CT, irradiation with 280 nm excitation light results in maximum fluorescence emission intensity at 301 nm. After CT bonded to CAGE, the internal conformation of CT changed, altering the hydrophobic environment around the tyrosine residues and ultimately affecting its maximum fluorescence intensity. Fluorescence quenching can be observed in the three preparations with different molar ratios. The blue shift of the fluorescence emission peak of CT-CAGE, approaching the excitation peak, indicates that the tyrosine microenvironment became more hydrophobic, the macromolecule tended to be in a folded state, and the interaction between CAGE and CT was strong (Fig. 1A). Little alteration was observed in the shape and ellipticity of the CD spectra of the CAGEs 1:1 and 1:2 compared with the free CT (Fig. 1B). The negative peak at 200 nm was the random coil, which was the main secondary structure of CT. The data indicated that CAGEs 1:1 and 1:2 did not affect the secondary structure of CT.
Figure 1
Figure 1.
Preparation and characterization of CT-CAGE. (A) Fluorescence emission spectra of free CT and CT-CAGE with different molar ratios. (B) CD spectra of free CT and CT-CAGE. (C) TEM image. Scale bar: 200 nm (left) and 500 nm (right), respectively. (D) The in vitro release curve of CT-CAGE. (E) Enzymatic stability of free CT and various CT-CAGE incubated in simulated intestinal fluid containing pancreatin (pH 6.8). The data are given as mean ± SD (n = 3). *P < 0.05, ***P < 0.001 vs. the free CT.
Due to Ch's hydrophilicity and Ge's hydrophobic tail, CAGE exhibited self-assembly behavior in water or phosphate-buffered saline (PBS), forming micelles/nanoemulsion [23,24]. Here, we observed the morphology of CT-CAGE via transmission electron microscopy. The results showed that after being appropriately diluted with purified water, CT-CAGE formed particles with relatively uniform size and spherical-like shape, indicating that CAGE might form micelles/nano-emulsions when mixed with water (Fig. 1C). Subsequently, we investigated the in vitro release of CT-CAGE using the dialysis method. CT-CAGE released slowly in the buffer solution. Only 8% of CT was measurable in the pH 1.2 condition, due to the degradation of CT in acidic environments. This data suggests that the formulation can be destroyed in the gastric juice environment, necessitating bypass of the gastric environment during administration. In the pH 6.8 buffer solution, 97% of CT was released at 12 h, and its content decreased slightly thereafter. In the pH 7.4 buffer solution, CT was completely released by 10 h and reached a release equilibrium (Fig. 1D). These results suggest that CT-CAGE remained stable in the pH 7.4 buffer solution and exhibited a faster release rate while protecting CT in an acidic environment. Furthermore, enzymatic stability in the intestinal environment is a prerequisite for the development of oral peptide formulations. Herein, we investigated the enzymatic stability of CT-CAGE in simulated intestinal fluid. As shown in Fig. 1E, free CT was rapidly degraded in trypsin-containing simulated intestinal fluid, with a degradation rate of 87% after 4 h of incubation; in contrast, CT-CAGE demonstrated a degradation rate of 40%–60%. These results indicate that free CT is highly unstable in the intestinal environment, while CAGE can significantly alleviate the degradation of CT by trypsin, enhancing its resistance to intestinal enzymes.
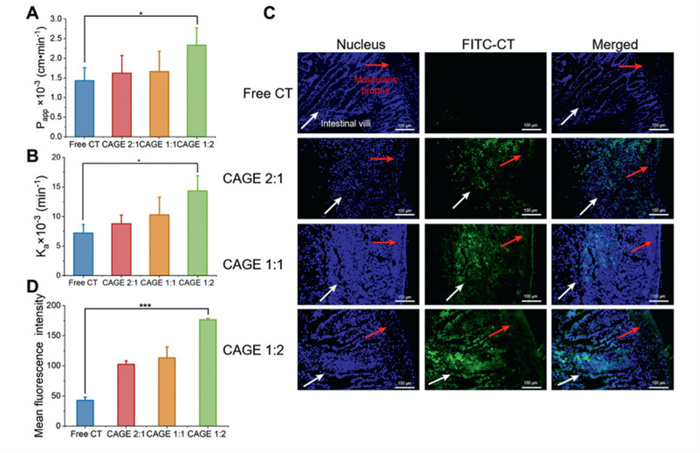
To screen the optimal ratio of Ch to GE, we investigated the permeation-enhancing effects of different formulations of CT-CAGE in the jejunum using in vivo unidirectional intestinal perfusion experiments (Figs. 2A and B, Table S1 in Supporting information). All the CAGE formulations could enhance the absorption of CT in the jejunum. Among them, the jejunal absorption rate constant (Ka) and apparent absorption coefficient (Papp) of the CAGE 1:2 group were approximately twice and 1.6 times those of the free CT group (P < 0.05), demonstrating a permeation-enhancing effect. Then, CT-CAGE uptake in the jejunal epithelium was observed using an upright fluorescence microscope. Compared with the free CT, CT-CAGE exhibited intense green fluorescence, localized outside the intestinal villi, and penetrated the epithelial cells, extending into the lamina propria. Moreover, the fluorescence distribution of the CAGE 1:2 group was higher than that of other groups (Fig. 2C). Additionally, the fluorescence intensity of CAGE 1:2 group was the highest, which was 4.6 times higher than that of the free CT group, indicating that CAGE 1:2 had the most substantial intestine permeation effect (Fig. 2D). This is likely attributed to the increased proportion of geranic acid, enhancing the lipophilicity of CAGE and boosting the interactions with lipid bilayers and tight-junction disruption [25]. However, the high hydrophobicity of geranic acid could compromise the peptide solubility at excessive ratios, potentially limiting CAGE permeation efficiency [26,27]. In summary, CAGE can effectively promote the penetration of CT into the intestinal mucus layer and epithelial cell layer, probably because CAGE opens tight junctions between epithelial cells.
Figure 2
Figure 2.
The intestinal transport of CT-CAGE. (A) Papp and (B) Ka of different drugs in the in situ single-pass intestinal perfusion experiment of rats. (C) The fluorescence imaging results diagram of the jejunum segment of rats after in situ intestinal perfusion. The left side of the image corresponds to the intestinal villus side, while the right side corresponds to the muscularis propria of the intestine. The blue fluorescence indicates the cell nucleus, and the green fluorescence indicates CT. Scale bar: 100 µm. (D) Semi-quantitative fluorescence analysis of CT-CAGE preparation using Image J. The data are shown as mean ± SD (n = 3). *P < 0.05, ***P < 0.001 vs. the free CT.
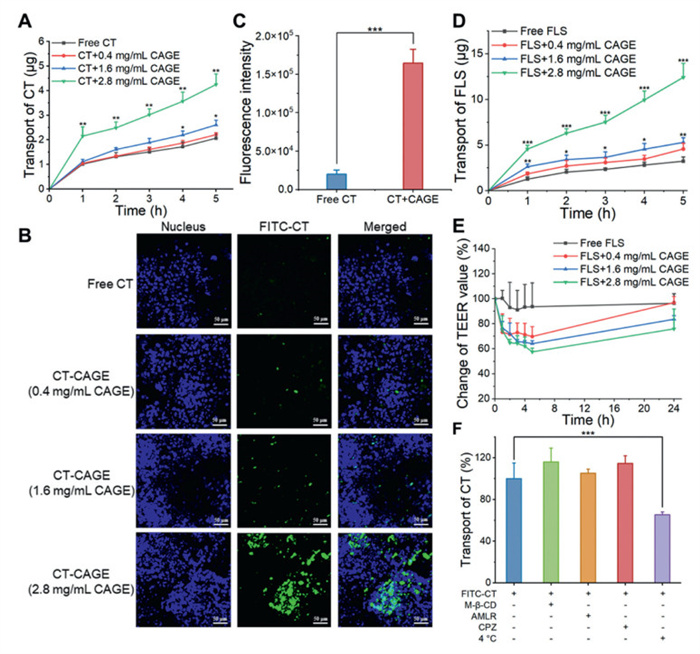
Then, Caco-2 cell monolayers were used to simulate the absorption and transport process of intestinal epithelial cells in vivo [28-30], and investigated the cellular uptake of CT-CAGE using confocal laser scanning microscopy (CLSM) and flow cytometry. As depicted in Fig. 3A, the increase in administration time resulted in increased CT transport. After 5 h of incubation, CAGE preparation groups exhibited higher drug transport than the free CT. The higher the CAGE concentration, the greater the transmembrane transport of CT. The CLSM images revealed that the uptake of FITC-CT by Caco-2 cells increased as the CAGE concentration of the preparation increased (Fig. 3B). Additionally, the flow cytometry quantification results also indicated that the transmembrane transport of CT in the preparation group was significantly higher than that in the free CT group (Fig. 3C).
Figure 3
Figure 3.In vitro absorption and transmembrane transport effect of CT-CAGE. (A) Concentration-dependent effects of CAGE on the transmembrane transport of CT. (B) Confocal microscopic images of the transwell membrane. The blue fluorescence represents the cell nucleus stained with 4′,6-diamidino-2-phenylindole, dihydrochloride (DAPI), and the green fluorescence corresponds to the FITC-CT. Scale bar: 50 µm. (C) Flow cytometry was used to investigate the uptake of FITC-CT by Caco-2 cells. (D) Concentration-dependent effects of CAGE on the transmembrane transport of FLS. (E) Concentration-dependent effects of CAGE on TEER values. (F) The effect of different inhibitors on the transmembrane transport of CT-CAGE. The data are given as mean ± SD (n = 3). *P < 0.05, **P < 0.01, ***P < 0.001 vs. the free CT (A, C, F). ***P < 0.001 vs. the free FLS (D, E).
Secondly, we investigated how CAGE promoted the transmembrane transport of CT through the paracellular and transcellular pathways. In the paracellular transport experiment, the transmembrane transport of FLS by CAGE was also observed in a time-dependent and concentration-dependent manner (Fig. 3D). In addition to quantitating the transport of CT-CAGE, we used an electrical resistance meter to measure the effects of CAGE at different concentrations on the electrical resistance value of intestinal epithelial cells at corresponding time points. The measurement of transepithelial electrical resistance (TEER) provides a rapid and straightforward method for evaluating epithelial cell barrier integrity. Changes in the TEER value can indicate alterations in the integrity of the tight junctions between cells [31]. As the administration time increased, the TEER value of Caco-2 cells gradually decreased while the amount of CT transport continuously increased. After 5 h of administration, the TEER value of the 2.8 mg/mL CAGE group decreased most significantly, consistent with the maximum CT transport observed (Fig. 3E). The results preliminarily demonstrated that CAGE may disrupt the tight junctions between epithelial cells, thereby enhancing the paracellular transport efficiency of CT and promoting the transmembrane transport of CT.
To further investigate the safety of CAGE, the culture medium containing the preparation was replaced with fresh cell culture medium after a 5-h transport, and the TEER value was measured after 24 h. The TEER values of the 2.8 mg/mL CAGE group, 1.6 mg/mL CAGE group, 0.4 mg/mL CAGE group, and the free fluorescein sodium (FLS) recovered to 76%, 84%, 97%, and 96% of their original values, respectively. After removing CAGE, Caco-2 cells were able to restore the tight junctions between them and form a complete layer of intestinal epithelial cells again. Therefore, CAGE 1:2 may reversibly and transiently open the tight junctions between Caco-2 cells, which demonstrated the favorable safety of CAGE at the cellular level (Fig. 3E), consistent with a previous report [22].
To determine the transcellular transport pathway of CT-CAGE, Caco-2 monolayers were pretreated with three different endocytosis inhibitors. The CT transport remained almost unchanged compared with the control group after Caco-2 cells were treated with the three inhibitors, methyl-β-cyclodextrin (M-β-CD), chlorpromazine (CPZ), and amiloride (AMLR). These results indicated that CAGE did not promote the transmembrane transport of CT through the three major transcellular pathways (caveolin-mediated endocytosis, clathrin-mediated endocytosis, or micropinocytosis). Additionally, the cold temperature incubation (4 ℃) indicated that the uptake of CT-CAGE was significantly suppressed (Fig. 3F), suggesting that active transport mechanisms may be the primary route for cellular uptake of CT-CAGE. In summary, the permeation-enhancing mechanism of CAGE could be attributed to the reversible opening of the tight junctions between epithelial cells.
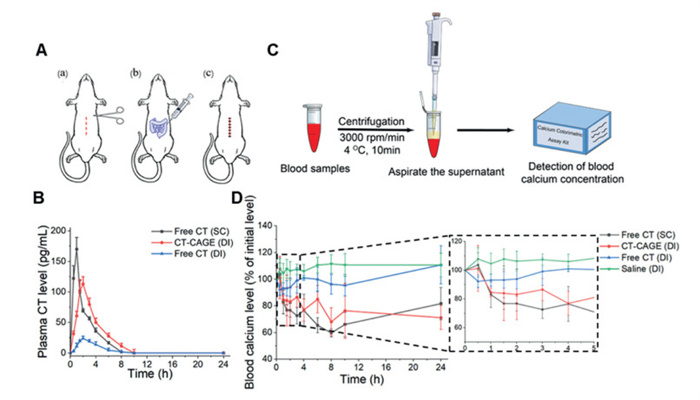
Subsequently, we evaluated the pharmacokinetic behavior and hypocalcemic effect of the preparation in rats via intestinal injection administration. All experimental procedures were performed following the protocols approved by the China Pharmaceutical University Institutional Animal Care and Use Committee (No. 202406068). The schematic diagram of the duodenal injection (DI) experiment is shown in Fig. 4A. In the in vivo pharmacokinetic study after intestinal administration of CT-CAGE, the Cmax of the CT intestinal injection group was only 23.79 pg/mL. In comparison, the CT-CAGE intestinal injection group achieved a concentration of 116.83 pg/mL. The area under the curve (AUC) of the CT intestinal injection group was only 84.39 pg h mL−1, whereas the AUC of the CT-CAGE intestinal injection group could reach 413.65 pg h mL−1. The bioavailability of free CT was extremely low (0.72%), while CT-CAGE has a 3.53% bioavailability, 4.9-fold higher than that of the free CT group (Fig. 4B and Table S2 in Supporting information). The results demonstrated that CAGE enhanced intestinal absorption.
Figure 4
Figure 4.
Pharmacokinetic behavior and hypocalcemic effect of CT-CAGE in the Sprague-Dawley rat model. (A) Illustration of DI in rats. (B) The concentration of the drug changes over time after the administration of each preparation. (C) The determination process of blood calcium concentration. (D) Changes in the level of calcium ions in the serum of rats. The data are given as mean ± SD (n = 4).
In addition, the in vivo pharmacodynamic study revealed that the intestinal injection of CT-CAGE had a significant hypocalcemic effect. At 8 h post-administration, the blood calcium concentration could be reduced to 68% of the initial level, and the hypocalcemic effect persisted for 24 h (Figs. 4C and D). Compared with the control group receiving a DI of CT aqueous solution, the preparation group demonstrated a favorable in vivo hypocalcemic effect. In conclusion, CAGE significantly improved the bioavailability and therapeutic effect of CT. CT-CAGE could stably and continuously exert a hypocalcemic effect, laying a foundation for the design of CT-CAGE oral preparations.
Currently, several oral peptide formulations, including OSTORATM, Mycapssa, and Rybelsus, achieve oral delivery using lauroyl carnitine chloride, transient permeation enhancers (TPE), and sodium N-[8-(2-hydroxybenzoyl)aminocaprylate] (SNAC) respectively [5,32,33]. These formulations have been approved or are ongoing clinical trials, exhibiting simplicity and a 1% bioavailability with effectiveness. For instance, OSTORATM, an oral CT formulation prepared by encapsulating citric acid vesicles into enteric-coated capsules, has completed Phase Ⅲ clinical trials, demonstrating a 1% bioavailability and hypocalcemic effect [34]. This technology utilizes lauroyl carnitine chloride as the intestinal permeability enhancer and citric acid as a pH-lowering agent to create a locally weakly acidic microenvironment (pH 4.5–5.5) in the intestine and inhibit protease activity [35]. Herein, we reported a 3.53% bioavailability in the intestine using CT-CAGE with a simple formulation and preparation. The study offers a promising strategy for the oral CT administration.
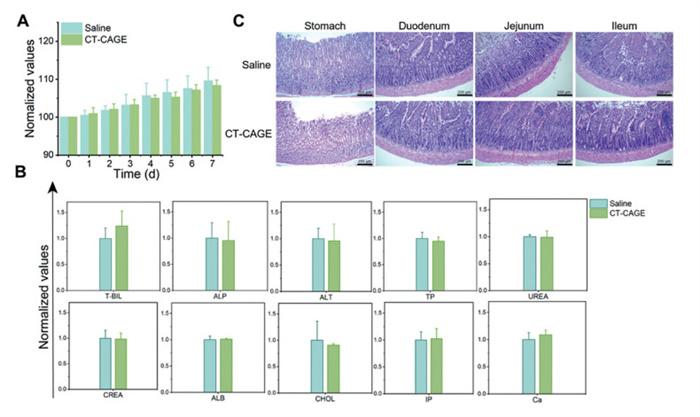
To evaluate the acute toxicity of CAGE in rats, we recorded the body weight changes of the rats after seven consecutive days of administration, observed the gastrointestinal tissue morphology, and detected serum biochemical indices. Both the control and CT-CAGE groups exhibited steady body weight gain (Fig. 5A). Furthermore, CT-CAGE showed no significant changes in intestinal tissue morphology and no substantial alterations in the serum biochemical indices of rats compared with the control group (Figs. 5B and C), indicating the favorable safety profile of CAGE.
Figure 5
Figure 5.
Safety evaluation of rats after 7 days of continuous administration. (A) The changes in the body weight of rats during administration. (B) Blood biochemistry test of rats. (C) Intestinal tissue section. Scale bar: 200 µm. The data are given as mean ± SD (n = 3).
In summary, we verified that CAGE is a promising strategy for oral CT delivery. The mechanistic investigations revealed that CAGE exhibited a substantial permeation-enhancing effect by reversibly and transiently opening tight junctions between intestinal epithelial cells. More significantly, CT-CAGE demonstrates excellent hypocalcemic efficacy, improved bioavailability of CT and negligible toxicity, possessing promising translational potential.
Declaration of competing interest
The authors declare that they have no known competing financial interests or personal relationships that could have appeared to influence the work reported in this paper.
This study was supported by the National Natural Science Foundation of China (Nos. 81872823, 82073782, 82241002) and the Key R&D Plan of Ganjiang New District of Jiangxi (No. 2023010).
Supplementary materials
Supplementary material associated with this article can be found, in the online version, at doi:10.1016/j.cclet.2025.111818.
[1]
C.H. Chesnut 3rd, M. Azria, S. Silverman, et al., Osteoporos Int. 19 (2008) 479-491. doi: 10.1007/s00198-007-0490-1
N. Binkley, M. Bolognese, A. Sidorowicz-Bialynicka, J. Bone Miner. Res. 27 (2012) 1821–1829. doi: 10.1002/jbmr.1602
[35]
S.H. Welling, F. Hubalek, J. Jacobsen, et al., Eur. J. Pharm. Biopharm. 86 (2014) 544-551. doi: 10.1016/j.ejpb.2013.12.017
Figure 1
Preparation and characterization of CT-CAGE. (A) Fluorescence emission spectra of free CT and CT-CAGE with different molar ratios. (B) CD spectra of free CT and CT-CAGE. (C) TEM image. Scale bar: 200 nm (left) and 500 nm (right), respectively. (D) The in vitro release curve of CT-CAGE. (E) Enzymatic stability of free CT and various CT-CAGE incubated in simulated intestinal fluid containing pancreatin (pH 6.8). The data are given as mean ± SD (n = 3). *P < 0.05, ***P < 0.001 vs. the free CT.
Figure 2
The intestinal transport of CT-CAGE. (A) Papp and (B) Ka of different drugs in the in situ single-pass intestinal perfusion experiment of rats. (C) The fluorescence imaging results diagram of the jejunum segment of rats after in situ intestinal perfusion. The left side of the image corresponds to the intestinal villus side, while the right side corresponds to the muscularis propria of the intestine. The blue fluorescence indicates the cell nucleus, and the green fluorescence indicates CT. Scale bar: 100 µm. (D) Semi-quantitative fluorescence analysis of CT-CAGE preparation using Image J. The data are shown as mean ± SD (n = 3). *P < 0.05, ***P < 0.001 vs. the free CT.
Figure 3In vitro absorption and transmembrane transport effect of CT-CAGE. (A) Concentration-dependent effects of CAGE on the transmembrane transport of CT. (B) Confocal microscopic images of the transwell membrane. The blue fluorescence represents the cell nucleus stained with 4′,6-diamidino-2-phenylindole, dihydrochloride (DAPI), and the green fluorescence corresponds to the FITC-CT. Scale bar: 50 µm. (C) Flow cytometry was used to investigate the uptake of FITC-CT by Caco-2 cells. (D) Concentration-dependent effects of CAGE on the transmembrane transport of FLS. (E) Concentration-dependent effects of CAGE on TEER values. (F) The effect of different inhibitors on the transmembrane transport of CT-CAGE. The data are given as mean ± SD (n = 3). *P < 0.05, **P < 0.01, ***P < 0.001 vs. the free CT (A, C, F). ***P < 0.001 vs. the free FLS (D, E).
Figure 4
Pharmacokinetic behavior and hypocalcemic effect of CT-CAGE in the Sprague-Dawley rat model. (A) Illustration of DI in rats. (B) The concentration of the drug changes over time after the administration of each preparation. (C) The determination process of blood calcium concentration. (D) Changes in the level of calcium ions in the serum of rats. The data are given as mean ± SD (n = 4).
Figure 5
Safety evaluation of rats after 7 days of continuous administration. (A) The changes in the body weight of rats during administration. (B) Blood biochemistry test of rats. (C) Intestinal tissue section. Scale bar: 200 µm. The data are given as mean ± SD (n = 3).


 DownLoad:

 下载:
下载:


 下载:
下载:

