Citation:
Xinrui Zhang, Hui Chen, Tingting Fan, Xueming Zhu, Ying Tan, Dan Gao. A microfluidic biosensor based on multiple signal amplification for rapid and sensitive detection of E. coli O157:H7 and Staphylococcus aureus[J]. Chinese Chemical Letters,
2026, 37(4): 111705.
doi:
10.1016/j.cclet.2025.111705
A microfluidic biosensor based on multiple signal amplification for rapid and sensitive detection of E. coli O157:H7 and Staphylococcus aureus
English
A microfluidic biosensor based on multiple signal amplification for rapid and sensitive detection of E. coli O157:H7 and Staphylococcus aureus
The State Key Laboratory of Chemical Oncogenomics, Key Laboratory of Chemical Biology, Tsinghua Shenzhen International Graduate School, Tsinghua University, Shenzhen 518055, China
b.
Key Laboratory of Metabolomics at Shenzhen, Shenzhen 518055, China
Received Date:
06 March 2025 Accepted Date:
10 August 2025 Revised Date:
30 July 2025 Available Online:
15 April 2026
Abstract:E. coli O157:H7 and Staphylococcus aureus have emerged as significant foodborne pathogens, characterized by considerable incidence rates and mortality. Despite advancements, current detection methods are hindered by challenges in enhancing specificity and sensitivity. Herein, we introduced a cutting-edge biosensor that employs a novel CHA-coupled CRISPR multi-stage signal amplification technique for the rapid and ultra-sensitive detection of these two pathogens. This microfluidic device consisted of an upstream serpentine mixing channel and a downstream boat-shaped microcavity equipped with a micro-column array, facilitating efficient reagent mixing, robust CHA amplification, and CRISPR reactions. Multiple signal amplification was achieved through bacterial competitive binding triggered by catalytic hairpin assembly (CHA) and crRNA-mediated CRISPR reactions. Based on this platform, the detection of target bacteria is transformed into nucleic acid detection, with a maximum detection range of 134 CFU/mL for E. coli O157:H7 and 181 CFU/mL for Staphylococcus aureus, which were better or comparable to previously reported biosensors. The entire assay was completed within approximately 1.5 h, with a minimal sample volume requirement of just 10 µL. The biosensor exhibited a high recovery rate, ranging from 95% to 115%, and demonstrated excellent specificity towards the target bacteria. In summary, this biosensor offers a rapid, accurate, and highly sensitive tool for food safety and clinical diagnostics.
Food contaminated with trace amounts of foodborne pathogens can pose a serious threat to food safety and public health. According to a WHO report from the second half of 2023, approximately 600 million people fall ill each year due to consuming contaminated food [1]. Pathogenic infections, exemplified by E. coli O157:H7 and S. aureus, can lead to recurrent intestinal inflammation, chronic kidney disease, diarrhea, reactive arthritis, blindness, and even death [2]. Consequently, the detection of pathogenic bacteria in food is crucial for the prevention and control of foodborne diseases [3]. One of the key strategies for mitigating the spread of foodborne pathogenic microorganisms is the effective and rapid detection of target bacteria, given that their estimated infectious dose can be as low as 10–100 cells [4]. To date, the gold standard for pathogen detection has predominantly relied on culture-based methods, which involve complex operations such as enrichment, purification, and cell plating, making them time-consuming and labor-intensive [5]. Enzyme-linked immunosorbent assay (ELISA) and polymerase chain reaction (PCR) are considered as rapid detection methods for pathogen detection [6]. However, ELISA suffers from low sensitivity due to its low efficiency in solid-liquid reactions, was prone to false positives due to cross contamination. Although PCR can improve detection sensitivity and specificity, it requires complex sample preparation, including gene extraction, which prolongs detection time [7]. There was an urgent need to develop a simple, rapid, and sensitive new method for detecting target pathogenic microorganisms [8].
In recent years, microfluidics has gained significant attention in the detection of foodborne pathogens due to their distinct advantages, including low reagent consumption, fast response, automated operation, and miniaturization [9]. Most detection techniques, such as colorimetry [10], surface enhanced Raman scattering [11], chemiluminescence [12] and electrochemical methods [7] combined with immunological or molecular biology analysis [13], have been integrated into microfluidic devices for pathogen detection [14]. However, these methods still encounter challenges such as insufficient sensitivity, complex sample pretreatment, and enrichment procedures, which significantly hinder their further practical applications [15]. Considering the complexity of food matrices and the potential presence of multiple pathogens in a single sample, the development of multiplexed detection platforms was crucial to ensure comprehensive and efficient pathogen screening [16].
The clustered regularly interspaced short palindromic repeats (CRISPR) technology, specifically the CRISPR/Cas12a system, represented a groundbreaking advancement in genetic engineering and molecular diagnostics [17]. This potent tool facilitates precise genome editing and the development of highly sensitive detection assays, making it an ideal solution for addressing challenges posed by foodborne pathogens [18]. For instance, the CRISPR/Cas12a system can randomly cleaved single-stranded DNA (ssDNA) with high base resolution and requires only a single crRNA, unaffected by airborne RNase [19]. In comparison, CRISPR/Cas9 necessitated two crRNA molecules for localization, and CRISPR/Cas13a [20] targets ssRNA. Despite its advantages, the CRISPR/Cas12a system exhibited relatively low signal amplification, necessitating an appropriate isothermal nucleic acid amplification (NAA) method for secondary amplification [14]. According to Lu’s group research on the micropillar array, it can well increase the specific surface area and improve the reaction efficiency. In addition, when designing the reaction sequence, we designed 6 nucleic acid sequence at the end of the nucleic acid to enhance its flexibility and avoid the influence of steric hindrance [21]. Recently, various enzyme-free amplification strategies have been employed to enhance detection sensitivity [22], such as rolling circle amplification (RCA) [23], hybrid strand reaction (HCR) [24], DNA walker [25], catalytic hairpin assembly (CHA) [26]. Among them, CHA, a toehold-mediated strand displacement reaction driven by the free energy of base pair formation [27], offers significant benefits such as minimal background noise, excellent amplification capability, and high catalytic efficiency [28]. Consequently, CHA was widely utilized as a sensitive sensor that binds to specific aptamers for the detection of biomolecules and bacteria [29]. Moreover, the modular design of CHA components allowed the use of the same crRNA to detect double-stranded DNA products produced by CHA reactions from various pathogenic microbial targets, providing a universal strategy for detecting of foodborne pathogens [30]. In summary, the combination of CHA signal amplification and catalytic CRISPR amplification presented significant opportunities for the high sensitivity and rapid detection of foodborne pathogens [31,32]. Compared with the existing CHA-CRISPR detection platform, taking the research of Zhang’s group as an example [33], they designed different crRNA sequences according to special target detectors. In this work, by ingeniously designing the "constant region" sequences of H1 and H2 strands, specific CHA products can be formed. Using one crRNA, the CHA products of different target bacteria can be recognized, providing a modular platform.
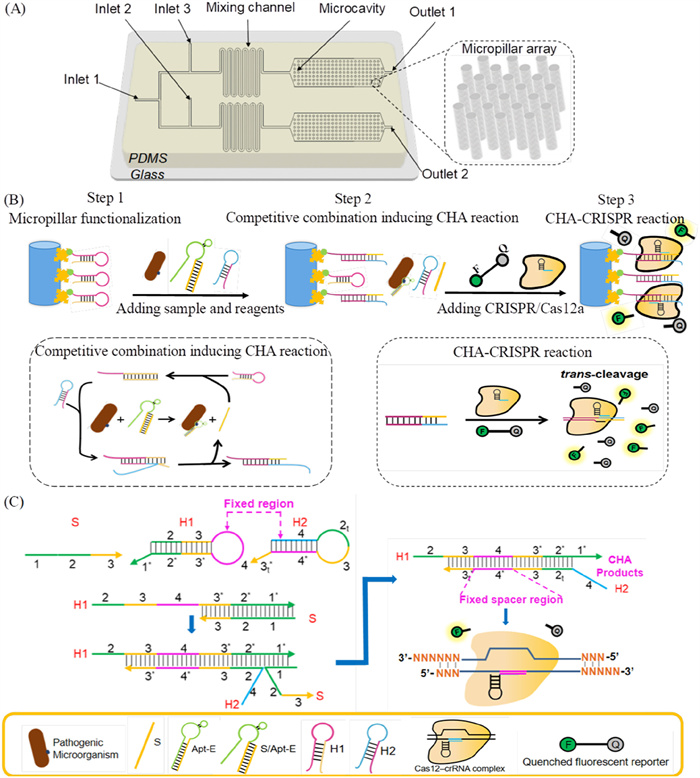
In this study, we developed a microfluidic biosensor that employs a multiple amplification strategy through the CHA and CRISPR systems for the rapid, highly sensitive, and simultaneous detection of E. coli O157:H7 and S. aureus. As shown in Fig. 1A, the upstream section of the microfluidic chip featured a serpentine mixing channel for effectively mixing. The downstream section contained a boat-shaped microcavity and a microcolumn array, which were used to immobilize H1 for further CHA and CRISPR/Cas12a enzymatic reactions. A photo of the microfluidic device was shown in Fig. S1 (Supporting information). The detection procedures for E. coli O157:H7 and S. aureus were shown in Fig. 1B. Pathogenic bacteria were injected into the chip through inlet 1. Meanwhile, the reaction reagents for different bacteria were injected through inlet 2 and 3, respectively. The reaction reagents contain the hybrid product of bacterial specific aptamer and S chain, and the H2 chain. The mixture was flowed into the intermediate serpentine channel and thoroughly mixed. For CHA amplification reaction as illustrated in the dashed box, a pair of hairpins (H1 and H2) were designed to not initially interact with each other. The initiation sequence S first forced H1 to open its hairpin structure and forms the S/H1 intermediate, while the previously-blocked domain of H1 was unblocked and then combines with H2 to produce a more stable H1/H2 duplex along with the release of S. The released S continuously catalyzed hairpins interactions without being consumed, enabling signal amplification. To specific detection of E. coli O157:H7 and S. aureus on chip, S was conjugated with the specific aptamer of the E. coli O157:H7 and S. aureus (Apt-E and Apt-S) through complementary base pairing, and H1 was immobilized in the downstream microcavity of the chip, whereas H2 was free in solution. In the presence of E. coli O157:H7 and S. aureus, the bacteria can competitively bind to the Apt-E or Apt-S to replace S. The released S could further initiate the CHA reaction between H1 and H2, yielding a large number of H1/H2 double strands immobilized inside the channel. After that, CRISPR system was added through inlet 2 and 3, and crRNA will recognize the CHA products and activate the trans cleavage activity of Cas proteins and non-specific cleavage of the F-Q probe to generate fluorescent signals, as explained in the dash box of CHA-CRISPR reaction. In the absence of target bacteria, the target bacteria specific aptamer continuously binds to the S chain without initiating the CHA and CRISPR reactions, and as a result, no fluorescence signal is emitted.
Figure 1
Figure 1.
Schematic illustration of the microfluidic biosensor based on multiple signal amplification strategy for detection of E. coli O157:H7 and S. aureus. (A) Overall design diagram of the microfluidic chip. (B) The principle diagram of the multiple signal amplification strategy. (C) Schematic presentation of the versatility of CRISPR-CHA for the detection of different bacteria targets.
In CRISPR-CHA system, the modular design of CHA components allowed the same crRNA to probe DNA duplex outputs from different targets, offering a universal strategy for bacterium-aptamer probing (Fig. 1C). By utilizing the CRISPR-CHA system to design the "variable region" and "invariant region" of sequences, the CHA system can detect multiple pathogenic microorganisms. Specifically, partial sequences of the H1 and H2 chains were designed as "invariant regions" to generate a fixed sequence in CHA products, while the crRNA in the CRISPR system was designed based on this sequence. The other parts of the H1 and H2 chains were designed according to the aptamer and S chains corresponding to different bacteria, thereby achieving multifunctionality.
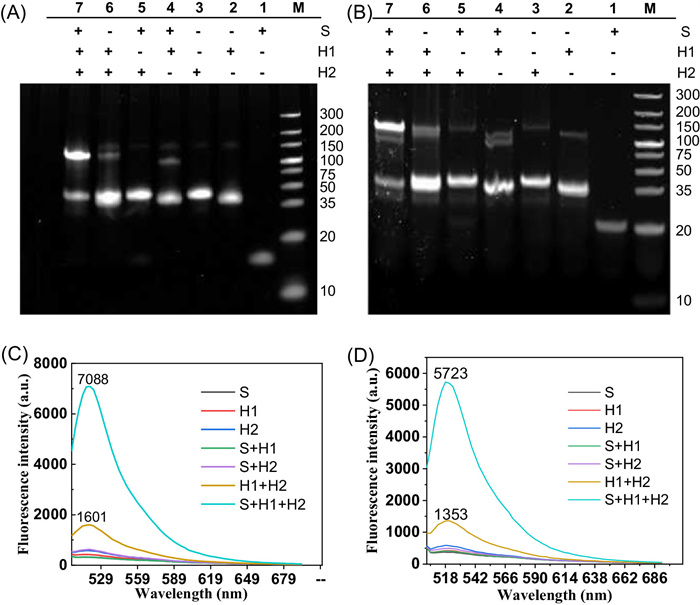
Before conducting the on-chip assay, native-PAGE experiments were performed to obtain the optimal hairpin oligonucleotides for the CHA cycling circuit. H1 and H2 were designed, and their secondary structures were predicted using NUPACK software, as shown in Fig. S2 (Supporting information). The performance of the CHA signal amplification between S, H1, and H2 was further demonstrated through native pages. The oligonucleotide sequences used in this study are shown in Table S1 (Supporting information). For the CHA experiment involving E. coli O157:H7 (Fig. 2A) and S. aureus (Fig. 2B), the upper band of the fourth lane confirms that S almost completely reacted with H1, forming an intermediate of S/H1. In the absence of H1, S and H2 coexisted stably (Lane 5). When two hairpin oligonucleotides (H1 and H2) were mixed without S, a minor amount of H1 hybrid duplex and H2 hybrid duplex (upper band of lane 6) was observed, indicating a very slight spontaneous interaction between H1 and H2. The details of the electrophoretic samples and the experimental details are shown in Table S2. However, once the initiator chain S was added, the H1 and H2 probes begin to hybridize, forming a large number of stable H1/H2 double chains (upper band of the lane 7), and S in the solution has reacted completely, demonstrating an efficient CHA cycling circuit.
Figure 2
Figure 2.
Performance of CHA and CRISPR. Gel electrophoresis analysis of CHA cycling circuit feasibility for E. coli O157:H7 (A) and S. aureus (B). All final concentration of oligos for CHA reaction were 200 nmol/L in 10 µL reaction system. The feasibility of CRISPR reaction for E. coli O157:H7 (C) and S. aureus (D).
To further validate the feasibility of the CHA reaction system, we conducted a CRISPR fluorescence assay in conjunction with non-denaturing polyacrylamide gel electrophoresis. The reaction was performed in a 20 µL fluorescence system comprising 1 µL of CHA product, 13.5 µL of DEPC water, 0.5 µL of Cas12a protease, 2 µL of 10× buffer, 2 µL of F-Q fluorescent probe, and 1 µL of crRNA. The mixture was incubated at 37 ℃ for 1 h, and fluorescence intensity was measured using a microplate reader (Tecan Infinite M1000 Pro, Männedorf, Switzerland).
The E. coli O157:H7 experimental group exhibited a fluorescence intensity ratio of approximately 4.3 against the background (Fig. 2C), while the S. aureus experimental group showed a ratio of 4.23, indicating distinct and discernible signals for both pathogens (Fig. 2D). The results indicated that the assay was capable of reliably detecting these pathogens in actual samples. The optimal reaction temperature and time of CHA were 25 ℃ and 1 h respectively, which were in accordance with the reported reference [34].
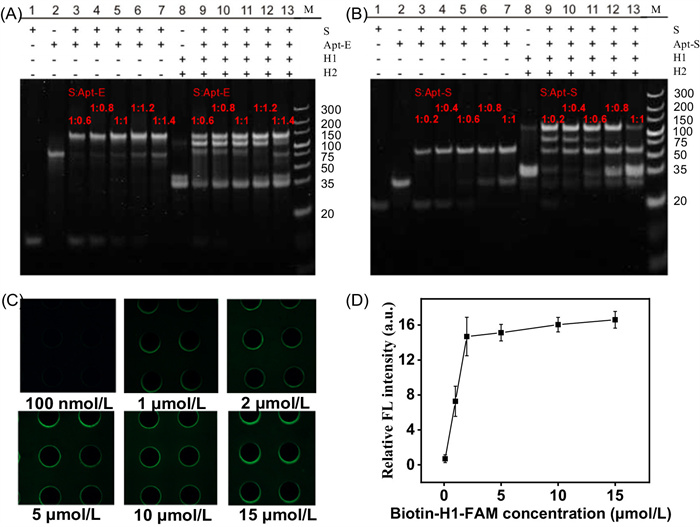
To achieve optimal detection performance for E. coli O157:H7 and S. aureus, we investigated two experimental conditions: the concentration ratio of S to aptamer and the concentration of biotin-H1 modified in microchannels. For E. coli O157:H7, we optimized the concentration ratio of S to Apt-E by preparing a range of ratios from 1:0.6 to 1:1.4, forming an S/Apt-E biphasic system. For S. aureus, we optimized the concentration ratio of S to Apt-S by preparing ratios from 1:0.2 to 1:1, forming an S/Apt-S biphasic system. As shown in the lanes 5 to 7 of Fig. 3A, when the ratio of S to Apt-E was higher than 1:1, no free S was observed in the solution. To further confirm the phenomenon, H1 and H2 were added into the above mixture solutions.
Figure 3
Figure 3.
Optimization of the biosensor. (A) The gel electrophoresis picture of the S:Apt-E concentration ratio optimization. All final concentration of oligos for nucleic acids reaction were 200 nmol/L in 10 µL reaction system. (B) The gel electrophoresis picture of the S:Apt-S concentration ratio optimization. All final concentration of oligos for nucleic acids reaction were 200 nmol/L in 10 µL reaction system. The fluorescent images of the optimization of the concentration of bio-H1 modified on microfluidic chip (C), and corresponding quantified results (D).
The results presented in lanes 9–13 indicated that the amount of H1/H2 duplex was comparable to that observed without the addition of S when the ratio of S to Apt-E was less than 1:1. This was because the excess dissociative Apt-E preferentially binds to E. coli O157:H7, thereby reducing the biosensor signal. Consequently, it was crucial to minimize the amount of dissociative Apt-E. Therefore, the optimal concentration of S to Apt-E was determined to be 1:1.4. Similarly, for S. aureus, the optimal concentration of S to Apt-S was 1:1, as shown in Fig. 3B.
To ensure complete modification of the inner surface of the channel by H1, the concentration of biotin-labeled H1 for the CHA reaction must first be investigated. A biotin-labeled H1 conjugated with a fluorescein probe (FAM) was employed to direct evaluate the modification performance using an inverted fluorescence microscope (Leica DMI 4000, Leica Microsystems Co., Ltd., Shanghai, China). The detailed modification process was displayed in Supporting information. A fluorescence image of the modified microcavity area in the microchannel with 2 μmol/L of bio-H1-FAM was shown in Fig. S3 (Supporting information). The fluorescence images of H1 concentration in actual biotin-labeled CHA reactions further proved this finding (Fig. 3C). As shown in Fig. 3D, when the concentration of biotin-H1-FAM increased from 0.1 μmol/L to 15 μmol/L, the fluorescence signal remained nearly the same at the concentration of 2 μmol/L, indicating saturated modification at this concentration. Therefore, 2 μmol/L biotin-labeled H1 was used for inner surface modification in thesubsequentt experiments.
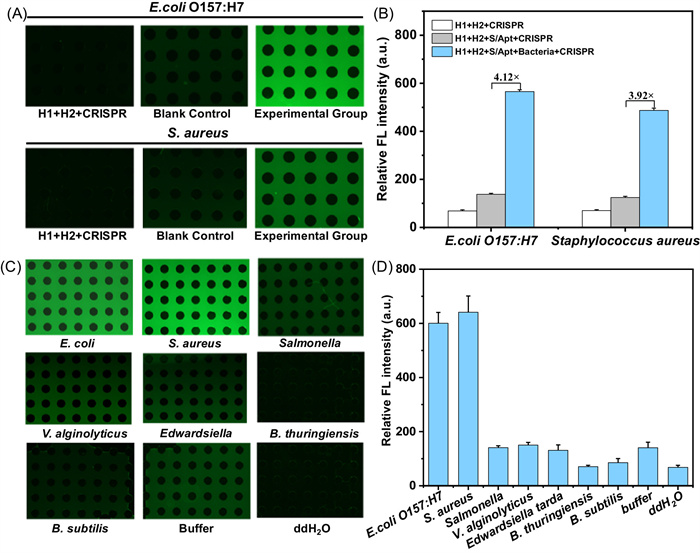
To further evaluate the feasibility and performance of the established biosensor under the optimized conditions, a buffer spiked with 1 × 10⁸ CFU/mL of E. coli O157:H7 was analyzed. The bacteria concentration determined using the calibration curve correlating OD600 with E. coli O157:H7 concentration, as depicted in Fig. S4 (Supporting information). And the concentration of S. aureus was shown in Fig. S5 (Supporting information). Control samples lacking complete CHA reagents or target bacteria were also tested. As illustrated in Figs. 4A and B, only the samples containing both bacteria and all CHA reagents exhibit strong relative fluorescence signal intensity. The fluorescence signal in the experimental group was about 4 times higher than that of the background. This was attributed to the fact that only in the presence of the target bacteria can they compete to bind to Apt-E or Apt-S, displacing the initiating chain S and triggering a multi-level signal amplification reaction, resulting in a robust fluorescence signal. In the absence of target bacteria, the chain S maintained bound to Apt-E or Apt-S, preventing multi-level signal amplification reactions. The results demonstrated that the established biosensor exhibits strong response signals and a high signal-to-noise ratio, indicating its potential for detecting E. coli O157:H7 and S. aureus.
Figure 4
Figure 4.
The feasibility and specificity of biosensor based on multiple signal amplification strategy. (A) The feasibility of fluorescence images of biosensors. (B) The feasibility of biosensor. The final concentration of S/Apt was 50 nmol/L, the initial concentration of H1 modified on chip was 2 µmol/L, while concentration of target bacteria was 1 × 10⁸ CFU/mL. (C) The specificity of fluorescence images of biosensors. (D) The specificity of the biosensor for E. coli O157:H7 and S. aureus detection, while concentration of all bacteria was 1 × 10⁸ CFU/mL. Data shown were averages plus and minus the standard deviation of three independent experiments.
To verify the specificity of the biosensor, we tested E. coli O157:H7, S. aureus, Salmonella, V. alginolyticus, Edwardsiella tarda, B. thuringiensis, and B. subtilis, all at a concentration of 1 × 10⁸ CFU/mL. Pathogen-free buffer solution and double-distilled water were used as blank controls. As shown in Figs. 4C and D, only the targets E. coli O157:H7 and S. aureus exhibited significant relative fluorescence intensity. And the relative fluorescence intensity of Salmonella, V. alginolyticus, Edwardsiella tarda, B. thuringiensis, and B. subtilis were low and negligible.
These findings indicated that the biosensor possesses the analytical capability to detect E. coli O157:H7 and S. aureus in food samples. Further, the method we developed can be extended to the detection of other foodborne pathogens.
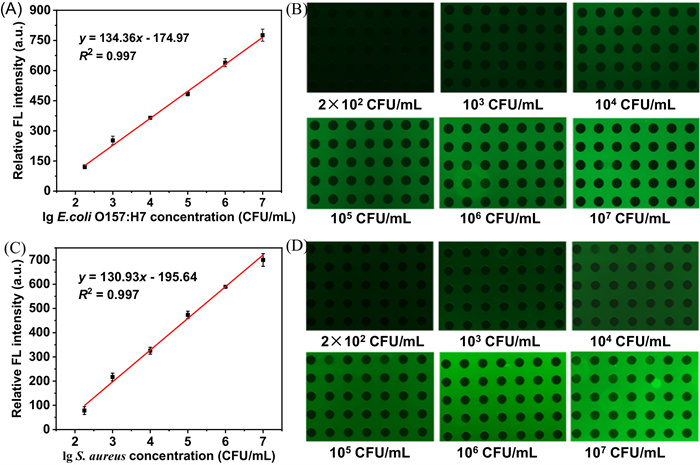
Further research was conducted to evaluate the sensitivity of the biosensor. Under optimal conditions, bacteria with concentrations ranging from 2 × 10² CFU/mL to 107 CFU/mL were detected on chip, and the corresponding working curve of relative fluorescence signal intensity was obtained. As shown in Figs. 5A and B, the relative fluorescence signal intensity of E. coli O157:H7 increased with its concentration. By plotting the logarithm of the relative fluorescence peak height (y) against the concentration (x) of E. coli O157:H7, the corresponding quantitative results were obtained. The fitting formula was y = 134.36x - 174.97, with an R2 value of 0.997. Similarly, as shown in Figs. 5C and D, the relative fluorescence signal intensity of S. aureus increased with its concentration. By plotting the logarithmic relationship between the concentration of S. aureus (x) and the corresponding relative fluorescence peak height (y), quantitative results were obtained. The fitting formula was y = 130.93x - 195.64, with an R2 value of 0.997.
Figure 5
Figure 5.
The calibration curve of the biosensor for E. coli O157:H7 detection (A), and corresponding fluorescence images at different E. coli O157:H7 concentrations (B). The calibration curve of the biosensor for S. aureus detection (C), and corresponding fluorescence images at different S. aureus concentrations (D).
As the concentration of E. coli O157:H7 and S. aureus increased in the CHA loop circuit system, the competitive binding between E. coli O157:H7 and S. aureus and Apt-E (or Apt-S) in more S/Apt-E (or S/Apt-S) being consumed and more S being released from S/Apt-E (or S/Apt-S), thereby initiating the CHA loop circuit. The production of more CHA products triggered additional CRISPR reactions, leading to an increase in the relative fluorescence signal. Each data point represented the mean of three independent experiments. For E. coli O157:H7, based on three times the standard deviation of the blank signal divided by the slope of the calibration curve, the detection limit was calculated to be 134 CFU/mL, which was lower than most reported methods [35]. Similarly, the detection limit for S. aureus was calculated to be 181 CFU/mL, which was also lower than most reported methods [36]. Therefore, the linear range for detecting E. coli O157:H7 was 134 to 107 CFU/mL, while the linear range of detection for S. aureus was 181 to 107 CFU/mL.
To evaluate the analytical reliability and application potential of our biosensor platform, three milk samples spiked with different concentrations of E. coli O157:H7 and S. aureus (2.0 × 10³, 2.0 × 10⁴, and 2.0 × 10⁵ CFU/mL) were analyzed and three independent experiments were performed. Un-spiked milk samples were as control. The results were shown in Table 1. There were no significant differences between biosensor measurement and spiked concentrations. For E. coli O157:H7, recoveries ranged from 95.0% to 115.0% (average 106.7%), and for S. aureus, recoveries ranged from 95.0% to 110.0% (average 103.3%). To demonstrate the good stability and broad applicability of our microfluidic biosensor platform, we also tested meat broth and fruit juice. In meat broth, E. coli O157:H7 recoveries ranged from 95.0% to 110.0% (average 103.3%), and recoveries of S. aureus ranged from 90.0% to 100.0% (average 95.0%). In fruit juice, E. coli O157:H7 recoveries ranged from 90.0% to 115.0% (average 103.3%), and S. aureus from 95.0% to 110.0% (average 101.7%). These results indicated that our developed biosensor had good accuracy and great potential for detecting E. coli O157:H7 and S. aureus in real samples.
Table 1
Table 1.
Detection of E. coli O157:H7 and S. aureus by the biosensor in testing matrix samples (n = 3).
In summary, we described a novel microfluidic-based biosensor for rapid, high sensitive and simultaneous detection of E. coli O157:H7 and S. aureus. Using a multiplex amplification strategy involving CHA and CRISPR reactions. Compared with previously reported biosensors, our developed method demonstrated several advantages in detecting target bacteria. Firstly, due to the designed micro column array structure and serpentine mixed channels on chip, the efficiency of CHA and CRISPR reactions had been greatly improved, enabling detection limits ranging from 134 CFU/mL to 181 CFU/mL with a broad dynamic range, using just 10 µL of sample. Secondly, the average recovery rates were 90.0% - 115.0%, indicating good detection accuracy. Thirdly, the bacterial sensing platform exhibited excellent selectivity for target bacteria, was easy to operate and enabled rapid analysis within 1.5 h. In the CRISPR-CHA system, the modular design of CHA components allowed for the use of the same crRNA to distinguish different targets, significantly reducing reagent consumption and facilitating multi-target detection of pathogenic microorganisms. A comparison of the biosensor we constructed with existing microfluidic pathogen-detecting biosensors (Table S3 in Supporting information). It can be seen that the sample volume required by our biosensor was reduced by 10- to 20-fold, and the detection limit is lowered by more than one-fold. There is no need for pre-treatment or separation, and the detection time was shortened by one-fourth. Additionally, our biosensor demonstrates superior recovery rates and better stability, indicating great potential for detection. So considering these advantages, the developed biosensor had great potential for application in the detection of foodborne pathogens.
Declaration of competing interest
The authors declare that they have no known competing financial interests or personal relationships that could have appeared to influence the work reported in this paper.
N. Aggarwal, Y. Liang, J.L. Foo, et al., Biosens. Bioelectron. 222 (2023) 115002. doi: 10.1016/j.bios.2022.115002
Figure 1
Schematic illustration of the microfluidic biosensor based on multiple signal amplification strategy for detection of E. coli O157:H7 and S. aureus. (A) Overall design diagram of the microfluidic chip. (B) The principle diagram of the multiple signal amplification strategy. (C) Schematic presentation of the versatility of CRISPR-CHA for the detection of different bacteria targets.
Figure 2
Performance of CHA and CRISPR. Gel electrophoresis analysis of CHA cycling circuit feasibility for E. coli O157:H7 (A) and S. aureus (B). All final concentration of oligos for CHA reaction were 200 nmol/L in 10 µL reaction system. The feasibility of CRISPR reaction for E. coli O157:H7 (C) and S. aureus (D).
Figure 3
Optimization of the biosensor. (A) The gel electrophoresis picture of the S:Apt-E concentration ratio optimization. All final concentration of oligos for nucleic acids reaction were 200 nmol/L in 10 µL reaction system. (B) The gel electrophoresis picture of the S:Apt-S concentration ratio optimization. All final concentration of oligos for nucleic acids reaction were 200 nmol/L in 10 µL reaction system. The fluorescent images of the optimization of the concentration of bio-H1 modified on microfluidic chip (C), and corresponding quantified results (D).
Figure 4
The feasibility and specificity of biosensor based on multiple signal amplification strategy. (A) The feasibility of fluorescence images of biosensors. (B) The feasibility of biosensor. The final concentration of S/Apt was 50 nmol/L, the initial concentration of H1 modified on chip was 2 µmol/L, while concentration of target bacteria was 1 × 10⁸ CFU/mL. (C) The specificity of fluorescence images of biosensors. (D) The specificity of the biosensor for E. coli O157:H7 and S. aureus detection, while concentration of all bacteria was 1 × 10⁸ CFU/mL. Data shown were averages plus and minus the standard deviation of three independent experiments.
Figure 5
The calibration curve of the biosensor for E. coli O157:H7 detection (A), and corresponding fluorescence images at different E. coli O157:H7 concentrations (B). The calibration curve of the biosensor for S. aureus detection (C), and corresponding fluorescence images at different S. aureus concentrations (D).

 DownLoad:

 下载:
下载:


 下载:
下载:
