Received Date:
23 February 2025 Accepted Date:
27 April 2025 Revised Date:
20 April 2025 Available Online:
15 August 2026
Abstract:
Self-trapped exciton (STE) emissions based on Sb3+ ion materials have recently received widespread attention, due to the excellent photoluminescence (PL) properties and stereochemical activity of Sb3+ ions. Pressure can precisely regulate the electronic structure and configuration of chromophores, becoming an effective approach to enhance the STE emissions. Recently, STE emission enhancements in Sb3+-based materials under pressure mainly focus on metal halides, however, studies on inorganic oxides are very limited. Herein, the high-pressure STE behavior of SbTaO4 was investigated up to 13.2 GPa. The STE emission exhibits a bi-peak feature, and the strongest emission occurs at 3.8 GPa, in which two peaks are enhanced by ~20 and ~3 times and the STE emission displays a bright green color. The mechanism is explained using a variety of methods, including steady-state PL spectroscopy, kinetic spectroscopy, Raman spectroscopy, cryogenic PL spectroscopy and theoretical calculations. It shows that the strong electron-phonon coupling of SbTaO4 is weakened, which suppresses non-radiative transitions. Also, the distortion of the [SbO4] unit inhibits the transition between two STE states. The synergistic effect of these factors leads to a strong enhancement of the STE emission in SbTaO4 under pressure. The STE emission enhancement of SbTaO4 highlights the potential of inorganic oxides for future high-pressure STE exploration and provides the promising material in photonic devices under extreme conditions.
Self-trapped exciton (STE) emission has garnered significant attention due to its unique photoluminescence (PL) properties and potential applications in phosphors, light-emitting diodes, and scintillators [1–4]. STE emissions typically arise in systems with strong electron-phonon coupling, where lattice distortions caused by excited electrons and holes rapidly trap them in lower-energy self-trapped states, as opposed to free carrier states [5–8]. Recently, the STE emission phenomenon is widely observed in ns² metal ion-based material systems, in which the lone-pairs electrons (LPEs) of ns2 metal ion are generally stereochemically active [9,10]. Among the various ns2 metal ion-based materials, those containing Sb3+ ions are particularly promising [11–13]. The 5s2 LPEs of Sb3+ ions not only offer broad-band emission and large Stokes shifts, which can avoid self-absorption effectively, but also exhibit remarkable chemical reactivity, attributed to their stereochemical activity and structural flexibility [14–16]. Furthermore, Sb3+ ions are recognized for their tunable blue, green, and red luminescence, positioning them as low-toxicity, highly stable candidates for a wide range of optical applications [17–19]. Currently, research on Sb3+-based STE emission materials is primarily focused on metal halides systems, attributed to factors such as their flexible lattice structure and strong electron-phonon coupling [11,14,20–23]. However, compared to metal halides, inorganic oxides possess higher physical and chemical stability, yet the exploration of Sb3+-based inorganic oxides remains relatively limited.
Precise structural modulation offers an effective approach to optimizing the STE emissions of materials [11,24,25]. Compared to introducing chemical pressure via doping within the crystal structure, applying external pressure provides a more direct method to influence the chromophores [26–29]. Previous reports have investigated significant STE emission enhancements through pressure-tuning the coordination environment of the chromophores in low-efficiency PL materials [30–35]. The presence of LPEs in Sb3+ ions causes an unsaturated coordination environment, imparting significant flexibility to the forming coordination polyhedra. Recently, pressure-induced distortion of Sb3+-based polyhedra in low-dimension hybrid metal halides have been an effective strategy to obtain high-intensity and variable-energy STE emissions [16,36,37]. Relatively, in Sb3+-based inorganic oxide system, many materials exhibit significant electron-phonon coupling [38–40]. Pressure can be used as a means to modulate the electron-phonon coupling and the coordination environment, further influencing their STE emissions. Based on the scarcity of research on Sb3+-based inorganic oxides, it is worth exploring the evolution of the STE emissions under pressure.
SbTaO4 is a polar material [41,42], in which Sb3+ ions exhibit stereochemical activity, and is potentially capable of the STE behavior. Combined with high-pressure technology, the phenomenon of pressure-driven STE emission enhancement in SbTaO4 was reported. Under ambient condition, SbTaO4 exhibits weak singlet STE emission, and this STE emission is enhanced up to ~20 times under pressure, which shows the strong green emission. Multiple in situ high-pressure techniques, including steady-state PL spectroscopy, kinetic transient absorption spectroscopy, local structure analysis, have been employed to reveal the mechanism of the emission enhancement, which is caused by the suppression of non-radiative transitions and the hindered transition between two STE states. The discovery of the strong STE emission enhancement in SbTaO4 shed light on the future high-pressure exploration of the STE emissions in inorganic oxides, and provide potential materials for precision photonic devices under high pressure.
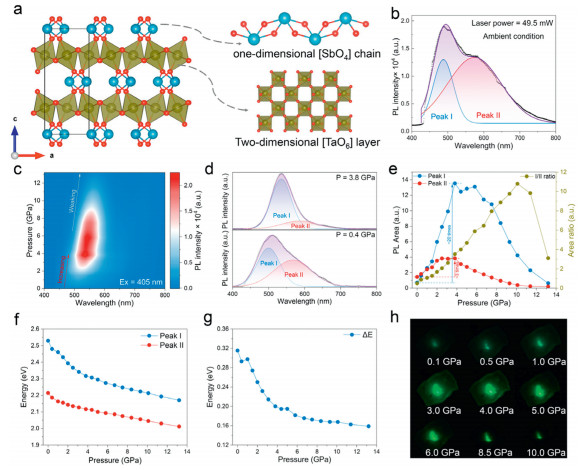
SbTaO4 crystallizes in the polar space group Pbn21, featuring two types of distorted polyhedra: the LPE [SbO4] unit and the second-order Jahn-Teller [TaO6] polyhedron (Fig. 1a). The LPE [SbO4] units connect through edge-sharing to form one-dimensional chains, while the [TaO6] polyhedra connect through vertex-sharing to create a two-dimensional layer. These two structures alternate, forming the three-dimensional crystal structure of SbTaO4. Powder sample of SbTaO4 was obtained through high-temperature solid-state reaction under vacuum condition, with its purity confirmed by X-ray diffraction analysis (Fig. S1a in Supporting information). Scanning electron microscopy (SEM) revealed that the particle size of the powder sample was approximately 500 nm (Fig. S1b in Supporting information). Energy dispersive X-ray spectroscopy indicated that the atomic ratio of Sb, Ta, and O was 1.05:1:4.4, aligning well with the expected stoichiometry (Fig. S2 in Supporting information). In addition, X-ray photoelectron spectroscopy was performed to verify the oxidation states of Sb and Ta atoms (Fig. S3 in Supporting information). Characteristic peaks at 530.60 and 26.50 eV were attributed to Sb3+ 3d5/2 and Ta5+ 4f7/2, respectively, consistent with the proposed structural model. Recently, LPE Sb3+ ions have been generally introduced into crystal structures to achieve materials with excellent PL properties due to their ability to produce the STE emission. Polar materials often exhibit strong electron-phonon coupling effects, which result in significant non-radiative transitions and establish weak PL efficiency. Therefore, the polar material SbTaO4 is anticipated to exhibit novel PL phenomena through pressure modulation.
Figure 1
Figure 1.
(a) Crystal structure of SbTaO4. (b) The PL spectrum using the excitation at 405 nm with the laser power of 49.5 mW under ambient condition. (c) Pressure-dependent pseudo-color PL spectra using the excitation at 405 nm under room temperature. (d) The PL spectra under 0.4 GPa and 3.8 GPa. (e) The area evolutions of peak Ⅰ and peak Ⅱ under pressure. (f) Energy evolutions of the peak Ⅰ and peak Ⅱ emissions. (g) The energy difference (ΔE) between the peak Ⅰ and peak Ⅱ emissions. (h) Selected high-pressure optical micrographs using the excitation at 405 nm.
SbTaO4 has been reported to exhibit broad PL emission at low temperatures, which also indicates that SbTaO4 shows no PL emission at room temperature [43]. In this paper, the high-intensity lasers were used as the excitation lights to observe the PL emission behavior at room temperature and conducted investigations under pressure. Using lasers with wavelengths of 375 and 405 nm to excite powder SbTaO4, respectively, it was found that both broad PL emissions exhibited in the range of 400−800 nm (Fig. 1b and Fig. S4 in Supporting information). The position and shape of two PL emissions basically remain unchanged regardless of the variation in the excitation light energy, which is a characteristic of the STE emission mechanism [16]. Meanwhile, it was observed that the PL emission exhibited bi-peak characteristics. By employing Gaussian fitting, the PL emission excited by 405 nm laser was processed into two independent peaks Ⅰ and Ⅱ. The positions of two peaks are 488 and 574 nm, respectively, and all process broad full-widths at half-maximum (FWHM) of 0.34 and 0.67 eV, according to the different emission energy, peak Ⅰ and peak Ⅱ emissions can be attributed to the transitions of high-energy self-trapped exciton (HP STE) and low-energy self-trapped exciton (LP STE), respectively. Such large Stokes shifts and broad FWHMs confirm that the PL emission of SbTaO4 belongs to the STE emission mechanism. In addition, power-dependent PL measurements were also performed (Fig. S5 in Supporting information), which showed that the peak intensity of peak Ⅰ and peak Ⅱ exhibits a linear relationship with the laser power, excluding the mechanism of permanent defect emissions [16,44,45].
High-pressure PL property studies on SbTaO4 revealed a significant PL enhancement phenomenon using 405 nm laser as excitation light source (Fig. 1c and Fig. S6 in Supporting information). Totally, the PL emission process can be divided into three stages: (1) The PL emission rapidly increased within the range of 0−3.8 GPa; (2) The PL emission remained stable within the range of 3.8−5.8 GPa; (3) The PL emission continuously weakened within the range of 5.8−13.2 GPa. As the bi-peak characteristic of the STE emission, the evolutions of peak Ⅰ and peak Ⅱ were also investigated in detail by Gaussian fitting. As shown in Fig. 1d, under low pressure, peak Ⅱ is dominant in the whole PL emission. With pressure increasing, peak Ⅰ emission increases faster, gradually surpassing peak Ⅱ and becoming dominant. The evolution trend is quantified by the statistic of the PL peak areas and area ratio (Fig. 1e). It can be observed that the areas of peak Ⅰ and peak Ⅱ both undergo a process of first increasing and then decreasing. The maximum enhancement occurs at 3.8 GPa which is ~20 times and ~3 times for peak Ⅰ and peak Ⅱ, respectively. The area ratio of peak Ⅰ to peak Ⅱ increases from 0.5 at ambient pressure to 10.8 at 10.1 GPa, which indicates that the emission process of peak Ⅰ is more promoted compared to peak Ⅱ. In addition, the energy evolution of peak Ⅰ and peak Ⅱ was also analyzed, and it was observed that the energy difference (ΔE) between peak Ⅰ and peak Ⅱ was continuously decreasing (Figs. 1f and g). This phenomenon implied the lifted degeneracy of two emission states, which should be attributed to the increased trapping barrier between two emission states [16]. The increased trapping barrier hindered the transition of excitons from HP STE to LP STE, leading to more excitons transitioning from HP STE to the ground state, which is the potential reason for the significant enhancement of peak Ⅰ under pressure. The hindrance of exciton transition will be further discussed later. The PL micrographs (Fig. 1h), intuitively displays the PL emission evolution. It clearly displays that SbTaO4 exhibits the green emission and experiences the process of the PL emission from enhancement, stability to weakening. The PL spectrum after pressure release was also collected, revealing that the PL intensity of SbTaO4 after pressure release is slightly weaker than that before pressurization (Fig. S7 in Supporting information). This can be attributed to the reduction of the crystallinity caused by pressure during the compression process.
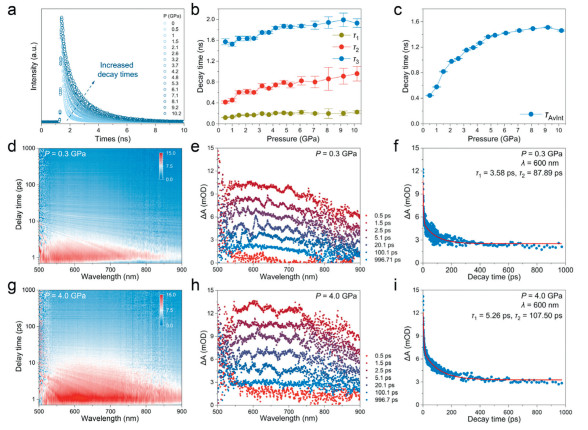
To further understand the PL emission mechanism of SbTaO4, high-pressure time-resolved PL decay measurements were performed (Figs. 2a−c). The high-pressure decay curves can be fitted well by three-index exponential function, I(t) = I(0)·[A1·exp(−t/τ1) + A2·exp(−t/τ2) + A3·exp(−t/τ3)], and the average lifetimes τAvInt were also obtained according to the function τAvInt = [A1τ12 + A2τ22 + A3τ32]/[A1τ1 + A2τ2 + A3τ3]. The nanosecond-scale time of the PL emission indicates that the transition mode is a singlet-to-ground state transition process, which is the 1P1−1S0 transition due to spin-orbit coupling in Sb3+ ions [11]. The singlet lifetime of SbTaO4 is shorter than the most reports of singlet Sb3+ states, which usually have the lifetimes on the order of 10 ns, while it can be compared with the Sb3+-coordination complex, [Sb2O(PDC)2(H2O)2], in which its lifetime of singlet emission is considered to be 3.2 ns [46]. Under pressure, the average lifetimes τAvInt initially increases rapidly, and then the rate of increase slows down around 4.2 GPa, finally stabilizing at about 1.5 ns. The increase in τAvInt is due to the fact that all three lifetimes (τ1, τ2, τ3) exhibit an increasing trend under pressure. Totally, the evolution of the PL decay times can be caused by the factors [47,48], such as non-radiative transitions, excited-state structural evolutions, which will be further discussed by the following measurements.
Figure 2
Figure 2.
(a) PL decay time curves under pressure. (b) Decay time evolutions of τ1, τ2, τ3. (c) Pressure dependence of the average dacay times τAvInt. (d) Pseudo-color TA plot under 0.3 GPa. (e) The selected TA spectra. (f) Decay dynamics probed at 600 nm. (g) Pseudo-color TA plot under 4.0 GPa. (h) The selected TA spectra. (i) Decay dynamics probed at 600 nm.
High-pressure femtosecond transient absorption (TA) spectroscopy of SbTaO4 was also employed to further analyze the evolution of STE emission under pressure (Figs. 2d−i). With 405 nm laser excitation, a broad positive photo-induced absorption was observed among the wavelength of 500−900 nm for SbTaO4 under 0.3 and 4.0 GPa, respectively, which is the characteristic of the STE emission [49,50]. Comparing the TA spectra, it can be clearly observed that the positive photo-induced absorption enhanced under pressure and the decay times at 4.0 GPa became longer than that at 0.3 GPa. Furthermore, the decay times at 600 nm were fitted using the two-index exponential function. The lifetimes at 4.0 GPa (τ1 = 5.26 ps, τ2 = 107.50 ps) are consistently longer than lifetimes (τ1 = 3.58 ps, τ2 = 87.89 ps) at 0.3 GPa. The longer lifetimes of SbTaO4 under pressure imply the increased radiative recombination and suppressed non-radiative process in SbTaO4, referred to inorganic halide double perovskites that achieve the STE emission enhancement by cation doping [51].
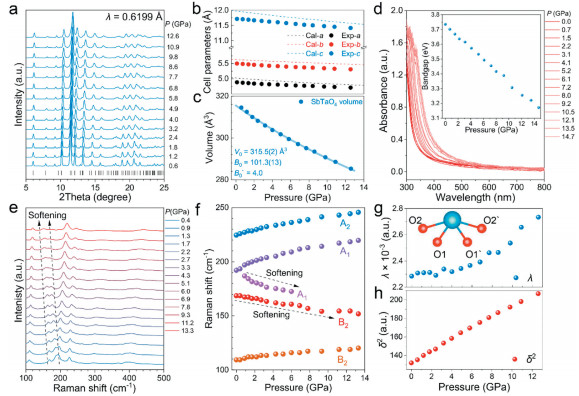
High-pressure synchrotron powder XRD was applied to determine the lattice evolution of SbTaO4 up to 12.6 GPa (Figs. 3a−c). High-pressure powder XRD patterns can be well indexed to SbTaO4, except for the peak around 9.1°. The impurity peak can be attributed to Ta2O5 (PDF #01–071–0639), which will not affect the optical property measurements. During compression, all Bragg diffraction peaks moved to the high-angle region, and no new Bragg diffraction peak emerged in the high-pressure XRD patterns, which indicated that the lattice of SbTaO4 continues to shrink under this pressure region and no phase transition occurred. The evolution of cell parameters was also obtained by Lebail refinement, which demonstrated that the axial lengths a, b, and c, as well as the cell volume, continuously decrease under pressure. The cell volume was fitted to a second-order Birch-Murnaghan equation of state, in which V0 = 315.5(2) Å3, B0 = 101.3(13) GPa. The bulk modulus B0 of SbTaO4 is lower than that of the α-phase Sb2O4 (B0 = 143 GPa) and is compared to that of the β-phase Sb2O4 (B0 = 145 GPa) [52], which own the similar crystal structures with SbTaO4. High-pressure UV–vis absorption measurements were also executed to evaluate the absorption property and bandgap change up to 14.7 GPa (Fig. 3d and Fig. S8 in Supporting information). The absorption edge of SbTaO4 exhibited a red shift during the compression process. Band gap shrinkage was also discovered, as band gap was reduced by ~15% from 3.73 eV (ambient condition) to 3.17 eV (14.7 GPa), indicating a large pressure response on the electronic structure of SbTaO4. High-pressure Raman measurement was also conducted up to 13.3 GPa (Fig. 3e). Raman peaks within the range of 100−500 cm−1 were prominently highlighted. These peaks can be identified as lattice vibrational modes. Additionally, pressure dependence of the Raman peak positions was displayed, and assignments were made for five strong peaks (Fig. 3f). It is noteworthy that softening phenomena occurs at the Raman peaks at 168.6 cm−1 (B2) and 186.9 cm−1 (A1), with rates of −1.3 cm−1/GPa and −2.7 cm−1/GPa, respectively. The vibrational modes of two softened peaks were visualized by first principles calculation (Fig. S9 in Supporting information), which demonstrated the lattice vibrations predominantly influenced by the LPE [SbO4] unit. The softening phenomenon of Raman peaks suggests the distortion of the lattice in SbTaO4 under pressure. The structural distortion of chromophores under pressure facilitates the formation of new STE states and modulates the relative intensities of different STE emissions, as reported in zero-dimensional metal halides [16,53].
Figure 3
Figure 3.
(a) High-pressure XRD patterns. (b) Calculated and experimental cell parameters as a function of applied pressure. (c) Pressure dependence of cell volumes and the second-order Birch-Murnaghan equation of state fitting. (d) High-pressure evolutions of absorption spectra and bandgaps. (e) High-pressure Raman patterns. (f) Pressure dependence of the Raman peak positions. High-pressure evolution of (g) bond-length deviation of λ and (h) bond-angle deviation of δ2 using geometry optimization.
Furtherly, combined with first-principles calculations, geometry optimization of SbTaO4 under selected pressure was executed. Geometry optimization was adopted full relaxation method and equipped the initial structural model at ambient condition as the template for pressure calculation. Since the PL emission of SbTaO4 originates from the 1P1−1S0 transition mode in the LPE [SbO4] unit, the evolution of the [SbO4] unit after geometry optimization is focused. By extracting the Sb−O bond length and O−Sb−O bond angle of the [SbO4] unit and quantifying the LPE [SbO4] unit, two parameters of bond-angle deviation (δ2) and bond-length deviation (λ) are calculated (Figs. 3g and h, Table S1 in Supporting information). Both increasing δ2 and λ imply the enhanced distortion of the LPE [SbO4] unit under pressure, which matches well with the pressure-driven softening phenomenon of Raman peaks. The enhanced distortion of the LPE [SbO4] unit has remarkable impacts on excited-state distortion, which will hinder the transition process from HP STE to LP STE, causing the enhancement of HP STE transition become faster than that of LP STE transition [16]. This is also the reason why the area ratio of peak Ⅰ to peak Ⅱ continuously increase.
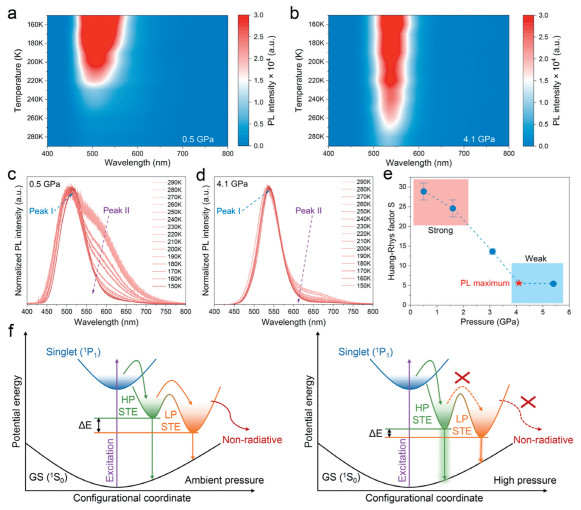
Cryogenic PL spectra measurements under pressure were conducted at five pressure points: 0.5, 1.6, 3.1, 4.1, and 5.4 GPa, with the temperature ranging from 290 K to 150 K. Figs. 4a and b, Figs. S10a−c (Supporting information) point out that, as the temperature decreases, the intensity of the PL emission continuously enhances. The PL enhancement can be attributed to the characteristics of STE emission, where the low temperature suppresses non-radiative transitions, thereby promoting the PL emission. The cryogenic PL spectra at the five different pressure points are also normalized to further observe the evolutions of the PL emission (Figs. 4c and d, Figs. S10d−f in Supporting information). As the temperature decreases, the proportion of peak Ⅱ in the overall PL emission gradually diminishes. This indicates that low temperature inhibits the transition from singlet HP STE to singlet LP STE, similar to the effect of pressure. Furthermore, Gaussian fitting is performed to analyze the FWHM of peak Ⅰ, in order to understand the evolutions in electron-phonon coupling in SbTaO4 under pressure. Electron-phonon coupling was obtained by the relationship between FWHM of peak Ⅰ spectra according to the formula: FWHM = 2.36Sℏωcoth(ℏω/2kT), where ω is phonon frequency, ℏ is reduced Planck constant, T is temperature, and k is Boltzmann constant. Based on this formula, Huang-Rhys factor S can be obtained (Fig. 4e and Fig. S11 in Supporting information), which reflects the strength of electron-phonon coupling of the material. At near atmospheric pressure (0.5 GPa), the Huang-Rhys factor S value of SbTaO4 is 28.87. The large S implies strong electron-phonon coupling effect in SbTaO4, which is the reason of broad PL emission, and the large S is comparable to those of halide perovskites and the recently reported ZnO nanocrystals [54,55]. Under pressure, the S value first decreases rapidly, and then remains stable at a lower value at 4.1 and 5.4 GPa. The weakening of Huang-Rhys factor S indicates the weakening of the electron-phonon coupling in SbTaO4, which will lead to the suppression of non-radiative transitions in the transition process [55]. The inhibition of non-radiative transitions can also be demonstrated by the increased lifetimes of SbTaO4 under pressure. Therefore, the inhibition of non-radiative transitions becomes another reason for the enhancement of PL emission in SbTaO4.
Figure 4
Figure 4.
(a, b) Temperature-dependent pseudo-color PL spectra under 0.5 and 4.1 GPa. (c, d) Normalized temperature-dependent PL spectra. (e) High-pressure evolution of the Huang-Rhys factor S. (f) Illustration of the STE emission mechanism upon compression.
Finally, two factors dominate the enhancement of the STE emission in SbTaO4 under pressure: (1) The suppression of non-radiative transitions, and (2) the hindered transition from HP STE to LP STE. Fig. 4f clarifies the mechanism behind the bright PL emission of SbTaO4 under pressure. At ambient pressure, due to the presence of self-trapped states within SbTaO4, excitons drop from the free energy level (1P1) to self-trapped energy levels. At this time, because of the strong electron-phonon coupling in SbTaO4, most of the energy is dissipated through non-radiative transitions and few of excitons return to the ground state (1S0) via HP STE and LP STE states, emitting weak green light. At high pressure, the electron-phonon coupling effect in SbTaO4 weakens, leading to the suppression of non-radiative transitions. Consequently, more excitons opt to transition back to the ground state (1S0) via HP STE and LP STE states, which leads the enhancement of these PL emissions. Furthermore, the distortion of the LPE [SbO4] units become stronger under pressure. This phenomenon reduces the energy difference (ΔE) between HP STE and LP STE states and then increases the barrier of excitons transitioning from HP STE to LP STE states, which hinders this transition process. These two factors cause the HP STE emission to be stronger than that of LP STE, resulting in bright green emission of SbTaO4 under pressure. It was also observed that as the pressure continues to increase (5.8−13.2 GPa), the intensity of the PL emission weakens. This is because pressure reduces the crystallinity of the sample, further suppressing the PL emission. This factor competes with the two PL-enhanced mechanisms mentioned above, and when the suppression of PL emission by pressure dominates, the PL emission weakens or even disappears [56].
In summary, SbTaO4 exhibited a strong enhancement of the STE emission under pressure, and the bright green emission was achieved. The STE emission exhibited bi-peak characteristics, which can be split to HP STE (peak Ⅰ) emission and LP STE (peak Ⅱ) emission according to the energy difference. High-pressure time-resolved PL decay measurement revealed that the STE emission was caused by the 1P1−1S0 transition in Sb3+ ions. The STE emission enhancement reached its maximum at 3.8 GPa, with peak Ⅰ increasing ~20 times and peak Ⅱ increasing ~3 times. The enhancement mechanism was explained by detailed high-pressure in situ measurements, including TA spectroscopy, Raman spectroscopy, cryogenic PL spectra and first-principles calculations. The STE emission enhancement can be attributed to the synergistic effects of two factors, i.e., the suppression of non-radiative transitions and the hindered transition from HP STE to LP STE states. The weakening of the electron-phonon coupling suppresses non-radiative transitions, which enhances the whole PL emission. In addition, the distortion of the LPE [SbO4] units hinders the transition from HP STE to LP STE states, which causes the enhancement of peak Ⅰ is faster compared to peak Ⅱ. The significant enhancement of STE emission in SbTaO4 opens new avenues for high-pressure studies of STE emissions in inorganic oxides and highlights potential materials for advanced photonic devices operating under high-pressure conditions.
Declaration of competing interest
The authors declare that they have no known competing financial interests or personal relationships that could have appeared to influence the work reported in this paper.
CRediT authorship contribution statement
Dequan Jiang: Writing – original draft, Methodology, Data curation, Conceptualization. Long Zhang: Methodology, Conceptualization. Chen Li: Methodology. Ke Liu: Methodology. Yingying Ma: Methodology. Hao-Ming Cheng: Methodology. Tianyao Pei: Methodology. En Chen: Methodology. Jianbo Zhang: Methodology. Ting Wen: Methodology. Yang Ding: Supervision. Yonggang Wang: Writing – review & editing, Supervision, Funding acquisition.
Acknowledgments
This work was supported by the Major Program of the National Natural Science Foundation of China (No. 22090041), the National Natural Science Foundation of China (Nos. 52073003, 12204189), the Postdoctoral Fellowship Program of CPSF (No. GZC20230104) and the China Postdoctoral Science Foundation (No. 2023M730028). High-pressure XRD data were collected at the BL15U1 beamline of the Shanghai Synchrotron Radiation Facility (SSRF), Shanghai, China.
Supplementary materials
Supplementary material associated with this article can be found, in the online version, at doi:10.1016/j.cclet.2025.111264.
H. Luo, S. Guo, Y. Zhang, et al., Adv. Sci. 8 (2021) 2100786. doi: 10.1002/advs.202100786
[56]
L. Zhang, L. Wu, K. Wang, B. Zou, Adv. Sci. 6 (2019) 1801628. doi: 10.1002/advs.201801628
Figure 1
(a) Crystal structure of SbTaO4. (b) The PL spectrum using the excitation at 405 nm with the laser power of 49.5 mW under ambient condition. (c) Pressure-dependent pseudo-color PL spectra using the excitation at 405 nm under room temperature. (d) The PL spectra under 0.4 GPa and 3.8 GPa. (e) The area evolutions of peak Ⅰ and peak Ⅱ under pressure. (f) Energy evolutions of the peak Ⅰ and peak Ⅱ emissions. (g) The energy difference (ΔE) between the peak Ⅰ and peak Ⅱ emissions. (h) Selected high-pressure optical micrographs using the excitation at 405 nm.
Figure 2
(a) PL decay time curves under pressure. (b) Decay time evolutions of τ1, τ2, τ3. (c) Pressure dependence of the average dacay times τAvInt. (d) Pseudo-color TA plot under 0.3 GPa. (e) The selected TA spectra. (f) Decay dynamics probed at 600 nm. (g) Pseudo-color TA plot under 4.0 GPa. (h) The selected TA spectra. (i) Decay dynamics probed at 600 nm.
Figure 3
(a) High-pressure XRD patterns. (b) Calculated and experimental cell parameters as a function of applied pressure. (c) Pressure dependence of cell volumes and the second-order Birch-Murnaghan equation of state fitting. (d) High-pressure evolutions of absorption spectra and bandgaps. (e) High-pressure Raman patterns. (f) Pressure dependence of the Raman peak positions. High-pressure evolution of (g) bond-length deviation of λ and (h) bond-angle deviation of δ2 using geometry optimization.
Figure 4
(a, b) Temperature-dependent pseudo-color PL spectra under 0.5 and 4.1 GPa. (c, d) Normalized temperature-dependent PL spectra. (e) High-pressure evolution of the Huang-Rhys factor S. (f) Illustration of the STE emission mechanism upon compression.


 DownLoad:

 下载:
下载:


 下载:
下载:

