College of Chemistry, Zhengzhou University, Zhengzhou 450001, China
b.
Shandong Provincial Key Laboratory of Detection Technology for Tumor Markers, College of Chemistry and Chemical Engineering, Linyi University, Linyi 276000, China
Received Date:
07 January 2025 Accepted Date:
15 April 2025 Revised Date:
13 April 2025 Available Online:
15 April 2026
Abstract:
Ferroptosis has emerged as a significant pathway in various pathological conditions. Studying the effects of inhibiting ferroptosis on liver injury is instrumental in gaining a deeper understanding of the mechanisms. This study the design and synthesis of a multi-channel near-infrared emitting fluorescent probe TXVQ. When the probe TXVQ responds to HSO3−, the fluorescence intensity at 500 nm of TXVQ increases with the addition of HSO3−. As the concentration of H2O2 increases, the fluorescence intensity of TXVQ at 600 nm is enhanced. Concurrently, as viscosity rises, the fluorescence intensity of the probe TXVQ at 725 nm will gradually increase. The probe TXVQ, with its ability to monitor HSO3−, H2O2 and viscosity through three distinct fluorescent channels, is advantageous for its application in the biological field. Subsequently, cellular experiments have demonstrated that the probe TXVQ can monitor changes in intracellular HSO3−, H2O2 and viscosity. At the cellular level, it is found that inhibiting ferroptosis had no alleviating effect on drug-induced liver injury (DILI), but it had a certain alleviating effect on acute kidney injury (AKI). In a murine model, the effects of ferroptosis inhibition on DILI and AKI indicate that inhibiting ferroptosis reduced kidney injury but not liver injury, highlighting its potential in kidney therapeutics. TXVQ can detect various levels of HSO3−, H2O2 and viscosity through three different fluorescent channels, making it a powerful tool for diagnosing and treating kidney diseases, as well as deepening the understanding of the role of ferroptosis in liver and kidney pathologies.
Intracellular redox imbalances, often characterized by the disruption of the Fe2+/Fe3+ redox pair, are implicated in the etiology and progression of diseases such as atherosclerosis, liver disease, kidney disease, Alzheimer's disease, and cancer [1]. Iron, while necessary for health, can become detrimental when accumulated in excess, leading to oxidative stress and tissue damage [2,3]. Ferroptosis, a form of cell death characterized by reactive oxygen species (ROS) accumulation, lipid peroxidation, and amino acid metabolism, is a particularly intriguing manifestation of redox imbalance [4]. This process is intricately regulated by a complex network of factors, affecting functional units rather than causing random damage to individual cells. ROS are integral to the physiological processes of living organisms, playing crucial roles in signal transduction, cellular immunity, and resistance to pathogens [5]. Their significance extends into the realm of medicine, where ROS are recognized as biomarkers for various diseases, such as neurodegenerative disorders, atherosclerosis, ferroptosis, inflammation, and cancer [6]. Concurrently, the viscosity level is a pivotal physiological parameter influencing biomolecular interactions, signaling, substance transfer, and the diffusion of active metabolites, thereby playing a significant role in the assessment of physical health [7]. Reactive sulfur species (RSS) also contribute to the complex landscape of reactive species [8]. Notably, HSO3− has been strongly associated with cardiovascular disease, ferroptosis, and numerous neurological disorders [9]. Maintaining a dynamic balance of oxidants and reductants at physiological levels is essential for preserving good health. Although many fluorescent probes for RSS, ROS and viscosity have been reported, most of them are single-parameter probes or dual-parameter probes with overlapping detection channels, which is not conducive to the application of probe molecules in biological monitoring [10]. Multi-channel fluorescent probe technology in bioimaging offers the advantage of detecting multiple target parameters and responding to various fluorescence wavelengths simultaneously, enhancing the sensitivity and specificity of biological detection [11,12]. This technology allows for the simultaneous visual tracking of different molecular events, such as RSS, ROS and viscosity, which often occur concurrently in biological processes.
Liver injury and kidney injury are two common diseases of the liver and kidneys. Current treatment methods mainly include drug therapy and surgical treatment. However, these two methods have disadvantages such as long treatment duration and severe postoperative complications. In comparison, inhibiting ferroptosis for treating kidney injury can more precisely target kidney diseases related to iron metabolism, and can also protect kidney cells via reducing oxidative stress [13,14]. Nevertheless, there are several challenges associated with the application of ferroptosis inhibition for kidney injury treatment including the specificity, safety, and potential side effects of ferroptosis inhibitors [15,16].
Recent studies have highlighted the potential of targeting ferroptosis for the treatment of liver diseases, including metabolic associated fatty liver disease (MAFLD) [17], hepatocellular carcinoma (HCC) [18], as well as acute kidney injury (AKI) [19]. In AKI, the inhibition of ferroptosis has been suggested as a potential therapeutic strategy [20]. Preclinical studies have demonstrated that targeting ferroptosis pathways, such as the glutathione peroxidase 4 (GPX4) pathway, can protect against kidney injury [21]. The use of a ferroptosis inhibitor (ferrostatin-1 (Fer-1)) has been shown to mitigate kidney ischaemia-reperfusion injury through the modulation of H2O2 and glutathione (GSH) overreactivity [22]. Yin et al. discovered that at the tissue level, Fer-1 attenuated fatty liver, indicating a strong correlation between ferroptosis and damage to the liver and kidneys, though the precise effects of inhibiting ferroptosis on these injuries remain unclear [23]. The inhibition of ferroptosis presents a novel approach to mitigating liver and kidney injuries, with ongoing research focusing on elucidating the underlying mechanisms and identifying potential therapeutic targets [24].
The triphenylamine fluorophore, with its propeller-like structure, serves not only as a strong electron donor but also as a potential aggregation-induced emission (AIE) framework [25]. This characteristic holds great potential in the design of fluorescent probes that require high sensitivity and selectivity for detecting specific analytes. Furthermore, triphenylamine derivatives are known for their ease of structural modification. They can be functionalized through simple reactions, such as condensation and metal coupling reactions, with various substituents like aldehyde, amino, boronic acid, halogen, and alkynyl groups [26]. This flexibility in structural modification allows for the fine-tuning of the probe's properties to achieve the desired sensitivity and specificity for the target analyte. Finally, we have synthesized a series of fluorescent sensors TXVP, TXVT and TXVQ, based on triphenylamine derivatives and selected the most effective TXVQ to monitor changes in HSO3−, H2O2 and viscosity to assess the impact of inhibiting ferroptosis on liver and kidney injury (Scheme 1).
Scheme 1
Scheme 1.
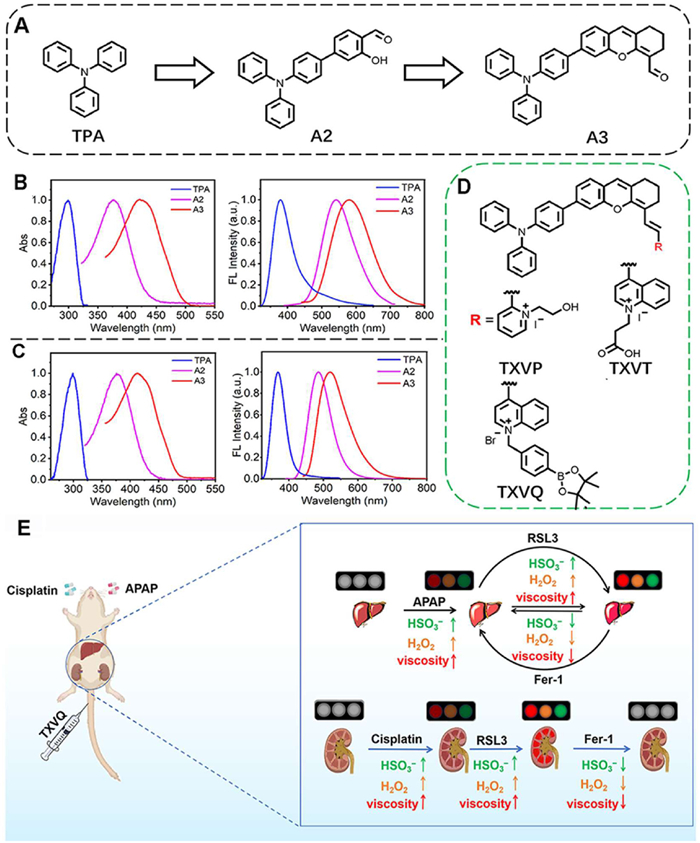
(A) Schematic of the modification of triphenylamine. (B) UV–vis absorption and fluorescence spectra of TPA, A2 and A3 (10 µmol/L) in DMSO. (C) UV–vis absorption and fluorescence spectra of TPA, A2 and A3 (10 µmol/L) in 1,4-dioxane. (D) Design strategy for organic dyes based on the triphenylamine skeleton. (E) Schematic illustration of the differentiating effects of ferroptosis inhibition with TXVQ probe on liver and kidney injuries.
The advanced progress about this multi-channel fluorescent probe lies in its ability to detect and differentiate between various parameters associated with cellular stress and injury [27]. The multi-modal response to different stimuli makes TXVQ a powerful tool for monitoring cellular environments, particularly in the context of ferroptosis, where changes in HSO3−, H2O2 and viscosity are critical. The novelty of this work is multifaceted. Firstly, it introduces a single probe capable of detecting multiple parameters simultaneously, which is a significant advancement in the field of fluorescence-based biosensing. This multi-channel capability allows for a more comprehensive understanding of cellular processes and can lead to improved diagnostics and therapeutic monitoring. Secondly, the probe's specific reactions with HSO3− and H2O2, along with its viscosity sensitivity, provide a unique combination of detection mechanisms that can offer insights into complex biological events such as ferroptosis. Lastly, the distinct color emissions for different parameters enable simultaneous and distinct monitoring, which could be particularly useful in high-throughput screening and real-time tracking of cellular responses to various stimuli. This innovative approach has the potential to revolutionize the way we study and respond to cellular stress and disease processes.
Triphenylamine (TPA) as a chromophore has significant steric hindrance and through-conjugation electronic effects, which enhance the stability of nitrogen-centered radicals [25]. However, TPA exhibits a relatively short maximum absorption and emission wavelength. Generally, the extensive conjugated structures of TPA derivatives make them susceptible to π-π stacking leading to fluorescence quenching [26]. Hence, the modification of TPA led to the acquisition of A2 and A3. A3 exhibits excellent spectral properties (Schemes 1A–C). Therefore, we have synthesized the probes TXVP, TXVT, and TXVQ based on A3 (Scheme 1D). The synthesis routine (Schemes S1 and S2 in Supporting information), the synthesis procedure and intermediates, TXVP, TXVT and TXVQ characterized by 1H nuclear magnetic resonance (NMR), 13C NMR, and high-resolution mass spectrometry (HRMS) were listed in Supporting information (Figs. S1–S19 in Supporting information). Among these, TXVQ stands out for its enhanced absorption and fluorescence emission wavelengths, as well as its robust fluorescence signal (Figs. S20–S22 in Supporting information), and can simultaneously detect HSO3−, H2O2 and viscosity. Compared with single-parameter probes, TXVQ as a tri-parameter probe that can provides a more precise assessment of complex biological processes including drug-induced liver injury (DILI) and AKI during the process of the inhibition of ferroptosis (Scheme 1E), and reduce the risk of false positives signals in vivo [28].
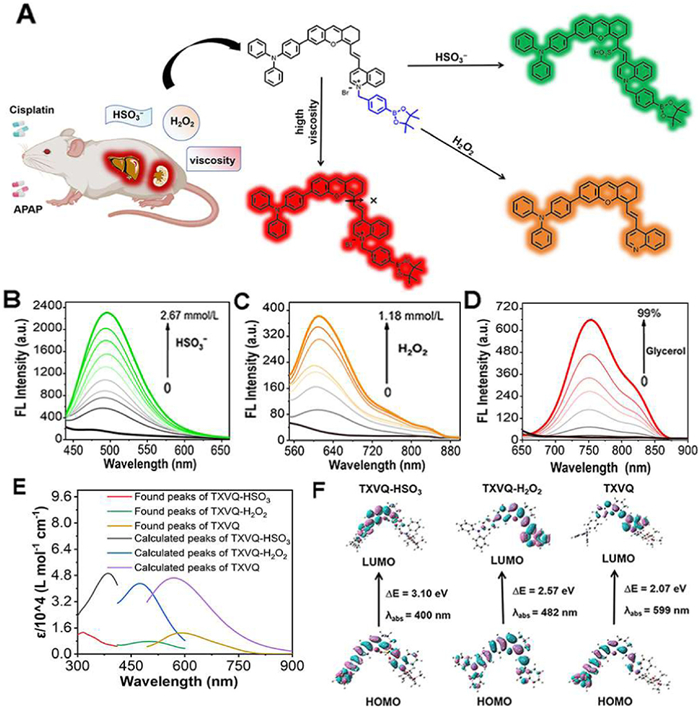
Studies have shown that the phenylborate group is a detection moiety for H2O2, and the probe TXVQ has been designed with the incorporation of this phenylborate group [29]. Consequently, when TXVQ interacts with H2O2, the phenylborate part of TXVQ is eliminated, leading to the formation of TXVQ-H2O2, which emits an orange fluorescence. Additionally, TXVQ can monitor HSO3− through a Michael addition reaction, resulting in strong green fluorescence [30]. It also can detect variation of viscosity via the twisted intramolecular charge transfer (TICT) mechanism, resulting in the emission of strong red fluorescence (Fig. 1A) [31]. TXVQ in various solvents demonstrates its distinctiveness with absorption peaks exceeding 640 nm and emission peaks surpassing 750 nm (Fig. S22). In Table S1 (Supporting information), TXVQ exhibits a large Stokes shift and the highest fluorescence quantum yield in glycerol comparing Cy5 (Φ = 0.2 in DMSO) as a reference.
Figure 1
Figure 1.
(A) Schematic diagram of fluorescent probe TXVQ for detection of HSO3−, H2O2 and viscosity. (B) Fluorescence spectra of TXVQ (50 µmol/L) in pH 7.4 PBS buffer (50% DMSO, v/v) upon addition of HSO3− (λex = 400 nm). (C) Fluorescence spectra of TXVQ (50 µmol/L) in pH 7.4 PBS buffer (50% DMSO, v/v) upon addition of H2O2 (λex = 500 nm). (D) Fluorescence spectra of TXVQ (50 µmol/L) in pH 7.4 PBS–glycerol systems with the fraction of glycerol (f.w.) from 0 to 99% (λex = 630 nm). (E) Theoretical UV–vis absorption spectra and measured UV–vis absorption spectra of HSO3−, H2O2 and viscosity detected by TXVQ. (F) DFT-calculation results of TXVQ-HSO3, TXVQ-H2O2 and TXVQ.
TXVQ sensitively and rapidly detects HSO3−, H2O2 with respective linear ranges of 0–0.8 and 0–2.67 mmol/L, and detection limits of 12.2 and 15.07 µmol/L (Figs. 1B–D and Figs. S23–S25 in Supporting information). It responds rapidly to these analytes with fluorescence changes at 500 and 600 nm, respectively, and is effective across physiological pH ranges, suitable for bioassays (Fig. S26 in Supporting information). Additionally, TXVQ exhibits a red-shift in its maximum absorption wavelength and an increase in fluorescence intensity at 750 nm with rising glycerol content in phosphate buffered saline (PBS), indicating a sensitivity to viscosity changes due to inhibited molecular rotor rotation and enhanced π-conjugation [32]. The probe shows a robust linear relationship between log fluorescence intensity and viscosity across the range of 7.9 cP to 880.0 cP, and its viscosity detection is pH-independent, highlighting its potential for monitoring intracellular viscosity in biological experiments. TXVQ demonstrates excellent selectivity and interference resistance for detecting HSO3−, H2O2 and viscosity, with negligible fluorescence changes in the presence of interfering substances, ensuring its reliability in complex biological systems (Fig. S27 in Supporting information).
The probe TXVQ contains a phenylborate moiety that serves as an H2O2 monitoring group. In the presence of H2O2, it can undergo a 1,6-elimination reaction with TXVQ to release the fluorescent group TXVQ-H2O2, emitting a strong orange fluorescence (Fig. S28 in Supporting information) [33]. Additionally, the C=C formed by the quinoline salt and triphenylamine derivative A3 via Michael addition reaction with HSO3−, releasing TXVQ-HSO3 and emitting a strong green fluorescence. Finally, TXVQ responds to viscosity through the TICT effect, emitting a strong red fluorescence [34]. Mass spectrometry analysis and density functional theory (DFT) calculations have verified these mechanisms (Figs. 1E and F, Figs. S29 and S30 in Supporting information). The probe TXVQ exhibits a photoinduced electron transfer (PET) effect, which quenches the fluorescence of the probe. However, upon the addition of HSO3− or H2O2, PET effect of TXVQ was inhibited, leading to the emission of green fluorescence of TXVQ. The theoretical calculation results of the ultraviolet-visible spectroscopy (UV–vis) absorption spectra are consistent with experimental results.
The cell counting kit-8 (CCK-8) assay demonstrated that probe TXVQ exhibits low cytotoxicity, with cell survival at 80% even at 30 µmol/L, leading to the selection of 10 µmol/L for subsequent cellular and animal experiments (Fig. S31 in Supporting information). In HeLa cells, TXVQ showed no fluorescence alone, but HSO3− and H2O2 treatments increased green/orange fluorescence, validating its cellular imaging capability of these analytes (Figs. S32 and S33 in Supporting information).
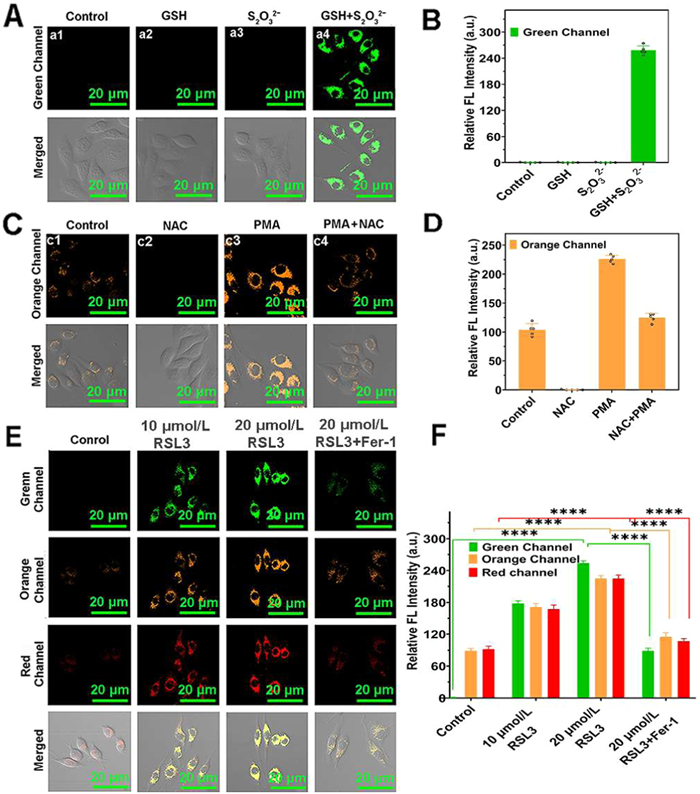
Subsequently, the ability of the TXVQ to monitor endogenous HSO3− and H2O2 was investigated in HeLa cells. The probe TXVQ did not show a green fluorescence signal after incubation with only GSH or Na2S2O3, indicating that there was no endogenous HSO3− production by the addition of only GSH or Na2S2O3 (Figs. 2A and B). However, when HeLa cells were incubated with GSH and Na2S2O3 together, the green fluorescence signal of TXVQ in cells was significantly enhanced, indicating that TXVQ is capable of imaging endogenous HSO3− within cells. In the detection of endogenous H2O2 within cells, in the control group, after incubation of TXVQ with HeLa cells, a faint fluorescent signal was detected in the orange channel, indicating the presence of a certain concentration of H2O2 in HeLa cells (Figs. 2C and D). Cells were then pre-incubated with N-acetylcysteine (NAC), which resulted in quenching of the orange fluorescence due to NAC being a scavenger of ROS. When HeLa cells were preincubated with phorbol-12-myristate-13-acetate (PMA), the orange fluorescence was significantly enhanced due to overexpression of endogenous H2O2. Finally, the PMA-stimulated cells were further treated with NAC and it was found that the introduction of NAC resulted in a significant decrease of the orange fluorescence. Collectively, the probe TXVQ can sensitively detect endogenous HSO3− and H2O2 in living cell.
Figure 2
Figure 2.
(A) Confocal fluorescence images. HeLa cells were (a1) only treated with TXVQ (10 µmol/L), (a2) incubated with GSH (500 µmol/L) and TXVQ (10 µmol/L), (a3) incubated with NaS2O3 (500 µmol/L) and TXVQ (10 µmol/L), (a4) incubated with GSH (500 µmol/L), NaS2O3 (500 µmol/L), and TXVQ (10 µmol/L). (B) Relative fluorescence intensities of the images in A. (C) HeLa cells were (c1) only incubated with TXVQ (10 µmol/L), (c2) incubated with NAC (500 µmol/L) and TXVQ (10 µmol/L), (c3) incubated with PMA (500 µmol/L) and TXVQ (10 µmol/L), (c4) incubated with PMA (500 µmol/L), NAC (500 µmol/L) and TXVQ (10 µmol/L). (D) Relative fluorescence intensities of the images in C. (E) Confocal fluorescent images of HSO3−, H2O2 and viscosity in HepG2 cells during ferroptosis. HepG2 cells were incubated with RSL3 (GPX4 inhibitor, 10 and 20 µmol/L) and Fer-1 (10 µmol/L) for 1 h and then with TXVQ (10 µmol/L) at 37 ℃. (F) Relative fluorescence intensities in the green, orange and red channels. Error bars represent mean ± SD (n = 5). Scale bar: 20 µm. ****P < 0.0001.
Finally, the study investigated the viscosity monitoring capability of TXVQ in HeLa cells. It is well known that dexamethasone (DXM) can increase intracellular viscosity, hence DXM was used to induce an increase in cell viscosity. In the control group, HeLa cells emitted a weak red fluorescence signal (Fig. S34 in Supporting information). When DXM was incubated with HeLa cells, the red fluorescence within the cells significantly increased and showed a dose-dependent enhancement. This indicates that TXVQ can detect fluctuations in cellular viscosity.
Before imaging ferroptosis cells with TXVQ, it is necessary to determine the intracellular HSO3−, H2O2 and viscosity, as they are closely associated with ferroptosis. In the control group, very weak orange and red fluorescence were observed with no green fluorescence found, suggesting that HepG2 cells are devoid of HSO3− and contain trace amount of H2O2 and the viscosity is very low (Figs. 2E and F). In this section, the ferroptosis inducer RSL3 covalently inhibits the antioxidant GPX4, leading to the accumulation of ROS [35]. After 1 h of incubation with RSL3 (10, 20 µmol/L), a significant and dose-dependent fluorescence signals increased. Ferroptosis is triggered by the lipid peroxidation pathway, lipophilic antioxidants Fer-1 were selected as ferroptosis inhibitor [36]. Co-incubation of RSL3 with the ferroptosis inhibitor Fer-1, the orange and red fluorescence intensity in HepG2 cells significantly decreased compared to those of the control group, on the other hand the green fluorescence intensity was higher than that of the control group. Throughout the ferroptosis process, there is a notable escalation in the concentrations of HSO3−, H2O2 and viscosity. TXVQ serves as a tool for tracking the variations in these levels as ferroptosis process.
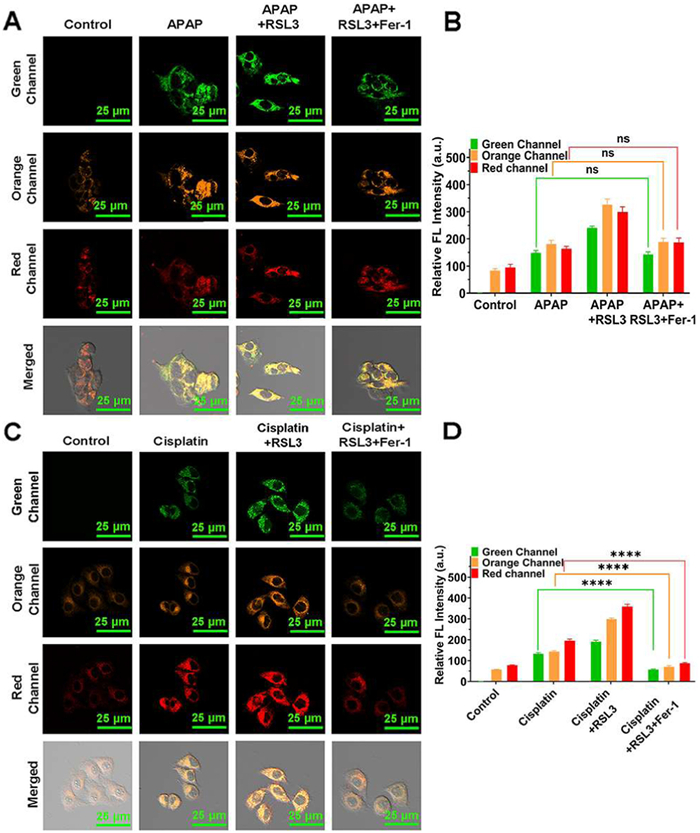
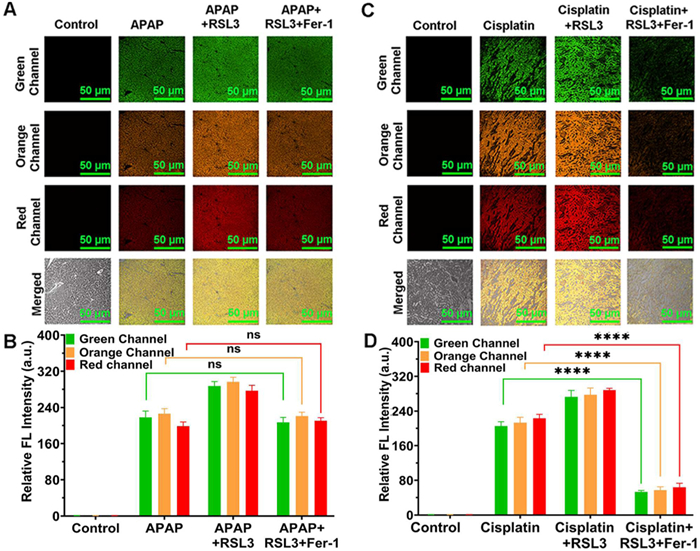
Liver injury, kidney injury, and ferroptosis all can modify the cellular environment, leading to increased concentration of HSO3− and H2O2, along with an increase in viscosity [37]. L02 cell injury, HEK293t cell injury and ferroptosis were induced using acetaminophen (APAP), cisplatin and RSL3. Ferroptosis was subsequently inhibited with Fer-1. The APAP and ferroptosis heightened fluorescence across all three channels, indicating elevated HSO3−, H2O2 and viscosity due to liver injury and ferroptosis (Figs. 3A and B). Fer-1′s inhibition of ferroptosis did not reduce L02 cells injury effects. By comparison the cisplatin group increased fluorescence, suggesting kidney injury and ferroptosis enhance HSO3−, H2O2 and viscosity (Figs. 3C and D). Nevertheless, Fer-1′s mitigation of ferroptosis reduced these effects, indicating a protective role against HEK293t cells injury. Briefly TXVQ can differentiate between liver/kidney injury and normal cells as well as tracking the impact of inhibiting ferroptosis.
Figure 3
Figure 3.
Confocal fluorescence images of L02 cells. (A) The control group: cells were only treated with TXVQ (10 µmol/L). The APAP group: cells were treated with APAP (500 µmol/L) and TXVQ (10 µmol/L). The ferroptosis group, cells were treated with APAP (500 µmol/L), RSL3 (20 µg/kg) and TXVQ (10 µmol/L). Fer-1 inhibited group, cells were treated with APAP (500 µmol/L), RSL3 (20 µg/kg), Fer-1 (20 µg/kg) and TXVQ (10 µmol/L). (B) Relative fluorescence intensities of the images in A. (C) Fluorescence images of HEK293t cells. The control group: cells were only treated with TXVQ (10 µmol/L). The cisplatin group: cells were treated with cisplatin (20 µmol/L) and TXVQ (10 µmol/L). The ferroptosis group, cells were treated with cisplatin (20 µmol/L), RSL3 (20 µg/kg) and TXVQ (10 µmol/L). Fer-1 inhibited group: cells were treated with cisplatin (20 µmol/L), RSL3 (20 µg/kg), Fer-1 (20 µg/kg) and TXVQ (10 µmol/L). (D) Relative fluorescence intensities of the images in C. Data are the mean ± SD (n = 5 independent experiments). Scale bar: 25 µm. ****P < 0.0001. ns, not significant.
Drug overdoses, particularly with APAP and cisplatin, can cause severe organ damage and even death. We used BALB/c female nude mice to create DILI and AKI models. All animal experiments were conducted in accordance with the guidelines for the care and use of laboratory animals at Linyi University and were approved by the Institutional Animal Care and Use Committee (IACUC) of Linyi University. Mice were injected with APAP (500 mg/kg) for 12 h and cisplatin (20 mg/kg) for two days, respectively. After administering TXVQ, enhanced fluorescence in green, orange, and red signals in the APAP group indicated increased HSO3−, H2O2 and viscosity, confirming DILI (Figs. S35A and B in Supporting information). A similar pattern in the cisplatin group validated the AKI model (Figs. S35C and D in Supporting information), demonstrating the effectiveness of TXVQ for imaging in both conditions.
Research shows iron metabolism issues and lipid peroxidation contribute to liver and kidney diseases [38]. During sepsis, Wang et al. noted increased GPR116, promoting hepatic ferroptosis and worsening liver injury [39]. He et al. discovered that while deleting ATF4 reduced fatty liver, it made cells more prone to ferroptosis, accelerating HCC [40]. This indicates a close link between liver disease and ferroptosis, but its impact on the kidneys is less understood. Further research is needed to clarify how inhibiting ferroptosis affects liver versus kidney damage.
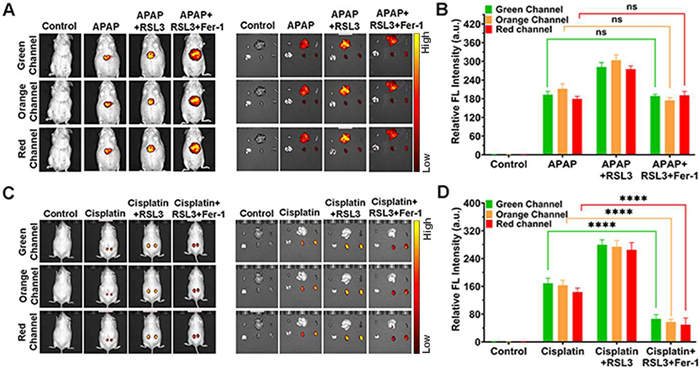
BALB/c female nude mice were subjected to an intraperitoneal injection of APAP to trigger liver injury, followed by RSL3 to induce ferroptosis, and finally Fer-1 to inhibit this process. Normal mice showed no fluorescence, but the DILI and DILI-ferroptosis model exhibited a marked increase. Upon Fer-1 treatment, a reduction of fluorescence was observed (Figs. 4A and B). Organ imaging revealed that APAP overdose led to both liver and kidney injuries. Despite the decrease in fluorescence signals with Fer-1 treatment, they remained comparable to the APAP-only group, suggesting that ferroptosis inhibition did not mitigate liver damage. This implies no direct correlation between ferroptosis and liver injury, as the fluorescence reduction was attributed to lowered levels of HSO3−, H2O2 and viscosity due to Fer-1′s inhibitory effect on ferroptosis, confirming that ferroptosis inhibition is not an effective strategy for alleviating liver injury.
Figure 4
Figure 4.
(A) Confocal fluorescence images of TXVQ (10 µmol/L) in mice and organs (heart, liver, spleen, lung, kidney): control group, mice were injected with TXVQ (10 µmol/L); DILI group, mice were injected with APAP (300 mg/kg) and TXVQ (10 µmol/L); DILI-ferroptosis group, mice were injected with APAP (300 mg/kg), RSL3 (20 µg/kg) and TXVQ (10 µmol/L). Fer-1 inhibited group, mice were injected with APAP (300 mg/kg), RSL3 (20 µg/kg), Fer-1 (20 µg/kg) and TXVQ (10 µmol/L). (B) Fluorescence intensity of the mouse in the images in A. (C) Confocal fluorescence images of TXVQ (10 µmol/L) in mice and organs (heart, liver, spleen, lung, kidney). Control group, mice were injected with TXVQ (10 µmol/L). AKI group, mice were injected with cisplatin (20 mg/kg) and TXVQ (10 µmol/L). AKI-ferroptosis group, mice were injected with cisplatin (20 mg/kg), RSL3 (20 µg/kg) and TXVQ (10 µmol/L). Fer-1 inhibited group: mice were injected with cisplatin (20 mg/kg), RSL3 (20 µg/kg), Fer-1 (20 µg/kg) and TXVQ (10 µmol/L). (D) Fluorescence intensity of the mouse in the images in C. Error bars represent mean ± SD (n = 5). ****P < 0.0001.
A kidney injury model was established in BALB/c female nude mice using cisplatin. Ferroptosis was induced by RSL3 and inhibited by Fer-1. Control mice showed no fluorescence, while the AKI and AKI-ferroptosis groups exhibited increased fluorescence (Figs. 4C and D). Compared to the AKI group, the significant reduction in fluorescence in mice with Fer-1 inhibition of ferroptosis indicates that it alleviates kidney injury. Organ imaging detected fluorescence only in kidneys, indicating that an overdose of cisplatin specifically damages the kidneys. Notably, Fer-1-inhibited mice still showed higher fluorescence than controls. While ferroptosis contributes to kidney injury, its inhibition by Fer-1 can only partially protect the kidneys, implying other mechanisms may also regulate kidney injury.
In liver tissue imaging, control mice exhibited no fluorescence, but DILI-ferroptosis mice displayed higher fluorescence intensity (Figs. 5A and B). The fluorescence imaging of Fer-1-treated mice matched that of the DILI group, indicating that TXVQ can serve as a probe for HSO3−, H2O2 and viscosity. However, the inhibition of ferroptosis didn't improve liver injury. This could be attributed to the fact that the etiology of DILI is likely to involve multiple modes of cell death, such as autophagy, pyroptosis, and ferroptosis. Although Fer-1 can inhibit ferroptosis, other forms of cell death still existed. Moreover, various drugs induce hepatocyte death through distinct mechanisms, necessitating the targeting of different pathways to block cell death. However, in kidney tissue imaging, control mice showed no fluorescence, while AKI and AKI-ferroptosis groups showed increasing fluorescence (Figs. 5C and D). Fer-1 treatment significantly reduced fluorescence compared to the AKI group, suggesting TXVQ can track HSO3−, H2O2 and viscosity changes, indicating ferroptosis inhibition's protective effect on kidney injury. This study confirms ferroptosis's role in AKI and suggests targeting it could be a novel therapeutic strategy for kidney disease treatment.
Figure 5
Figure 5.
(A) Confocal fluorescence images of TXVQ (10 µmol/L) in normal liver tissue, DILI tissue, DILI-ferroptosis tissue and Fer-1 treated ferroptosis liver tissue. (B) Fluorescence intensity of the liver tissue sections. (C) Confocal fluorescence images of TXVQ (10 µmol/L) in normal kidney tissue, AKI tissue, AKI-ferroptosis tissue and Fer-1 treated ferroptosis kidney tissue. (D) Fluorescence intensity of the kidney tissue sections. Error bars represent mean ± SD (n = 5). Scale bar: 50 µm. ****P < 0.0001.
The role of ferroptosis in liver diseases is complex, with evidence suggesting that it can both contribute to liver injury and potentially be harnessed as a therapeutic target for certain conditions, such as HCC, where it can increase the sensitivity of cancer cells to certain treatments. In summary, we have developed a multi-channel fluorescent probe TXVQ, which is capable of detecting RSS (HSO3−), ROS (H2O2) and viscosity through green, orange, and red fluorescence channels, respectively. This probe has demonstrated broad application prospects in the field of biosensing. These capabilities position TXVQ as a means to further our understanding of ferroptosis's role in both liver and kidney pathologies. TXVQ differentiates between normal and injured liver/kidney cells, visualizing the impact of ferroptosis inhibition on these injuries. The results from the murine model indicate that the liver and kidney exhibit distinct responses to the ferroptosis inhibitor Fer-1. Although the inhibition of ferroptosis leads to a significant reduction in AKI, as evidenced by the decreased levels of RSS (HSO3−), ROS (H2O2) and viscosity, DILI does not show such improvement. This suggests that the pathophysiological mechanisms underlying liver and kidney injuries may involve different sensitivities to ferroptosis inhibition, with the kidney appearing to be more responsive to such interventions. While ferroptosis plays a role in both types of organ injuries, its inhibition may have organ-specific therapeutic benefits. This could lead to the development of targeted treatments that are more effective in protecting the kidney from injury while sparing the liver from unnecessary intervention.
Declaration of competing interest
The authors declare that they have no known competing financial interests or personal relationships that could have appeared to influence the work reported in this paper.
We are grateful for the financial supports from Scientific and Technological Key Project in Henan Province (No. 22170015), Development Plan of the Youth Innovation Team in Colleges and Universities of Shandong Province (No. 2023KJ219), Zhengzhou University (No. 32211807) and Henan Provincial Science and Technology Research Project (No. JC21253010).
Supplementary materials
Supplementary material associated with this article can be found, in the online version, at doi:10.1016/j.cclet.2025.111220.
[1]
D. Song, C. Li, M. Zhu, et al., Angew. Chem. Int. Ed. 61 (2022) e202212721. doi: 10.1002/anie.202212721
[2]
X. Nan, Y. Huyan, H. Li, S. Sun, Y. Xu, Coord. Chem. Rev. 426 (2021) 213580. doi: 10.1016/j.ccr.2020.213580
[3]
C. Zhang, S. Lu, K. Deng, et al., Adv. Funct. Mater. 33 (2023) 2301462. doi: 10.1002/adfm.202301462
[4]
K.N. Wang, L.Y. Liu, D. Mao, et al., Angew. Chem. Int. Ed. 60 (2021) 15095. doi: 10.1002/anie.202104163
Scheme 1
(A) Schematic of the modification of triphenylamine. (B) UV–vis absorption and fluorescence spectra of TPA, A2 and A3 (10 µmol/L) in DMSO. (C) UV–vis absorption and fluorescence spectra of TPA, A2 and A3 (10 µmol/L) in 1,4-dioxane. (D) Design strategy for organic dyes based on the triphenylamine skeleton. (E) Schematic illustration of the differentiating effects of ferroptosis inhibition with TXVQ probe on liver and kidney injuries.
Figure 1
(A) Schematic diagram of fluorescent probe TXVQ for detection of HSO3−, H2O2 and viscosity. (B) Fluorescence spectra of TXVQ (50 µmol/L) in pH 7.4 PBS buffer (50% DMSO, v/v) upon addition of HSO3− (λex = 400 nm). (C) Fluorescence spectra of TXVQ (50 µmol/L) in pH 7.4 PBS buffer (50% DMSO, v/v) upon addition of H2O2 (λex = 500 nm). (D) Fluorescence spectra of TXVQ (50 µmol/L) in pH 7.4 PBS–glycerol systems with the fraction of glycerol (f.w.) from 0 to 99% (λex = 630 nm). (E) Theoretical UV–vis absorption spectra and measured UV–vis absorption spectra of HSO3−, H2O2 and viscosity detected by TXVQ. (F) DFT-calculation results of TXVQ-HSO3, TXVQ-H2O2 and TXVQ.
Figure 2
(A) Confocal fluorescence images. HeLa cells were (a1) only treated with TXVQ (10 µmol/L), (a2) incubated with GSH (500 µmol/L) and TXVQ (10 µmol/L), (a3) incubated with NaS2O3 (500 µmol/L) and TXVQ (10 µmol/L), (a4) incubated with GSH (500 µmol/L), NaS2O3 (500 µmol/L), and TXVQ (10 µmol/L). (B) Relative fluorescence intensities of the images in A. (C) HeLa cells were (c1) only incubated with TXVQ (10 µmol/L), (c2) incubated with NAC (500 µmol/L) and TXVQ (10 µmol/L), (c3) incubated with PMA (500 µmol/L) and TXVQ (10 µmol/L), (c4) incubated with PMA (500 µmol/L), NAC (500 µmol/L) and TXVQ (10 µmol/L). (D) Relative fluorescence intensities of the images in C. (E) Confocal fluorescent images of HSO3−, H2O2 and viscosity in HepG2 cells during ferroptosis. HepG2 cells were incubated with RSL3 (GPX4 inhibitor, 10 and 20 µmol/L) and Fer-1 (10 µmol/L) for 1 h and then with TXVQ (10 µmol/L) at 37 ℃. (F) Relative fluorescence intensities in the green, orange and red channels. Error bars represent mean ± SD (n = 5). Scale bar: 20 µm. ****P < 0.0001.
Figure 3
Confocal fluorescence images of L02 cells. (A) The control group: cells were only treated with TXVQ (10 µmol/L). The APAP group: cells were treated with APAP (500 µmol/L) and TXVQ (10 µmol/L). The ferroptosis group, cells were treated with APAP (500 µmol/L), RSL3 (20 µg/kg) and TXVQ (10 µmol/L). Fer-1 inhibited group, cells were treated with APAP (500 µmol/L), RSL3 (20 µg/kg), Fer-1 (20 µg/kg) and TXVQ (10 µmol/L). (B) Relative fluorescence intensities of the images in A. (C) Fluorescence images of HEK293t cells. The control group: cells were only treated with TXVQ (10 µmol/L). The cisplatin group: cells were treated with cisplatin (20 µmol/L) and TXVQ (10 µmol/L). The ferroptosis group, cells were treated with cisplatin (20 µmol/L), RSL3 (20 µg/kg) and TXVQ (10 µmol/L). Fer-1 inhibited group: cells were treated with cisplatin (20 µmol/L), RSL3 (20 µg/kg), Fer-1 (20 µg/kg) and TXVQ (10 µmol/L). (D) Relative fluorescence intensities of the images in C. Data are the mean ± SD (n = 5 independent experiments). Scale bar: 25 µm. ****P < 0.0001. ns, not significant.
Figure 4
(A) Confocal fluorescence images of TXVQ (10 µmol/L) in mice and organs (heart, liver, spleen, lung, kidney): control group, mice were injected with TXVQ (10 µmol/L); DILI group, mice were injected with APAP (300 mg/kg) and TXVQ (10 µmol/L); DILI-ferroptosis group, mice were injected with APAP (300 mg/kg), RSL3 (20 µg/kg) and TXVQ (10 µmol/L). Fer-1 inhibited group, mice were injected with APAP (300 mg/kg), RSL3 (20 µg/kg), Fer-1 (20 µg/kg) and TXVQ (10 µmol/L). (B) Fluorescence intensity of the mouse in the images in A. (C) Confocal fluorescence images of TXVQ (10 µmol/L) in mice and organs (heart, liver, spleen, lung, kidney). Control group, mice were injected with TXVQ (10 µmol/L). AKI group, mice were injected with cisplatin (20 mg/kg) and TXVQ (10 µmol/L). AKI-ferroptosis group, mice were injected with cisplatin (20 mg/kg), RSL3 (20 µg/kg) and TXVQ (10 µmol/L). Fer-1 inhibited group: mice were injected with cisplatin (20 mg/kg), RSL3 (20 µg/kg), Fer-1 (20 µg/kg) and TXVQ (10 µmol/L). (D) Fluorescence intensity of the mouse in the images in C. Error bars represent mean ± SD (n = 5). ****P < 0.0001.
Figure 5
(A) Confocal fluorescence images of TXVQ (10 µmol/L) in normal liver tissue, DILI tissue, DILI-ferroptosis tissue and Fer-1 treated ferroptosis liver tissue. (B) Fluorescence intensity of the liver tissue sections. (C) Confocal fluorescence images of TXVQ (10 µmol/L) in normal kidney tissue, AKI tissue, AKI-ferroptosis tissue and Fer-1 treated ferroptosis kidney tissue. (D) Fluorescence intensity of the kidney tissue sections. Error bars represent mean ± SD (n = 5). Scale bar: 50 µm. ****P < 0.0001.

 DownLoad:

 下载:
下载:


 下载:
下载:
