Citation:
Sheng Qian, Jingying Wei, Junhua Wang, Yi Zhang, Huaiguo Xue, Tengfei Jiang, Jingqi Tian. Conjugated N-heterocycles in heterostructured support manipulate d-band center for hydrogen electrocatalysis[J]. Chinese Chemical Letters,
2026, 37(8): 112106.
doi:
10.1016/j.cclet.2025.112106
Conjugated N-heterocycles in heterostructured support manipulate d-band center for hydrogen electrocatalysis
English
Conjugated N-heterocycles in heterostructured support manipulate d-band center for hydrogen electrocatalysis
Received Date:
14 August 2025 Accepted Date:
11 November 2025 Revised Date:
29 October 2025 Available Online:
15 August 2026
Abstract:
The interfacial electronic interaction between the support and catalyst has been demonstrated to play a significant role in regulating the d-band structure of metal centers. Still, it requires dedicated control over the interaction in a reasonable manner. Herein, we developed a heterostructured support by covalently linking carbon nitride quantum dots (CNQDs) on TiO2, to anchor electroactive CoP clusters (TiO2–CNQD/CoP) for hydrogen evolution reaction (HER). The interfacial electronic interaction between the heterostructured support (TiO2–CNQD) and CoP can be controlled by varying the size of CNQDs, owing to the number of conjugated N-heterocycles in CNQDs induces tunable π-electron delocalization. As a result, a volcano-shaped correlation between the shift of the Co d-band center (Δd) and the HER performance was established, suggesting that TiO2–CNQD/CoP-C2 with a moderate size of CNQD is the optimal HER catalyst. This study highlights the critical role of interfacial interaction in supported catalysts, providing a predictive descriptor focusing on the support design of advanced HER catalysts.
Alkaline water splitting has been one of the most powerful approaches for large-scale hydrogen production [1-3], which requires efficient hydrogen evolution reaction (HER) electrocatalysts to overcome the high overpotential and reduce energy consumption [4-6]. Supported catalysts have attracted substantial research focus owing to the distinguished interfacial electronic interaction between the support and catalyst, which could regulate the electron distribution at the interface and thus influence the electronic structure of metal sites [7-9]. According to d-band center theory, the center of the d-band of a transition metal site serves as a key electronic structure descriptor in electrocatalysis, which is associated with the ability to adsorb reaction intermediates [10,11]. Therefore, the physicochemical properties of the support, including the structure, conductivity, exposed surface with functional groups/atoms, and chemical stability should be taken into consideration when evaluating the support effect on electrocatalysis. To meet the above requirements, various kinds of supports have been developed, such as metal hydroxide/oxide, sulfide, nitride, carbide, carbons, and transition metal substrates (Ni, Fe, Cu, Ti, etc.) [12-17]. It is still of great urgency to develop suitable support that could induce optimal interfacial electronic interaction with the electroactive sites toward d-band center tuning.
TiO2 has emerged as one of the most promising supports for electrocatalysis owing to its chemical inertness but rich surface hydroxyl groups for anchoring electroactive species [18,19]. Previous research works have demonstrated the employment of various TiO2 nanostructures as support in electrocatalysis, including nanowires, nanorods, and nanoplates [20]. For example, Liu’s group reported on the P-doped defective TiO2-supported Ru cluster for HER, with rich surface oxygen vacancies on rutile-TiO2 facilitating the adsorption and dissociation of water [21]. Our recent work highlights that the universal utilization of nanostepped TiO2 as support for nanoparticles or single-atom catalyst (SAC) anchoring, benefiting from the unsaturated edge configuration on the steps that influences the coordination environment of Co atoms [22,23]. It is worthwhile to note that most of these works focus on the direct interaction between TiO2 support and the catalyst, taking great effort into tuning the intrinsic structure of TiO2 itself, which aims to achieve a desired interfacial interaction. Commonly used strategies such as atom-doping, vacancy/defect construction, or morphology engineering might be arduous to sustain desired regulation, even at the cost of damaging the surface structure [24-26]. To this end, a feasible but universal strategy to modify the surface chemistry of TiO2 support with controllable interfacial interaction is highly desired but challenging.
Herein, we report on a heterostructured support by covalently linking carbon nitride quantum dots (CNQDs) on stepped TiO2 for anchoring CoP clusters (TiO2—CNQD/CoP). Varying the number of conjugated N-heterocycles in CNQDs leads to tunable π-electron delocalization, which manipulates the interfacial electronic interaction between the heterostructured support (TiO2—CNQD) and CoP. Furthermore, the shift of the Co d-band center (Δd) has been proposed as a descriptor to predict the adsorption strength of intermediates, exhibiting a volcano-shaped correlation with the HER performance. TiO2—CNQD/CoP-C2 with moderate size of CNQD shows the optimal HER performance, with 98 mV overpotential to achieve a current density of 100 mA/cm2.
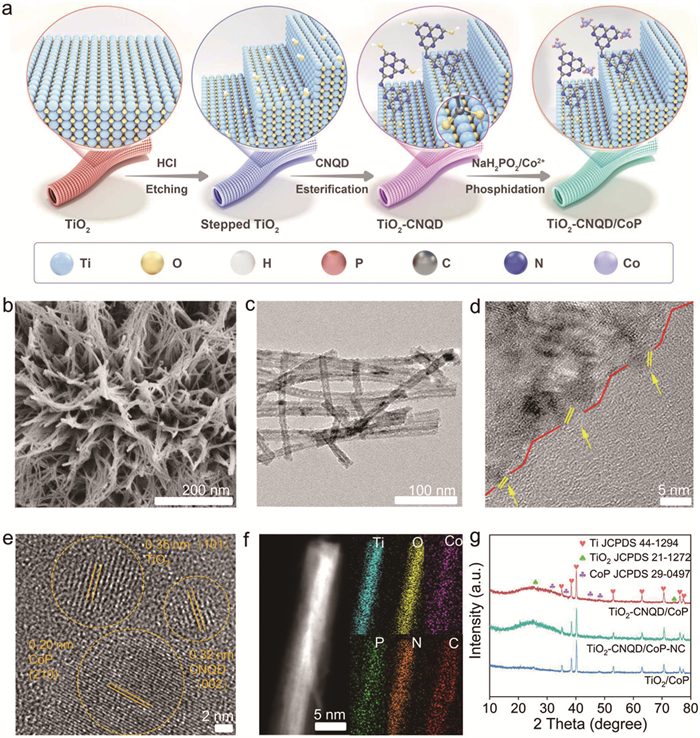
Fig. 1a schematically illustrates the synthetic procedure of TiO2—CNQD/CoP, including acid-etching formed stepped TiO2, covalently linking of CNQD, and Co2+ impregnation and phosphidation conversion. Nanostepped TiO2 nanowire arrays supported on Ti mesh were prepared according to previous protocol [27], in which the hydrothermally grown TiO2 nanowire arrays were etched with dilute hydrochloric acid, generating abundant surface steps. CNQDs were synthesized by the hydrothermal oxidation and exfoliation of bulk graphitic carbon nitride (g-C3N4), introducing –COOH and –OH functional groups on the edge. HRTEM images show a typical 0.32 nm lattice fringe corresponding to the (002) plane of g-C3N4 (Fig. S1 in Supporting information) [28]. XRD pattern of CNQDs revealed the characteristic peak of g-C3N4, demonstrating the crystal structure. XPS analysis shows the presence of –COOH, –OH, and –NH2 groups on conjugated N-heterocycles in CNQDs for further functionalization (Fig. S2 in Supporting information). Covalent grafting of CNQDs onto stepped TiO2 can be accomplished by esterification reaction between the –COOH on CNQDs and –OH on TiO2, which leads to the formation of heterostructured TiO2—CNQD support. HRTEM image shows a uniform decoration of CNQDs on TiO2 (Fig. S3 in Supporting information). Varying the oxidation and exfoliation period could control the size of CNQDs to be 1.67 nm (CNQD-1), 2.96 nm (CNQD-2), and 3.79 nm (CNQD-3) in diameters, respectively (Fig. S4 in Supporting information).
Figure 1
Figure 1.
(a) Schematic illustration of the synthetic procedure. (b) SEM image, (c) TEM image, (d, e) HRTEM images, (f) HAADF-STEM and elemental mapping of TiO2—CNQD/CoP. (g) XRD patterns of TiO2—CNQD/CoP, TiO2—CNQD/CoP-NC and TiO2/CoP.
The integration of such a heterostructured support enlarges the surface area with oxygen-containing groups on CNQDs as an anchoring site for Co2+. Phosphidation topologically converts the Co2+···O into CoP clusters bridged on CNQD-TiO2 (TiO2—CNQD/CoP) by C-P-Co (Fig. 1a). TiO2—CNQD/CoP preserves the nanowire arrays morphology with clearly defined nanosteps (Figs. 1b-d). HRTEM image exhibits lattice fringes of 0.35 nm, 0.32 nm, and 0.20 nm (Fig. 1e), which can be indexed to the (101) plane of TiO2, (002) of CNQDs, and (210) of CoP, respectively, evidencing well-resolved hetero-interfaces in TiO2—CNQD/CoP. STEM-EDX elemental mapping images show the homogeneous distribution of Ti and O signals on the entire nanowire, while a more concentrated surface location of Co, P, C, and N elements (Fig. 1f). A noncovalent heterostructured TiO2—CNQD support that is driven by electrostatic adsorption was also fabricated and employed as a counterpart (TiO2—CNQD/CoP-NC). Fig. S5 (Supporting information) shows that CoP aggregates into large particles, which might originate from the random distribution of CNQDs on TiO2. Both counterparts exhibit uniform distribution of CoP on the TiO2—CNQD support (Fig. S6 in Supporting information).
XRD patterns of TiO2—CNQD/CoP, TiO2—CNQD/CoP-NC, and TiO2/CoP exhibit sharp reflections at 31.6°, 36.3°, 46.2°, and 48.1° that correspond to the (011), (111), (112), and (211) planes of cubic CoP (JCPDS No. 29–0497) [29]. For TiO2—CNQD/CoP and TiO2—CNQD/CoP-NC, a broad feature centered between 20° and 30° reflects the disordered (002) plane of CNQDs [30]. Peaks at 25.5, 35.1, 38.3, 40.1 and 74.1 were ascribed to the TiO2 or Ti substrate [31]. Similarly, TiO2—CNQD/CoP-C1 and TiO2—CNQD/CoP-C3 were synthesized using CNQDs of ~1.67 nm and ~3.79 nm, respectively.
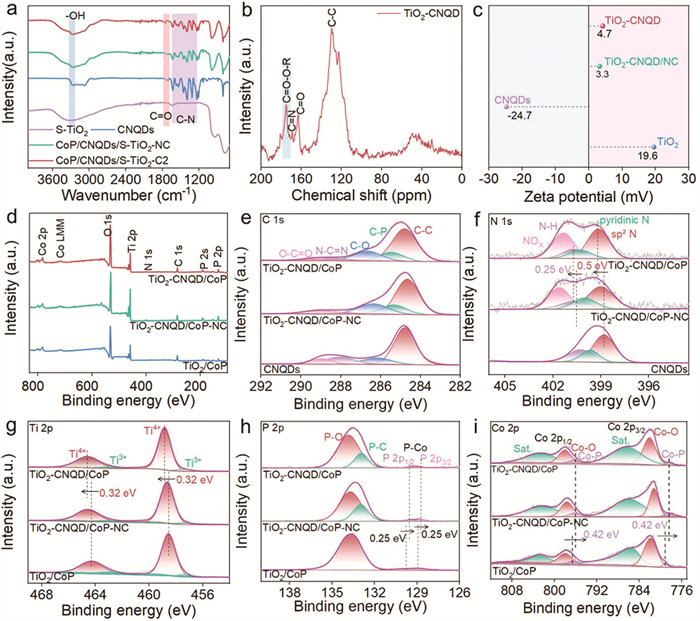
Fourier transform infrared (FTIR) spectra of TiO2—CNQD, TiO2—CNQD/NC, TiO2 and CNQDs were shown in Fig. 2a. It reveals C = O stretching at 1720 cm−1 for free CNQDs and the noncovalent composite [32,33], while this band emerges a positive shift to 1750 cm−1 in TiO2—CNQD. Meanwhile, the broad peak associated with –OH around 3200 cm−1 in TiO2 shifts to lower wavenumber with decreased intensity [34]. Both of the above are indicative of ester bond formation between CNQDs and TiO2. The solid-state 13C NMR spectroscopy was further collected for the TiO2–CNQD (Fig. 2b), which displays a characteristic resonance at 174.2 ppm that can be assigned to an ester carbonyl (O–C=O) environment [35]. Zeta-potential (ζ) of TiO2 and CNQDs is measured to be +19.6 mV and −24.7 mV, respectively (Fig. 2c). Both TiO2—CNQD/NC and TiO2—CNQD converge to near-neutral ζ values (+3.3 mV and +4.7 mV, respectively). Such sharp changes in ζ are relative to the strong interfacial electronic interactions, which would promote interfacial electron transfer between TiO2 and CNQDs.
Figure 2
Figure 2.
(a) FTIR spectra of TiO2—CNQD, TiO2—CNQD/NC, CNQDs and S-TiO2. (b) 13C solid-state NMR spectra of TiO2–CNQD. (c) Zeta potential measurements of TiO2—CNQD, TiO2—CNQD/NC, CNQDs and S-TiO2. (d) Full XPS spectra of TiO2—CNQD/CoP, TiO2—CNQD/CoP-NC and TiO2/CoP. The high-resolution XPS of (e) C 1s and (f) N 1s in TiO2—CNQD/CoP, TiO2—CNQD/CoP-NC and TiO2/CoP, (g) Ti 2p, (h) P 2p and (i) Co 2p in TiO2—CNQD/CoP, TiO2—CNQD/CoP-NC and CoP/TiO2.
XPS survey spectra detect Ti, O, Co, and P in all catalysts, while C and N signals were shown in CNQD-containing samples (Fig. 2c). High-resolution C 1s spectra resolve signals from C–C (284.8 eV), C–P (285.35 eV), C–O (286.3 eV), N–C=N (287.95 eV), and O–C=O (289.0 eV) in Fig. 2d [36]. The peak at 285.35 eV could be assigned to the C–P bond [37,38], which reflects the interfacial bridges between CoP and CNQDs. N 1s spectra reveal contributions from sp2 N (398.85 eV), pyridinic N (399.7 eV), and N–H (400.8 eV) for TiO2—CNQD/CoP (Fig. 2e) [39]. Compared to CNQDs, the N–C=N peak shifts positively by 0.5 eV in TiO2—CNQD/CoP, suggesting electron transfer between CNQDs with CoP and TiO2 [40]. O 1s spectra display characteristic C=O (531.6 eV) and C–O (532.4 eV) features that originate from oxygen-containing groups in CNQDs (Fig. S7 in Supporting information) [41]. Ti 2p spectra show Ti4+ at 458.92 and 464.67 eV, alongside Ti3+ signals at 457.4 and 462.45 eV due to acid-etching–induced surface oxygen vacancies in TiO2/CoP, (Fig. 2g) [42]. After covalently linking CNQDs, the Ti4+ peaks shift positively by 0.32 eV in TiO2—CNQD/CoP, suggesting CNQD-induced electron transfer from the TiO2 support. Further insights arise from the Co 2p and P 2p regions (Figs. 2h and i). In TiO2/CoP, Co 2p shows Co–P (778.15, 796.05 eV) and Co–O (781.5, 797.8 eV) doublets with associated satellites, while P 2p reveals P–Co (127.85, 128.8 eV) and P–O (133.35 eV) components [43]. Co–P and P–Co binding energies shift negatively by ~0.42 eV and ~0.25 eV in TiO2—CNQD/CoP sample, indicating CNQDs induce more electron transfer from the support to CoP. A new P–C peak at 132.65 eV further supports heterojunction formation (Fig. 2i) [44,45]. TiO2—CNQD/CoP-C1 and TiO2—CNQD/CoP-C3 show a similar trend in the binding energy shift of Co 2p and P 2p with that of TiO2—CNQD/CoP-C2 (Fig. S8 in Supporting information). This size-dependent binding energy shift is consistent with the value of Δd, revealing that CNQDs of moderate size (C2) induce an optimal π-electron delocalization. In contrast, too small (C1) or too large (C3) CNQDs result in less favorable electronic perturbations. It is found that Ti 2p and O 1s spectra share similar binding energy positions in the TiO2—CNQD support and TiO2—CNQD/CoP, while the N 1s spectrum in TiO2—CNQD exhibits binding energies located between that of CNQDs and TiO2—CNQD/CoP (Fig. S9 in Supporting information), which suggests the binding energies shifts of TiO2—CNQD/CoP are caused by the electronic interactions between CoP and the TiO2—CNQD support. Taken together, the positive shifts of N and Ti signals and negative shifts of Co and P could suggest directional electron transfer from TiO2 to CNQDs and to CoP, finally. Such an interfacial electronic interaction is essential to tuning the Co d-band center and optimizing hydrogen adsorption energetics, toward enhanced HER performance.
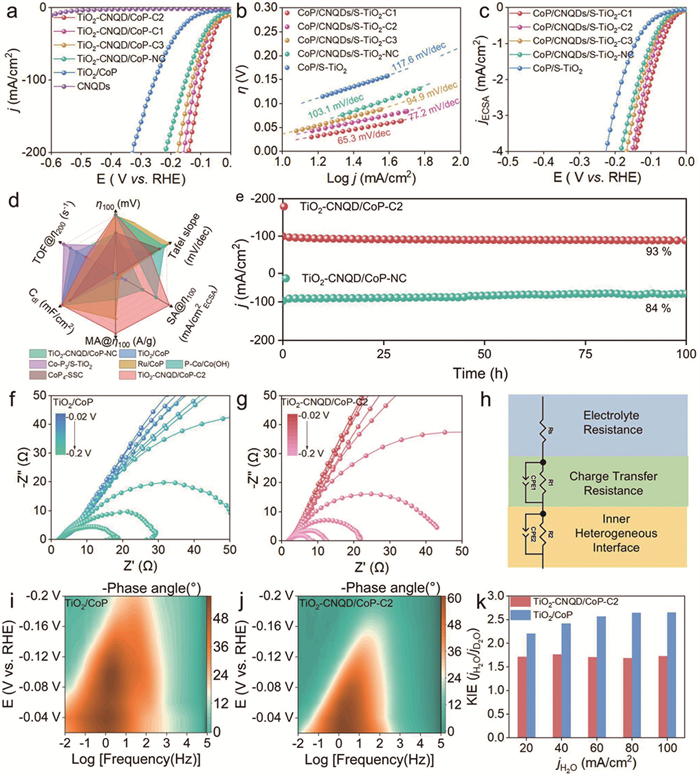
The HER activity of TiO2—CNQD/CoP was evaluated in 1.0 mol/L KOH using a standard three-electrode configuration at room temperature. Linear sweep voltammetry (LSV) curves demonstrate that covalent linkage of CNQDs markedly enhances the catalytic activity of TiO2/CoP. Among all samples, CNQDs exhibit negligible catalytic activity for HER in the tested potential window, while TiO2—CNQD/CoP-C2 exhibits the lowest overpotential of 98 mV at 100 mA/cm2, outperforming both TiO2—CNQD/CoP-C1 (116 mV) and TiO2—CNQD/CoP-C3 (128 mV) counterparts. The noncovalently linked TiO2—CNQD/CoP-NC and unmodified TiO2/CoP show significantly inferior performances, requiring 148 mV and 252 mV, respectively, to reach the same current density. The corresponding Tafel slopes further differentiate their intrinsic HER kinetics (Fig. 3b), in which TiO2—CNQD/CoP-C2 delivers the smallest value (65.3 mV/dec) following a faster Volmer–Heyrovsky mechanism. Similar electrochemically active surface area (ECSA) of TiO2—CNQD/CoP indicates that the incorporation of conjugated N-heterocycles of different sizes in TiO2/CoP did not increase the number of active sites (Fig. S10 in Supporting information) [46]. Electrochemically active surface area (ECSA)-normalized LSVs further confirm the superior intrinsic activity and efficient CoP utilization in TiO2—CNQD/CoP-C2 (Fig. 3c). The mass loading of CoP in these TiO2—CNQD/CoP catalysts was determined to be comparable (ca. 1.2 mg/cm2, Table S1 in Supporting information). TiO2—CNQD/CoP-C2 delivers a higher mass activity at η100 than TiO2—CNQD/CoP-C1 and C3 (Fig. S11 in Supporting information), suggesting that the superior HER activity of TiO2—CNQD/CoP-C2 may stem from the improved intrinsic activity induced by CNQDs. At an overpotential of 200 mV, the turnover frequency (TOF) of TiO2—CNQD/CoP-C2 reaches 11.4 s−1, significantly higher than that of bare TiO2/CoP (Fig. S12 in Supporting information). The radar diagram suggests that TiO2—CNQD/CoP-C2 performs as one of the best alkaline HER electrocatalysts compared with several other advanced Co-based HER catalysts (Fig. 3d) [22,47-49]. Furthermore, the stability of TiO2—CNQD/CoP-C2 was evaluated by chronoamperometry and multistep chronopotentiometry, with a continuous stability over 100 h of electrocatalysis, outperforming that of TiO2—CNQD/CoP-NC (Fig. 3e and Fig. S13 in Supporting information). Besides, the charge transfer amount (Q) of TiO2—CNQD/CoP-C2 (36 × 103 C/cm2) during operating time is one to two orders of magnitude higher than those of reported TMP-based electrocatalysts (Fig. S14 and Table S2 in Supporting information). Such observation also confirms a rapid surface reaction kinetics in the heterostructured TiO2—CNQD/CoP, which ensures efficient transfer and consumption of electrons.
Figure 3
Figure 3.
(a) LSV curves of CNQDs, TiO2/CoP, and TiO2—CNQD/CoP samples. (b) Tafel slopes, (c) LSV curves normalized by ECSA of TiO2—CNQD/CoP-C1, TiO2—CNQD/CoP-C2, TiO2—CNQD/CoP-C3, TiO2—CNQD/CoP-NC and TiO2/CoP. (d) Comparison of the alkaline HER performance in terms of overpotential (η100), Tafel slope, TOF, Cdl, specific activity, and mass activity at η100. (e) Chronoamperometry measurements of TiO2—CNQD/CoP-C2 TiO2—CNQD/CoP-NC and at the current densities of 0.1 A/cm2. Nyquist plots of (f) TiO2/CoP and (g) TiO2—CNQD/CoP-C2 at various voltages. (h) Schematic of electrode structure and the equivalent circuit. Bode phase plots of (i) TiO2/CoP and (j) TiO2—CNQD/CoP-C2 at various voltages. (k) The H/D KIE values of TiO2/CoP and TiO2—CNQD/CoP-C2 at different potentials.
The post-TiO2—CNQD/CoP catalyst after continuous electrocatalysis maintains the nanoparticles on nanowire morphology (Figs. S15a and b in Supporting information). HRTEM image further reveals the presence of characteristic lattice fringes corresponding to CNQDs and CoP (Fig. S15c in Supporting information), respectively, which indicates the structural robustness of the TiO2—CNQD/CoP. Survey XPS spectrum confirms the presence of N and C signals in the post-HER catalyst with nearly consistent elemental composition to those in the fresh catalyst (Fig. S15d in Supporting information). Furthermore, C 1s and N 1s spectra exhibit unchanged binding energies, demonstrating that CNQDs were well preserved during long-term electrocatalysis (Figs. S15e and f in Supporting information). No new phase in CoP was observed (Figs. S15g–j in Supporting information), further evidencing the structural stability.
The charge transfer kinetics and the adsorption and desorption kinetics of reaction intermediates on active sites during the HER is further investigated using in-situ electrochemical impedance spectroscopy (EIS) measured at different applied potentials. For the heterostructured TiO2—CNQD/CoP, in-situ EIS data were fitted with a two-time-constant equivalent circuit (Fig. 3h). The chosen model consists of a Rs (solution resistance) in series with two parallel R–CPE sub-circuits. The fitting reveals two characteristic charge-transfer resistance components at the outer electrode/electrolyte interface (R1) and the internal heterointerface between CoP and the TiO2—CNQD support (R2). The two-time-constant EIS analysis indicates that the incorporation of CNQDs markedly decreases the inner-layer charge transfer resistance (Table S3 in Supporting information), confirming that the heterostructured support improves electronic conduction [50]. Nyquist plots of TiO2—CNQD/CoP-C2 exhibited a smaller semicircular arc compared to that of TiO2/CoP in the potential window from −0.02 V to −0.2 V vs. RHE (Figs. 3i and j), which suggests that TiO2—CNQD/CoP-C2 surface was favorable for reactant adsorption and charge transfer in HER [51]. It is well accepted that peaks in the Bode plots located at low and high-frequency regions can be ascribed to the charge transfer reaction that occurs at either the electrolyte-catalyst interface or the catalyst inner-layer/interface, respectively [52,53]. For TiO2—CNQD/CoP-C2, the high phase angle at low frequencies and the very low phase angle at high frequencies indicate that the electron transfer resistance in HER is primarily due to the electrolyte-catalyst interface (Figs. 3i and j, and Fig. S16 in Supporting information), while TiO2/CoP experiences both kinds of charge transfer resistances [54], suggesting that the introduction of covalently linked CNQD at the hetero-interface promoted charge transfer at the catalyst inner-layer/interface [55].
Furthermore, the kinetic isotope effects (KIE) involving deuterium and hydrogen for HER were studied (Fig. 3k and Fig. S17 in Supporting information). Both TiO2—CNQD/CoP-C2 and TiO2/CoP exhibit a primary KIE, which matches well the previous Tafel slope results. A significant decrease in the KIE values for TiO2—CNQD/CoP-C2 compared to TiO2/CoP occurs, indicating the accelerated water dissociation kinetics for TiO2—CNQD/CoP-C2 [56]. All these observations suggest that covalently formed TiO2—CNQDs heterostructured support can significantly optimize the water adsorption, dissociation, coupled with interfacial charge transfer in TiO2—CNQD/CoP during the HER process [57].
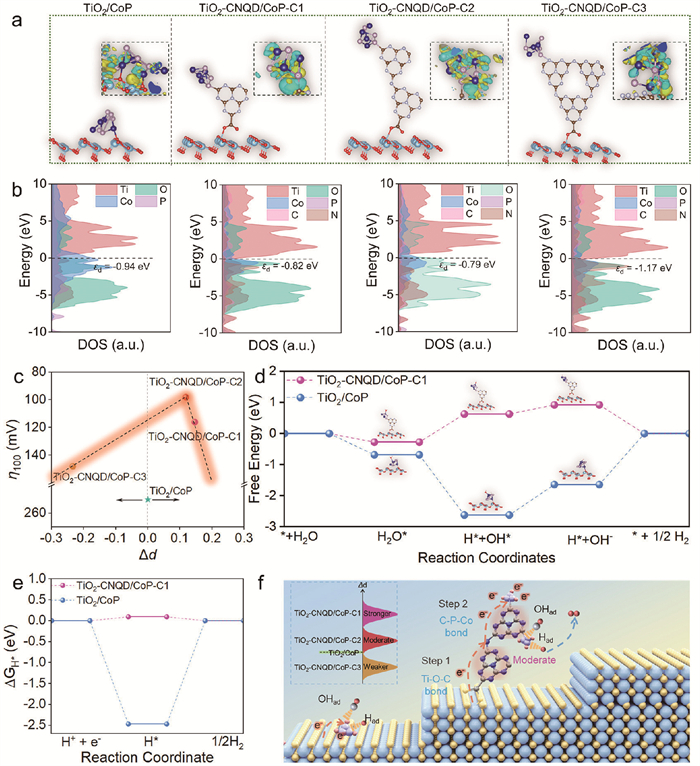
Density functional theory (DFT) calculations were conducted to investigate the CNQD boosted HER mechanism. Based on the experimental results, four models were constructed: TiO2—CNQD/CoP-C1-C3 containing different size of CNQDs, and TiO2/CoP without CNQD as counterpart (Fig. 4a). CNQDs with different number of triazine rings were linked to the (101) plane of TiO2via ester bond, and decorated with CoP through C-P-Co bond in TiO2—CNQD/CoP-C1-C3 series. Charge density difference maps show the electron transfer direction from TiO2 to CNQDs and to CoP (Fig. 4a and Fig. S18 in Supporting information), leading electron accumulation near CoP at the CoP/CNQDs interface, which is consistent with the XPS analysis. As revealed in the density of states (DOS) plots (Fig. 4b), covalently grafting of CNQDs induced more electrons to appear around the Fermi level, which might suggest an improved electronic conductivity to facilitate electron transfer during HER [58].
Figure 4
Figure 4.
(a) DFT-optimized models with the insert charge density difference (yellow: electron accumulation, and cyan: electron depletion). (b) The density of states (DOS) of TiO2/CoP, TiO2—CNQD/CoP-C1, TiO2—CNQD/CoP-C2 and TiO2—CNQD/CoP-C3. (c) Volcano plot of the electronic descriptor Δd vs. overpotential at 100 mA/cm2. (d) Gibbs free energy profiles of TiO2/CoP and TiO2—CNQD/CoP-C1 for alkaline HER. (e) Gibbs free energies of H (ΔGH*) on TiO2/CoP and TiO2—CNQD/CoP-C1. (f) Mechanism illustration of the covalently grafted CNQDs in the heterostructured support enhanced HER.
The projected DOS (PDOS) results show that the d-band center of Co in TiO2—CNQD/CoP-C1-C3 series experiences different shifts relative to that of the TiO2/CoP. To quantify the effect of CNQDs size on the d-band center of Co, a heterostructured support based descriptor, denoted as Δd was introduced. This descriptor is defined as the shift in the Co d-band center relative to the unmodified TiO2/CoP. A volcano-shaped relationship was observed between Δd and the HER performance (Fig. 4c), in which CoP/CNQD-S/TiO2—C2 located at the apex with optimal configuration for balanced H*/OH* adsorption and desorption. It is observed that TiO2—CNQD/CoP-C3 exhibits an opposite direction of Δd with that of TiO2—CNQD/CoP-C1 and TiO2—CNQD/CoP-C2, toward a much deeper d-band center (–1.17 eV). Such observation suggests that CNQDs with moderate size can modulate the d-band center of Co to achieve optimal HER kinetics. Such d-band center modulation could be rationalized to that the conjugated N-heterocycles in CNQDs induced tunable π-electron delocalization depends on the size of CNQDs, which influences the interface electron distribution in TiO2—CNQD/CoP and thus the d-band center of Co.
Considering that all TiO2—CNQD/CoP series exhibit superior electrocatalytic HER performance to TiO2/CoP, the simplest TiO2—CNQD/CoP-C1 was employed as-proof-concept for demonstration. The energy barrier for water dissociation at TiO2—CNQD/CoP-C1 is only 0.9 eV (Fig. 4d), which is much smaller than that of TiO2/CoP (−1.94 eV), indicating a significant acceleration of the Volmer step on the heterostructured interface [59]. TiO2—CNQD/CoP-C1 exhibits favorable OH* and H* adsorption behaviors along the alkaline HER pathway, with a close to zero free energy of hydrogen adsorption (∆GH*) (Fig. 4e). All these observations confirm that the covalently grafted CNQDs to form the heterostructured support modulate the electronic d-band center of Co (Fig. 4f), optimize water dissociation and intermediate H*/OH* adsorption, toward facilitated HER kinetics and boosted electrocatalytic performance.
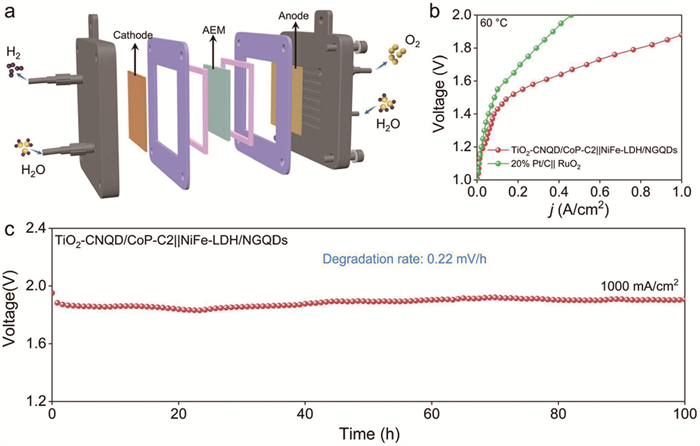
Considering the excellent hydrogen evolution performance of TiO2—CNQD/CoP-C2 in alkaline media, a flow-type AEM electrolyzer was constructed to further investigate its feasibility under actual industrial conditions. The schematic diagram for a typical AEM electrolyzer is shown in Fig. 5a, in TiO2—CNQD/CoP-C2 and our previous work NiFe-LDH/NGQDs serve as the cathode and anode, respectively. Fig. 5b presents the polarization curves measured at 60 ℃ (without iR correction), where the TiO2—CNQD/CoP-C2||NiFe-LDH/NGQDs has a better electrochemical performance than 20% Pt/C||RuO2. The cell voltage increased from 1.88 V to 1.90 V after 100 h at a current density of 1 A/cm2 with a voltage degradation rate of 0.22 mV/h (Fig. 5c). This TiO2—CNQD/CoP-C2||NiFe-LDH/NGQDs AEMWE device demonstrates comparable operational stability (Table S4 in Supporting information), underscoring the promising practical potential in high-efficiency water electrolysis.
Figure 5
Figure 5.
(a) Schematic illustration of a typical anion-exchange membrane (AEM) electrolyzer. (b) Polarization curves of TiO2—CNQD/CoP-C2||NiFe-LDH/NGQDs and 20% Pt/C||RuO2 electrolyzers (without iR correction). (c) Chronopotentiometry curve of the AEM electrolyzer at 1 A/cm2.
In summary, we have developed a heterostructured support based on covalently grafting of CNQDs on TiO2 to anchor CoP clusters as HER electrocatalyst. Benefitting from the tunable size of CNQDs induced controllable degree of π-electron delocalization at the interface, the Co d-band center could be modulated. A descriptor demonstrating the shift of d-band center relative to that of TiO2/CoP (Δd) was proposed and exhibits a volcano-shaped relationship with the HER performance. TiO2—CNQD/CoP-C2 with a moderate CNQD size exhibits an optimal d-band center that favorable for water dissociation, H*/OH* adsorption and HER kinetics, delivering superior HER activity with only 98 mV overpotential to achieve 100 mA/cm2. This work not only provides mechanistic insight into size-dependent interfacial regulation of d-band center via nanosized CNQDs, but also establishes a general strategy for rationally engineering support-catalyst interfaces for heterogeneous electrocatalysis.
Declaration of competing interest
The authors declare that they have no known competing financial interests or personal relationships that could have appeared to influence the work reported in this paper.
Figure 1
(a) Schematic illustration of the synthetic procedure. (b) SEM image, (c) TEM image, (d, e) HRTEM images, (f) HAADF-STEM and elemental mapping of TiO2—CNQD/CoP. (g) XRD patterns of TiO2—CNQD/CoP, TiO2—CNQD/CoP-NC and TiO2/CoP.
Figure 2
(a) FTIR spectra of TiO2—CNQD, TiO2—CNQD/NC, CNQDs and S-TiO2. (b) 13C solid-state NMR spectra of TiO2–CNQD. (c) Zeta potential measurements of TiO2—CNQD, TiO2—CNQD/NC, CNQDs and S-TiO2. (d) Full XPS spectra of TiO2—CNQD/CoP, TiO2—CNQD/CoP-NC and TiO2/CoP. The high-resolution XPS of (e) C 1s and (f) N 1s in TiO2—CNQD/CoP, TiO2—CNQD/CoP-NC and TiO2/CoP, (g) Ti 2p, (h) P 2p and (i) Co 2p in TiO2—CNQD/CoP, TiO2—CNQD/CoP-NC and CoP/TiO2.
Figure 3
(a) LSV curves of CNQDs, TiO2/CoP, and TiO2—CNQD/CoP samples. (b) Tafel slopes, (c) LSV curves normalized by ECSA of TiO2—CNQD/CoP-C1, TiO2—CNQD/CoP-C2, TiO2—CNQD/CoP-C3, TiO2—CNQD/CoP-NC and TiO2/CoP. (d) Comparison of the alkaline HER performance in terms of overpotential (η100), Tafel slope, TOF, Cdl, specific activity, and mass activity at η100. (e) Chronoamperometry measurements of TiO2—CNQD/CoP-C2 TiO2—CNQD/CoP-NC and at the current densities of 0.1 A/cm2. Nyquist plots of (f) TiO2/CoP and (g) TiO2—CNQD/CoP-C2 at various voltages. (h) Schematic of electrode structure and the equivalent circuit. Bode phase plots of (i) TiO2/CoP and (j) TiO2—CNQD/CoP-C2 at various voltages. (k) The H/D KIE values of TiO2/CoP and TiO2—CNQD/CoP-C2 at different potentials.
Figure 4
(a) DFT-optimized models with the insert charge density difference (yellow: electron accumulation, and cyan: electron depletion). (b) The density of states (DOS) of TiO2/CoP, TiO2—CNQD/CoP-C1, TiO2—CNQD/CoP-C2 and TiO2—CNQD/CoP-C3. (c) Volcano plot of the electronic descriptor Δd vs. overpotential at 100 mA/cm2. (d) Gibbs free energy profiles of TiO2/CoP and TiO2—CNQD/CoP-C1 for alkaline HER. (e) Gibbs free energies of H (ΔGH*) on TiO2/CoP and TiO2—CNQD/CoP-C1. (f) Mechanism illustration of the covalently grafted CNQDs in the heterostructured support enhanced HER.
Figure 5
(a) Schematic illustration of a typical anion-exchange membrane (AEM) electrolyzer. (b) Polarization curves of TiO2—CNQD/CoP-C2||NiFe-LDH/NGQDs and 20% Pt/C||RuO2 electrolyzers (without iR correction). (c) Chronopotentiometry curve of the AEM electrolyzer at 1 A/cm2.


 DownLoad:

 下载:
下载:


 下载:
下载:

