Citation:
Wenxiang Zhu, Kui Yin, Mengjie Ma, Qintao Sun, Fan Liao, Hui Huang, Jinxin Chen, Kun Feng, Hao Yang, Jun Zhong, Tao Cheng, Mingwang Shao, Yang Liu, Zhenhui Kang. Carbon-dots-facilitated oxygen migration in heterophase iridium oxide for enhanced acidic water oxidation[J]. Chinese Chemical Letters,
2026, 37(4): 110749.
doi:
10.1016/j.cclet.2024.110749
Carbon-dots-facilitated oxygen migration in heterophase iridium oxide for enhanced acidic water oxidation
English
Carbon-dots-facilitated oxygen migration in heterophase iridium oxide for enhanced acidic water oxidation
zhkang@suda.edu.cn (Z. Kang). 1 These authors contributed equally to this work.
Received Date:
23 September 2024 Accepted Date:
11 December 2024 Revised Date:
06 December 2024 Available Online:
15 April 2026
Abstract:
Water electrolysis for practical applications faces challenges such as slow kinetics of catalysts in oxygen evolution reaction (OER). These can be effectively improved by facilitating the migration of oxygen intermediates at the material's interface. In this work, we employed carbon dots to modify a heterophase Ir-based oxide catalyst (h-IrO2@CDs) to improve their acidic OER performance. Experimental and theoretical studies reveal that CDs enhances oxygen intermediate migration between rutile and 1T phases, enabling a synergistic oxidation pathway. The small amount addition of CDs reduces energy barriers in the rate-determining step and mitigates excessive oxidation, which significantly boost catalytic activity and stability of IrO2@CDs. The optimal h-IrO2@CDs-3 catalyst achieves a low overpotential (161 mV) for 10 mA/cm2 OER current and remains stable for > 762 h at 10 mA/cm2. The low cost and easy synthesis make CDs highly promising for enhancing overall performance in catalytic fields.
Interest in hydrogen production by water electrolysis has surged worldwide in recent years, as a hydrogen-based economy represents one of the best energy alternatives to growing concerns about carbon emissions and climate change [1–10]. Among various water electrolysis technologies, proton exchange membrane (PEM) electrolysis is widely used due to its advantages of high current density, high efficiency and compact device [11–17]. However, the bottleneck of efficient hydrogen production by water electrolysis lies in the oxygen evolution reaction (OER), a key half-reaction with sluggish kinetically due to the high energy required for the four-electron transfer reaction [5,18–26]. A large amount of unnecessary energy consumption hinders the overall efficiency of water splitting [27,28].
The low pH, high oxygen concentration, high potential and presence of water in the anode of PEM lead to a very strong oxidizing environment [2,5,6,13,14,18]. Currently, in practical deployments, only noble metal Ru and Ir-oxide catalysts can withstand the highly corrosive conditions required for water electrolysis [13,18,19,21,24]. Although Ru-oxide catalysts exhibit high initial activity, they are unstable in the OER process, tending to dissolve and inactivate [13,20,24,29]. Ir-oxide-based catalysts, such as Ir black, IrO2 [30,31], IrOx-Ir [32], IrNiOx [33], AD-HN-Ir [34], and Sr2CaIrO6 [29], have been widely used in water electrolysis. Unfortunately, the Ir-based catalyst still encounters issues with low activity and poor stability in strongly acidic media. This is due to the elevated oxidation state of the iridium species and the loss of active surface area over extended operating conditions [35,36]. Excitingly, different phases and surface interface structures regulation can modify the catalytic mechanism and significantly enhance the catalytic performance of Ir-oxide-based catalysts. Ir mixed oxides catalysts exhibit Ir mass specific OER activity comparable to or higher than that of Ir simple monooxides and different combinations of phases may lead to different OER mechanisms [18,37–41]. However, in the OER process, the Ir mixed oxides suffer from structural instability, which undermines the effectiveness of phase engineering. This instability primarily arises because different phases of iridium oxides have varying solubilities in acidic aqueous solutions.
In recent years, carbon dots (CDs) have gained attention as materials for regulating surface interface properties. With particle sizes smaller than 10 nm and abundant oxygen-containing functional groups, CDs can form strong interactions with other materials. This unique combination makes them highly effective in enhancing electrocatalytic activity and stability [42–47]. CDs can serve as an excellent electron donor or electron acceptor, effectively regulating the electron transport behavior in the composite system. These key behaviors give CDs the ability to improve the catalytic efficiency [42,43,46]. Additionally, CDs can further enhance OER catalysis by facilitating charge storage, hydrogen adsorption, and regulating electron transport [44,45,47–49]. However, the impact of CDs on intermediate species during OER has not been reported, particularly the migration of oxygen intermediates, and remains poorly understood.
In this work, we synthesized CDs modified heterophase Ir-based oxide catalysts named h-IrO2@CDs. The h-IrO2@CDs exhibited good catalytic activity and stability for OER in acidic medium media. The CDs act as a "bridge of communication" and tightly combine the 1T phase with the rutile phase in heterophase Ir-based oxide catalysts. The unique mixed-phase structure and the huge surface area of the two-dimensional material provide more active sites. Furthermore, the improved conductivity and adsorption strength of intermediates of h-IrO2@CDs lead to high OER performance. The density functional theory (DFT) calculation shows that after CDs optimization, the oxygen intermediates are more easily transferred from the rutile phase to the 1T phase Ir-based oxide catalysts, which is more conducive to the formation of OOH* in the reaction step, thus speeding up the OER kinetics. At the same time, the easy migration of oxygen intermediates inhibits the excessive oxidation of the Ir active centers in each phase, thereby improving the stability of the structure. As a result, the h-IrO2@CDs-3 catalyst achieves a low overpotential of 161 mV to deliver 10 mA/cm2, together with outstanding stability reaching over 762 h at 10 mA/cm2. Additionally, h-IrO2@CDs-3 also achieves a high mass activity of 620 A/gIr at 1.47 V vs. RHE and a highest TOF value of 1111 h-1 at 1.47 V vs. RHE, which outperforms commercial IrO2 and most recently reported Ir-based catalysts.
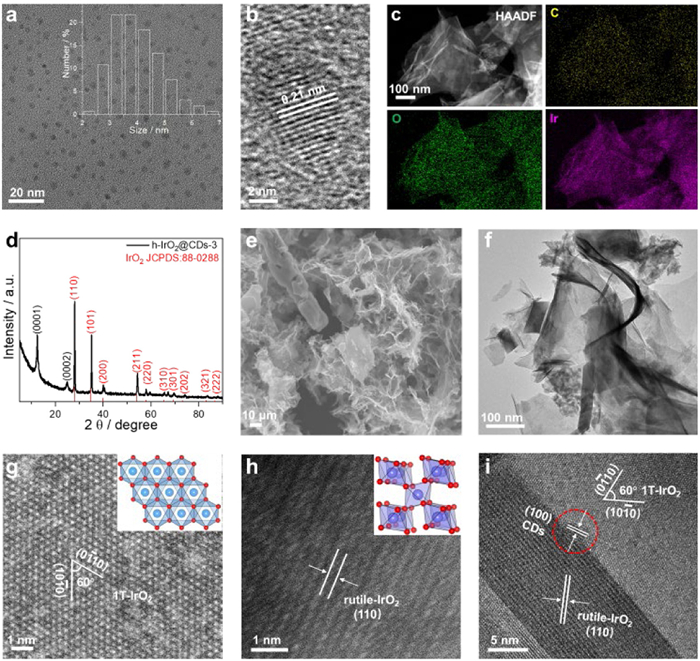
The heterophase IrO2 (h-IrO2) (Fig. S1 in Supporting information) was first fabricated via the proper calcination of the 1T phase IrO2 (1T-IrO2). The transformation of 1T-IrO2 into rutile phase IrO2 (rutile-IrO2) can be induced by high temperature annealing (Figs. S2 and S3 in Supporting information) [50,51]. Next, CDs fabricated by an electrochemical method [44,52] was introduced to h-IrO2. The TEM image and particle size distributions of monodisperse CDs are shown in Fig. 1a, showing that CDs are spherical nanoparticles with a diameter of about 2–7 nm. The HRTEM image shows that CDs are highly crystalline with a lattice spacing of 0.21 nm, matching the (100) lattice planes of graphitic carbon (Fig. 1b).
Figure 1
Figure 1.
Morphological characterizations of h-IrO2@CDs-3. (a) TEM image of CDs. The inset in (a) shows the size distribution of CDs. (b) HRTEM image of CDs. (c) STEM-EDX mapping of h-IrO2@CDs-3. (d) XRD pattern of h-IrO2@CDs-3. (e) SEM and (f) TEM images of h-IrO2@CDs-3. (g) The aberration-corrected high-magnification HAADF-STEM image for 1T phase area in h-IrO2@CDs-3. The inset is the atomic structure of 1T phase IrO2 (blue, Ir of 1T phase in h-IrO2 and red, O). (h) The aberration-corrected high-magnification HAADF-STEM image for rutile phase area in h-IrO2@CDs-3. The inset is the atomic structure of rutile phase IrO2 (purple, Ir of rutile phase in h-IrO2 and red, O). (i) HRTEM image of h-IrO2@CDs-3.
The as-prepared h-IrO2 powder was mixed with CDs and annealed again to obtain the mixed-phase IrO2 and CDs composite (h-IrO2@CDs-3). The functional groups and size of the CDs can potentially influence the acidic OER properties of the composite. After a rigorous performance optimization process, pure CDs were identified as the optimal choice, with an optimized size range of < 10 nm (Fig. S4 in Supporting information). Additionally, the air annealing process notably enhances the acid OER properties of the composite, with the optimal annealing temperature and time determined to be 200 ℃ and 1 h, respectively (Fig. S5 in Supporting information). HAADF-STEM image and the corresponding STEM energy dispersive X-ray spectroscopy (STEH-EDX) element mapping of reveal that C (yellow), Ir (magenta) and O (green) are uniformly distributed throughout the h-IrO2 (Fig. 1c), indicating the successful synthesis of the composite (h-IrO2@CDs-3).
XRD patterns (Fig. 1d) show the sharp Bragg diffraction peaks at 12.8° and 26.1°, corresponding to (0001) and (0002) diffraction planes of 1T-IrO2 with P-3m1 (164) space group [50]. The other diffraction peaks correspond to the rutile phase IrO2 with P42/mnm (136) space group (JCPDS No. 88-0288) [22]. These results also show that both 1T phase and rutile phase exist in h-IrO2 and h-IrO2@CDs-3 (Fig. 1d and Fig. S1a). The XRD patterns exhibit no significant difference in h-IrO2@CDs-3 compared to h-IrO2 due to the low CDs content in the composite [42].
The morphology of the h-IrO2@CDs-3 was characterized SEM and TEM. Figs. 1e and f show that h-IrO2@CDs-3 has two-dimensional sheet structure with a diameter of about 1–2 μm. Atomic resolution HAADF-STEM images reveal that the 1T phase IrO2 (Fig. 1g) and rutile phase IrO2 (Fig. 1h) can be observed from their different crystalline structure, which verify the existence of mixed-phase in the h-IrO2@CDs-3. Since the atomic number of C is much smaller than that of Ir, the CDs is too weak to be clearly observed in atomic resolution HAADF-STEM image, we conducted a bright-field HRTEM analysis. As shown in Fig. 1i, HRTEM image of h-IrO2@CDs-3 shows the (110) plane of rutile-IrO2, (100) plane of CDs and the (1) plane of 1T-IrO2.
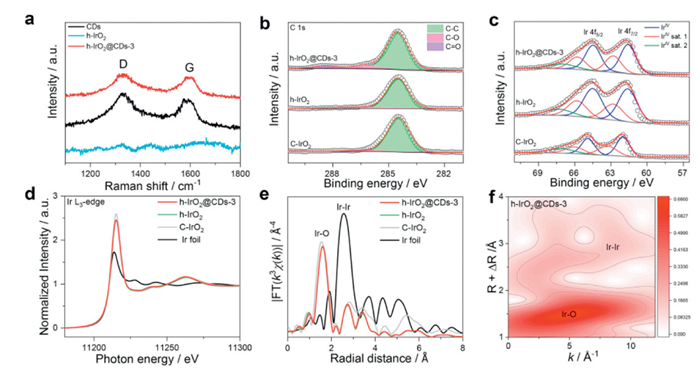
In subsequent experiments, we further characterized the h-IrO2@CDs-3 composite. Fig. 2a shows the Raman spectra of h-IrO2@CDs-3 (red) and CDs (black) with two characteristic peaks at 1326 and 1600 cm−1, corresponding to the D-band caused by sp3 defects and the G-band caused in-plane vibration by sp2 carbon of CDs, respectively. In sum, the above results verify the successful recombination of CDs with h-IrO2 in h-IrO2@CDs-3 [46].
Figure 2
Figure 2.
Structural characterizations of h-IrO2@CDs-3 electrocatalyst and the reference samples. (a) Raman spectra of h-IrO2@CDs-3, h-IrO2 and CDs, respectively. (b) C 1s XPS spectra of h-IrO2@CDs-3, h-IrO2 and C-IrO2. (c) Ir 4f XPS spectra of h-IrO2@CDs-3, h-IrO2 and C-IrO2. (d) Ir L3-edge XANES spectra for h-IrO2@CDs-3, C-IrO2, h-IrO2 and Ir foil. (e) Fourier-transformed EXAFS spectra at Ir L3-edge collected for h-IrO2@CDs-3, C-IrO2, h-IrO2 and Ir foil. (f) Ir L3-edge WT-EXAFS of h-IrO2@CDs-3.
XPS was carried out to investigate the surface electronic structures and surface chemical information of these catalysts. For high-resolution C 1s spectra of h-IrO2@CDs-3 (Fig. 2b), three peaks were observed at 284.5, 286.2, and 288.4 eV, which could be attributed to C-C, C-O, and COOH, respectively [44]. High-resolution C 1s spectra of h-IrO2 and commercial IrO2 (C-IrO2) have only one peak at 284.5 eV corresponding to the C-C. This also indicates the successful recombination of CDs with h-IrO2 in h-IrO2@CDs-3. High-resolution Ir 4f XPS spectra of the rutile phase C-IrO2 reveal doublet peaks at 62.0 and 65.0 eV corresponding to the 4f7/2 and 4f5/2 states of Ir4+, with additional peaks attributed to their satellite peaks (Fig. 2c) [14,53,54]. In contrast, the Ir 4f XPS spectra of h-IrO2 (Fig. 2c) show a negative shift (~0.4 eV) in binding energy compared to C-IrO2, suggesting a decreased oxidation state of Ir [14,21]. The high-resolution Ir 4f XPS spectra of h-IrO2@CDs-3 indicate no significant difference in the oxidation state of Ir compared to h-IrO2 (Fig. 2c).
XPS mainly probes the top few nanometers in materials [55]. In order to gain more comprehensive insights about the bulk electronic structure and local environment [26], we carried out X-ray absorption spectroscopy (XAS) measurements at the Ir L3-edge in h-IrO2@CDs-3, h-IrO2, Ir foil and C-IrO2. The white-line intensity of the Ir L3-edge X-ray absorption near-edge spectroscopy (XANES) spectra usually reveal the valence state of Ir. As shown in Fig. 2d, the average valence states of Ir in h-IrO2@CDs-3 and h-IrO2 are almost the same, consistent with the XPS results discussed earlier. Compared to the C-IrO2, the average valence states of Ir in h-IrO2@CDs-3 is lower than +4. The Fourier transforms of the extended X-ray absorption fine structure (EXAFS) spectra at the Ir L3-edge reveal the coordination structure of h-IrO2@CDs-3 (Fig. 2e), and show a slight increase in Ir-O bond length compared with C-IrO2. The Ir L3-edge FT-EXAFS spectra (Fig. 2e and Fig. S6 in Supporting information) and the wavelet transform (WT) (Fig. 2f and Fig. S7 in Supporting information) for h-IrO2@CDs-3 reveal the length of the first shell Ir-O in h-IrO2@CDs-3 and h-IrO2 are slightly increased compared to that of C-IrO2. The lengthened Ir-O bonds in h-IrO2@CDs-3 catalyst suggest that different phases after mixing synergistically tune the covalency and electronic structures of Ir-O bonds [14]. Excellent electrical conductivity is essential for electrocatalysis. Conductivity measurements were performed using the van der Pauw method [56]. The I-V curves are shown in Fig. S8 (Supporting information). The conductivity of h-IrO2@CDs-3 at 298 K is estimated at 4119 S/cm, which is much higher than those of catalysts.
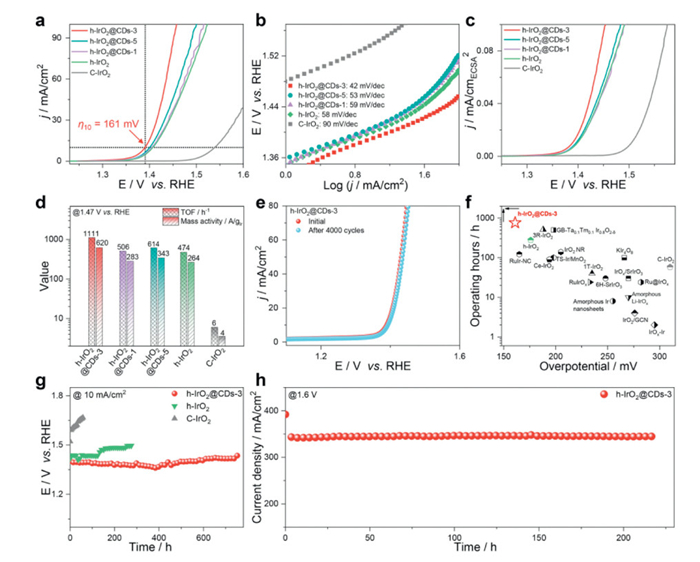
The OER catalytic activities of the as-prepared catalysts and the control samples were examined in an O2-saturated 0.5 mol/L H2SO4 electrolyte using a conventional three-electrode system. The saturated calomel electrode (SCE) reference electrode was first calibrated against the reversible hydrogen electrode (RHE) prior to the electrocatalytic test (Fig. S9 in Supporting information). Fig. 3a shows linear sweep voltammetry (LSV) curves normalized by geometric area, where the incorporation of CDs into h-IrO2 leads to activity enhancement. The sharply rising anodic current related to the OER process appeared at more negative potentials on h-IrO2@CDs-3 compared to the control samples [55]. The associated OER onset potential was ~1.29 V vs. RHE, much lower than those of h-IrO2@CDs-5 (~1.32 V vs. RHE), h-IrO2@CDs-1 (~1.33 V vs. RHE) and h-IrO2 (~1.34 V vs. RHE) (Fig. S10 in Supporting information). Accordingly, it is easier to trigger the OER process on h-IrO2@CDs-3. h-IrO2@CDs-3 stilly represents far superior OER activity to that of the control samples with increasing the current density (Fig. 3a). Excitingly, the overpotential to reach current density at 10 mA/cm2 is only 161 mV on h-IrO2@CDs-3, outperforming h-IrO2@CDs-5 (η = 171 mV), h-IrO2@CDs-1 (η = 175 mV), h-IrO2 (η = 176 mV) and C-IrO2 (η = 310 mV). We measured the LSV curves of pure CDs with the same loading as h-IrO2@CDs-3. As shown in Fig. S11 (Supporting information), the pure CDs exhibit almost no OER performance. We also compared the OER performance of C-IrO2 with C-IrO2@CDs. As depicted in Fig. S12 (Supporting information), the introduction of CDs in C-IrO2 enhances its OER performance, though the improvement is limited. These results reveal that the introduction of a certain number of CDs in h-IrO2 can significantly optimize OER activity, but excess CDs have limited impact on OER performance. Fig. S13 (Supporting information) illustrates the high reproducibility of the OER performance across the h-IrO2@CDs-3 samples, indicating that the OER performance is both consistent and stable.
Figure 3
Figure 3.
OER performance of h-IrO2@CDs-3 electrocatalyst and the references samples. (a) The OER polarization curves of h-IrO2@CDs-3, h-IrO2@CDs-5, h-IrO2@CDs-1, h-IrO2, and C-IrO2 in O2-saturated 0.5 mol/L H2SO4 electrolyte without iR-correction. (b) Tafel plots of h-IrO2@CDs-3, h-IrO2@CDs-5, h-IrO2@CDs-1, h-IrO2, and C-IrO2. (c) Normalized LSV curves to electrochemically active surface area (ECSA) of h-IrO2@CDs-3, h-IrO2@CDs-5, h-IrO2@CDs-1, h-IrO2, and C-IrO2 catalysts. (d) The comparison of TOF and mass activities at 1.47 V vs. RHE for h-IrO2@CDs-3, h-IrO2@CDs-5, h-IrO2@CDs-1, h-IrO2, and C-IrO2. (e) The OER polarization curves of h-IrO2@CDs-3 before and after 4000 CV cycles. (f) The comparison of the required overpotential at 10 mA/cm2 and chronopotentiometry durability at 10 mA/cm2 in acidic media for previous various reported electrocatalysts (Table S2). (g) Chronopotentiometric measurements of h-IrO2@CDs-3, h-IrO2, and C-IrO2 at 10 mA/cm2. (h) Chronoamperometry stability test of h-IrO2@CDs-3 catalyst (with a mass loading of 1.0 mg/cm2) in PEM electrolyser (pure water) at room temperature. And the commercial Pt/C (with a mass loading of 0.7 mg/cm2) was used as the cathode catalyst.
In additional, h-IrO2@CDs-3 also exhibits excellent OER performance over pH 0 and 14, highlighting the universal applicability of our electrocatalysts (Fig. S14 in Supporting information). As depicted in Fig. S15 (Supporting information), we examined the effect of temperature on catalyst performance to evaluate the kinetic barriers involved in the OER. The OER progresses more rapidly at higher temperatures, consistent with the exponential temperature dependence of the chemical rate constant [1]. Besides, the lowest Tafel slope for h-IrO2@CDs-3 (42 mV/dec) indicates that the fastest kinetic velocity compared to h-IrO2@CDs-5 (53 mV/dec), h-IrO2@CDs-1 (59 mV/dec), h-IrO2 (58 mV/dec) and C-IrO2 (90 mV/dec), which probably due to the fast electron hopping on the surface (Fig. 3b) [57,58].
The electrochemical active surface area (ECSA) normalized LSVs were used to assess the intrinsic OER activity of the h-IrO2@CDs-3 and the control catalysts. Specifically, the ECSA of the catalysts can be calculated based on the double layer capacitance (Cdl) extracted from its cyclic voltammetry curves at the different scan rates. As depicted in Fig. S16 and Table S1 (Supporting information), h-IrO2@CDs-3 exhibits the highest ECSA indicate that possessed to expose more active sites after CDs-anchored for enhancing acidic OER activity. And the specific activity of h-IrO2@CDs-3 electrocatalyst still surpassed those of control electrocatalysts when LSV curves normalized by ECSA (Fig. 3c), which further confirming incorporation of CDs into h-IrO2 forming the h-IrO2@CDs-3 boosted the acidic OER.
To further explore the intrinsic activity of the catalysts, the turnover frequency (TOF) of noble metal site was also calculated. h-IrO2@CDs-3 exhibited the highest TOF value of 1111 h-1 at 1.47 V vs. RHE than those of other catalysts (Fig. 3d). These results indicate that the smaller size of CDs can effectively bind different phases of h-IrO2, which is conducive to improving the intrinsic catalytic activity of the catalysts [42,46]. Furthermore, the mass activity at 1.47 V vs. RHE for different electrocatalysts was calculated according to the total loading of Ir metal determined (Fig. 3d). The mass activity of h-IrO2@CDs-3 was 620 A/gIr, which is 1.8, 2.2 and 2.3 times higher than those of h-IrO2@CDs-5 (343 A/gIr), h-IrO2@CDs-1 (283 A/gIr) and h-IrO2 (264 A/gIr), respectively, and superior to that of C-IrO2 (4 A/gIr). These results demonstrate that the introduction of CDs into h-IrO2 enhances its OER kinetics and intrinsic activity.
The durability of the h-IrO2@CDs-3 catalyst in acidic media is also a key parameter for practical water-splitting applications. We used an accelerated degradation test (ADT) to evaluate the electrochemical stability at harsh conditions. As depicted in (Fig. 3e), no discernible drop in its activity loss can be observe when the h-IrO2@CDs-3 is subjected to the OER for up to 4000 cyclic voltammetry (CV) cycles with a scan rate of 100 mV/s. And the Tafel slopes of h-IrO2@CDs-3 before and after ADT are 48 and 56 mV/dec, respectively (Fig. S17 in Supporting information), suggesting the good stability of h-IrO2@CDs-3.
Moreover, the catalytic stability of catalysts during OER was investigated using chronopotentiometry measurements at a constant current density (10 mA/cm2). As shown in Fig. 3g, the C-IrO2 catalyst dramatically lost activity over 58 h. In contrast, the h-IrO2 catalyst maintained a stable voltage for approximately 278 h under identical conditions. These results show that mixed phase and introduction of CDs can improve the stability of catalysts. The h-IrO2@CDs-3 catalyst exhibits far better stability than other catalysts. The OER overpotential (@10 mA/cm2) on h-IrO2@CDs-3 increased by only 33 mV during the 762 h of continuous operation testing. As depicted in Fig. S18 (Supporting information), LSV curve of h-IrO2@CDs-3 catalyst after stability test demonstrated relatively high OER activity even after stability testing. The excellent OER durability of h-IrO2@CDs-3 compared with h-IrO2 clearly indicates the critical role of CDs incorporation.
To validate the stability of the h-IrO2@CDs-3 catalyst, we systematically analyzed the characterizations of h-IrO2@CDs-3 after continuous operation at 10 mA/cm2 (Fig. S19 in Supporting information), supporting the durability of h-IrO2@CDs-3 under oxidative operating conditions. The XPS analysis was performed to confirm the chemical state of h-IrO2@CDs-3 was unchanged after the stability test (Fig. S20 in Supporting information). The structural stability of h-IrO2@CDs-3 during the OER process is further confirmed by in-situ Raman spectroscopy. The in-situ Raman spectra were used to monitor structural changes in h-IrO2@CDs-3 as the OER potential increased (Fig. S21 in Supporting information). As applied potential is increased to 1.50 V vs. RHE, the Ir-O bond stretching modes remained unchanged, and no potential-dependent peaks were observed, indicating the stable Ir-O structure of h-IrO2@CDs-3 throughout the catalytic process [59–61].
In addition, h-IrO2@CDs-3 (mass loading ~1.0 mg/cm2) was used as an anode catalyst in PEM electrolyte (pure water) at room temperature (Fig. 3h). The PEM electrolyzers can achieve current densities of ~345 mA/cm2 at least 220 h by using h-IrO2@CDs-3 catalyst, and the performance of PEM electrolyzer without significant performance degradation. We also compared the OER performance of h-IrO2@CDs-3 with the previously reported OER electrocatalysts in terms of activity, mass activity, and stability at 10 mA/cm2. The h-IrO2@CDs-3 performed better than the state-of-the-art Ru/Ir-based OER electrocatalysts in the reported literature (Fig. 3f and Table S2 in Supporting information). The great stability of h-IrO2@CDs-3 might arise from the unique mixed-phase structures and partial CDs-anchored strengthen the stability of the overall structure and prevents its dissolution and collapse.
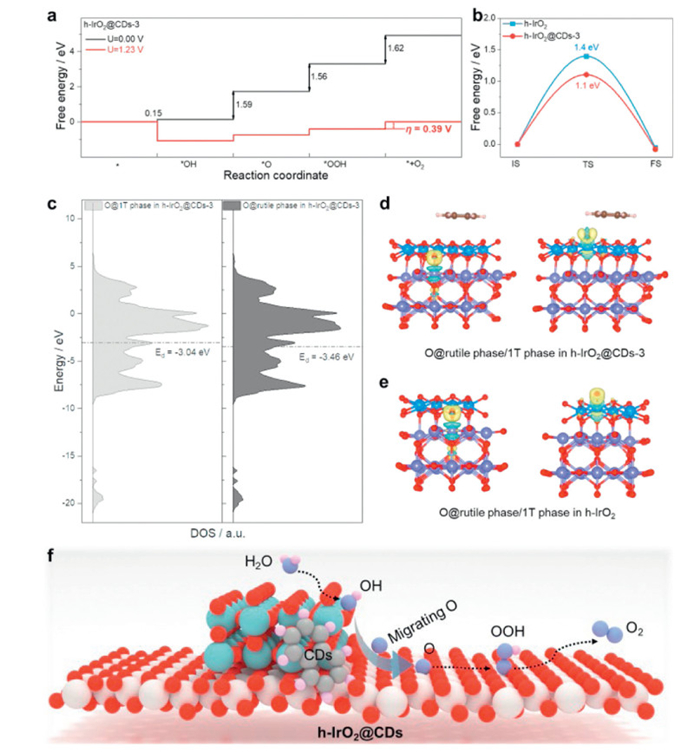
DFT calculations explore the impact of the introduction of CDs on the OER performance of h-IrO2 materials from the perspective of micro-mechanism [62]. Here, we compared the catalytic OER reaction paths of h-IrO2 and h-IrO2@CDs-3 (Fig. 4a, Figs. S22-S24 and Table S3 in Supporting information). The rate-determining step (RDS) of the OER on h-IrO2 is the formation of OOH*, with a calculated overpotential of 0.43 V (Fig. S23). When CDs are introduced, the RDS of OER becomes the step of forming O2, and the calculated overpotential of the reaction is significantly reduced (the calculated overpotential is 0.39 V, Fig. 4a and Fig. S24), which significantly improves the OER performance. Furthermore, as depicted in Fig. 4b, the incorporation of CDs can significantly lower the energy barrier for oxygen migration. This facilitates easier migration of O atoms from rutile phase to the 1T phase, where they can readily participate in the reaction to generate OOH (Fig. S25 in Supporting information) [50,63].
Figure 4
Figure 4.
DFT calculations of h-IrO2@CDs-3. (a) Computed free energy evolution of OER on h-IrO2@CDs-3 catalyst under an electrode potential of 1.23 V. The ƞ value showed the overpotential of the rate-determining step for catalyst. (b) The reactive barrier of oxygen migration process (IS, TS and FS) from rutile phase to 1T phase in h-IrO2@CDs-3 and h-IrO2 catalysts. (c) Projected electronic densities of states (pDOS) and d-band center of 1T phase and rutile phase in h-IrO2@CDs-3. (d) The side view of differential charge densities distribution of O@rutile phase in h-IrO2@CDs-3 (left) and O@1T phase in h-IrO2@CDs-3 (right). Isosurface level: 0.01. (e) The side view of differential charge densities distribution of O@rutile phase in h-IrO2 (left) and O@1T phase in h-IrO2 (right). Isosurface level: 0.01. Purple, Ir of rutile phase in h-IrO2; blue, Ir of 1T phase in h-IrO2; red, O; brown, C, and pink, H. (f) Catalytic mechanism of h-IrO2@CDs catalysts (blue, Ir of rutile phase in h-IrO2; white, Ir of 1T phase in h-IrO2; red, O; brown, C, and pink, H).
More importantly, we also explain from the perspective of electronic structure that the introduction of CDs has an impact on the density of states of the adsorption sites (Fig. 4c and Fig. S26 in Supporting information). The introduction of CDs shifts the D band center (Ed) of the 1T site on the h-IrO2@CDs-3 toward the Fermi level, thereby increasing the electron exchange between the adsorbate and the site, and increasing the bonding part. This is also reflected in the difference of charge density diagram (Figs. 4d and e). When O is adsorbed at the 1T site of the h-IrO2@CDs-3, there are more electron exchange between O and Ir. Such a change in electronic structure enhances the adsorption of O. On the one hand, it makes O more inclined to migrate to the 1T site of h-IrO2@CDs-3, thereby promoting the reaction to proceed more efficiently. On the other hand, it makes the free energy of RDS reaction on the h-IrO2 reduced, thereby reducing the overpotential of OER.
In this work, DFT calculations prove from the perspective of free energy and electronic structure that the introduction of CDs reduces the overpotential of the OER reaction by optimizing the adsorption energy of oxygen species. At the same time, the presence of CDs can further reduce the migration energy barrier for O migration to the 1T phase. This promotes the migration of these intermediates, thereby significantly improving the catalytic efficiency of the OER. In the meantime, the synergistic OER process of rutile phase and 1T phase avoids excessive oxidation of metal sites in each phase, thereby protecting the active center, and the presence of CDs enabled a structure stabilization of heterophase IrO2 matrix (Fig. 4f). In the future, more studies can be carried out to further regulate the adsorption of CDs to O intermediates, such as by regulating the types of functional groups, structural size, and chemical composition.
In summary, the h-IrO2@CDs-3 catalysts exhibit outstanding acidic OER performance, achieving a low overpotential of 161 mV at 10 mA/cm2 and maintaining stability for over 762 h at this current density. The CDs tightly integrate the 1T and rutile phases in the h-IrO2 catalysts. This integration enhances both the adsorption strength of intermediates and the migration of oxygen intermediates, leading to improved OER performance. The DFT calculation shows that CDs facilitate oxygen intermediate migration from rutile to 1T phases, promoting OOH* formation and accelerating OER process. And the migration of oxygen intermediates process also prevents excessive oxidation of the metal sites in each phase and stabilizing the heterogeneous IrO2 matrix structure.
Declaration of competing interest
The authors declare that they have no known competing financial interests or personal relationships that could have appeared to influence the work reported in this paper.
Acknowledgments
This work is supported by Natural Science Foundation of Jiangsu Province (Nos. BK20220028, BK20230065), National Natural Science Foundation of China (Nos. 52272043, 52271223, 52302296, 52472049, 52472230, 22103054 and 22173066), The Science and Technology Development Fund, Macau SAR (No. 0009/2022/ITP), State Key Laboratory of Catalysis (No. 2024SKL-A-014), Collaborative Innovation Center of Suzhou Nano Science & Technology, the 111 Project, and Suzhou Key Laboratory of Functional Nano & Soft Materials. We acknowledge the support from SSRF (14W) for the XAS experiments.
Supplementary materials
Supplementary material associated with this article can be found, in the online version, at doi:10.1016/j.cclet.2024.110749.
[1]
B. Zhang, X. Zheng, O. Voznyy, et al., Science 352 (2016) 333–337. doi: 10.1126/science.aaf1525
[2]
Z.W. Seh, J. Kibsgaard, C.F. Dickens, et al., Science 355 (2017) eaad4998. doi: 10.1126/science.aad4998
[3]
S.J. Davis, N.S. Lewis, M. Shaner, et al., Science 360 (2018) eaas9793. doi: 10.1126/science.aas9793
Figure 1
Morphological characterizations of h-IrO2@CDs-3. (a) TEM image of CDs. The inset in (a) shows the size distribution of CDs. (b) HRTEM image of CDs. (c) STEM-EDX mapping of h-IrO2@CDs-3. (d) XRD pattern of h-IrO2@CDs-3. (e) SEM and (f) TEM images of h-IrO2@CDs-3. (g) The aberration-corrected high-magnification HAADF-STEM image for 1T phase area in h-IrO2@CDs-3. The inset is the atomic structure of 1T phase IrO2 (blue, Ir of 1T phase in h-IrO2 and red, O). (h) The aberration-corrected high-magnification HAADF-STEM image for rutile phase area in h-IrO2@CDs-3. The inset is the atomic structure of rutile phase IrO2 (purple, Ir of rutile phase in h-IrO2 and red, O). (i) HRTEM image of h-IrO2@CDs-3.
Figure 2
Structural characterizations of h-IrO2@CDs-3 electrocatalyst and the reference samples. (a) Raman spectra of h-IrO2@CDs-3, h-IrO2 and CDs, respectively. (b) C 1s XPS spectra of h-IrO2@CDs-3, h-IrO2 and C-IrO2. (c) Ir 4f XPS spectra of h-IrO2@CDs-3, h-IrO2 and C-IrO2. (d) Ir L3-edge XANES spectra for h-IrO2@CDs-3, C-IrO2, h-IrO2 and Ir foil. (e) Fourier-transformed EXAFS spectra at Ir L3-edge collected for h-IrO2@CDs-3, C-IrO2, h-IrO2 and Ir foil. (f) Ir L3-edge WT-EXAFS of h-IrO2@CDs-3.
Figure 3
OER performance of h-IrO2@CDs-3 electrocatalyst and the references samples. (a) The OER polarization curves of h-IrO2@CDs-3, h-IrO2@CDs-5, h-IrO2@CDs-1, h-IrO2, and C-IrO2 in O2-saturated 0.5 mol/L H2SO4 electrolyte without iR-correction. (b) Tafel plots of h-IrO2@CDs-3, h-IrO2@CDs-5, h-IrO2@CDs-1, h-IrO2, and C-IrO2. (c) Normalized LSV curves to electrochemically active surface area (ECSA) of h-IrO2@CDs-3, h-IrO2@CDs-5, h-IrO2@CDs-1, h-IrO2, and C-IrO2 catalysts. (d) The comparison of TOF and mass activities at 1.47 V vs. RHE for h-IrO2@CDs-3, h-IrO2@CDs-5, h-IrO2@CDs-1, h-IrO2, and C-IrO2. (e) The OER polarization curves of h-IrO2@CDs-3 before and after 4000 CV cycles. (f) The comparison of the required overpotential at 10 mA/cm2 and chronopotentiometry durability at 10 mA/cm2 in acidic media for previous various reported electrocatalysts (Table S2). (g) Chronopotentiometric measurements of h-IrO2@CDs-3, h-IrO2, and C-IrO2 at 10 mA/cm2. (h) Chronoamperometry stability test of h-IrO2@CDs-3 catalyst (with a mass loading of 1.0 mg/cm2) in PEM electrolyser (pure water) at room temperature. And the commercial Pt/C (with a mass loading of 0.7 mg/cm2) was used as the cathode catalyst.
Figure 4
DFT calculations of h-IrO2@CDs-3. (a) Computed free energy evolution of OER on h-IrO2@CDs-3 catalyst under an electrode potential of 1.23 V. The ƞ value showed the overpotential of the rate-determining step for catalyst. (b) The reactive barrier of oxygen migration process (IS, TS and FS) from rutile phase to 1T phase in h-IrO2@CDs-3 and h-IrO2 catalysts. (c) Projected electronic densities of states (pDOS) and d-band center of 1T phase and rutile phase in h-IrO2@CDs-3. (d) The side view of differential charge densities distribution of O@rutile phase in h-IrO2@CDs-3 (left) and O@1T phase in h-IrO2@CDs-3 (right). Isosurface level: 0.01. (e) The side view of differential charge densities distribution of O@rutile phase in h-IrO2 (left) and O@1T phase in h-IrO2 (right). Isosurface level: 0.01. Purple, Ir of rutile phase in h-IrO2; blue, Ir of 1T phase in h-IrO2; red, O; brown, C, and pink, H. (f) Catalytic mechanism of h-IrO2@CDs catalysts (blue, Ir of rutile phase in h-IrO2; white, Ir of 1T phase in h-IrO2; red, O; brown, C, and pink, H).

 DownLoad:

 下载:
下载:


 下载:
下载:
