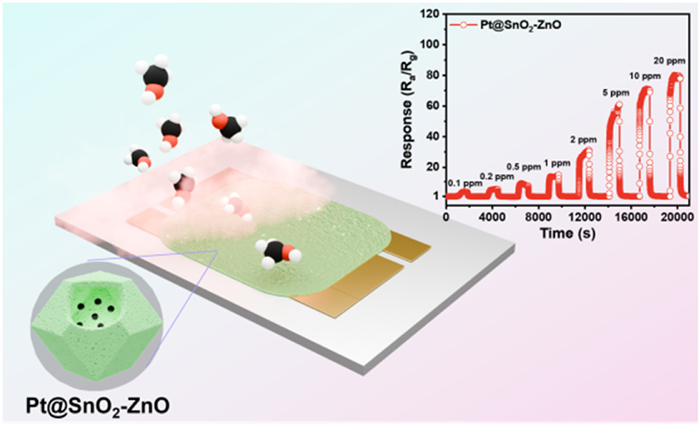
Scheme 1.
The schematic illustration of the preparation and sensing process of Pt@SnO2-ZnO based sensor.

Enhanced methanol sensing performance of Pt@SnO2-ZnO core-shell structure derived from Sn/Zn-ZIF-8 framework
Hui Zhang , Haichao Wang , Jijie Zhang , Da-Shuai Zhang , Mei-Hui Yu , Ze Chang , Xian-He Bu


Methanol, a member of the volatile organic compounds (VOCs), serves as a typical basic material within the chemical industry [1,2]. It is widely used as solvent, cost-effective reagent and sustainable feedstock in the pharmaceutical, agricultural and biological fields. Despite its wide range of utility, methanol poses a significant health risk due to the properties of neurotoxicity and hematotoxicity, which can lead to symptoms such as headaches, metabolic acidosis, vision impairment, and in severe cases, even fatal consequences [3,4]. In addition, the toxicity of methanol is exacerbated by its metabolic conversion to formaldehyde and formic acid, which in turn have adverse health effects. Hence, it is particularly important to develop a real-time sensor to monitor the concentration of methanol vapor in the air. On the other hand, methanol has received comparatively less attention compared to ethanol, acetone, formaldehyde and toluene, which is an urgent demand for the fast, convenient and stable sensors for methanol detection [5–8].
Semiconductor metal oxides (SMOs), as prevalent materials in gas-sensing applications, have garnered extensive research attention. To date, numerous strategies have been proposed to enhance the sensing performance of SMOs based gas sensors [9,10]. The decoration of SMOs using noble metals particles (such as Pd, Pt, Au, Ag) has emerged as one of the effective means for sensitization [11–17]. In 1967, Shaver et al. first found that the Pt-modified tungsten trioxide (WO3) was effective in improving its response-recovery rate to hydrogen. This discovery has since stimulated the development of the gas-sensing materials adorned with noble metal enhancements [18].
The catalytic efficacy of noble metals is widely recognized to be significantly influenced by particle size, with smaller particles generally demonstrating superior catalytic properties. In noble metal-modified gas-sensing materials prepared by conventional methods, the noble metal particles are usually dispersed on the surface of metal oxides with high surface energy. With the working temperature increasing or the working time lengthening, the noble metal particles tend to aggregate, which results in the reduction of the catalytic activity of the noble metal particles [19]. To address this limitation, the noble metal@metal oxides featuring core-shell structures have been developed with the following two advantages: (1) Preventing the aggregation of noble metal particles and maximizing the catalytic activity of noble metal, (2) expanding the interface contact area between noble metal particles and metal oxides to generate more active sites, which could enhance the interaction between different components and promotes the electron transfer [20]. Metal-organic frameworks (MOFs) are good matrix for ultrafine noble metal nanoparticles due to the high porosity and cavity structure [21–25]. Upon thermal decomposition, noble metal particles loaded MOFs can be readily transformed into core-shell structured SMOs functionalized by uniformly dispersed noble metal catalysts (metals and/or their oxides), whose catalytic effect leads to effective improvement of sensing performance [26].
Herein, a strategy is proposed for the construction of noble metals particles decorated SMOs featuring optimized gas sensing performance through the derivation of MOFs. By utilizing Sn/Zn-ZIF-8 framework as precursor to encapsulate Pt nanoparticles (NPs) followed by calcination, a core-shell structure of SnO2-ZnO encapsulated with Pt NPs (Pt@SnO2-ZnO) was successfully constructed. Due to the presence of Pt nanoparticles (NPs), the sensing performance of the gas-sensing material for methanol is greatly improved (Scheme 1). Compared with SnO2-ZnO, the Pt@SnO2-ZnO core-shell structure exhibited significantly enhanced response (73.46) towards 10 ppm methanol at 320 ℃ and exceptionally low theoretical detection limit (0.18 ppb). The improved sensing performance for methanol is mainly attributed to (1) the chemical and electronic sensitization of Pt NPs and (2) the core-shell structure that avoids the aggregation of Pt NPs. The method described here for noble metal@metal oxides with core-shell structure derived from noble metal-modified MOF precursors provides a general strategy for constructing gas sensors with excellent sensing performance towards methanol.
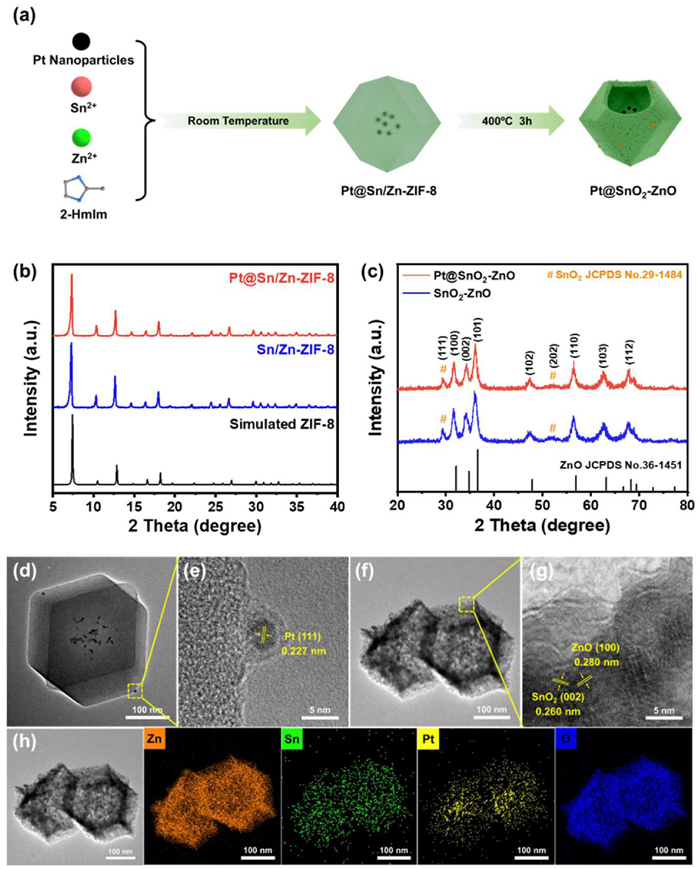
The formation process of Pt@SnO2-ZnO and the corresponding morphological changes are shown in Fig. 1a. Firstly, Zn(NO3)2·6H2O, SnCl2·2H2O and Pt NPs were successively dissolved in methanol and then stirred together with a methanol solution containing 2-HmIm at room temperature. The Pt NPs were encapsulated into the dodecahedron crystal during the self-assembly formation of bimetallic Sn/Zn-ZIF-8. The prepared precursor samples were analyzed by PXRD to confirm the crystal structure and chemical composition after encapsulation of Pt NPs in the bimetallic MOF. As depicted in Fig. 1b, the characteristic diffraction peaks of the Pt@Sn/Zn-ZIF-8 and Sn/Zn-ZIF-8 samples coincide with the positions of the PXRD diffraction peaks of the simulated ZIF-8, indicating that the introducing of Sn2+ and the encapsulation of Pt NPs inside the crystal does not induce any alterations to the crystallographic structure. The Pt@SnO2-ZnO core-shell structure were obtained after pyrolysis at the optimized temperature of 400 ℃ for 3 h under air atmosphere. The PXRD pattern of the pyrolyzed samples is presented in Fig. 1c, and the diffraction peaks at 31.78°, 34.34°, and 36.28° can be attributed to the (100), (002), and (101) crystal planes of the ZnO (JCPDS No. 36–1451), respectively. In addition, the diffraction peak at 29.36° is assignable to the (111) crystal face of orthorhombic SnO2 (JCPDS No. 29-1484), and no additional impurity peaks were observed, suggesting that the Pt@Sn/Zn-ZIF-8 precursor has been successfully converted into Pt@SnO2-ZnO during the heat treatment process [27]. However, the characteristic peaks of Pt were not detected in the diffractograms, which may be due to the low content of Pt NPs.
The morphologies of the samples (Pt@ZIF-8, Sn/Zn-ZIF-8 and Pt@Sn/Zn-ZIF-8, Pt@ZnO, SnO2-ZnO and Pt@SnO2-ZnO) were observed using scanning electron microscopy (SEM) (Fig. S1 in Supporting information). It can be found that the morphology of Pt@ZIF-8 (Fig. S1a) after encapsulating Pt NPs is basically the same to that of ZIF-8. Moreover, Sn/Zn-ZIF-8 (Fig. S1b) and Pt@Sn/Zn-ZIF-8 (Fig. S1c) exhibit similar polyhedral morphology, which proves that the encapsulated Pt NPs do not disrupt the morphology of Sn/Zn-ZIF-8. Upon undergoing a calcination process, Pt@ZnO (Fig. S1d) could not maintain the polyhedral morphology and changed into smaller-sized nanoparticles. Conversely, SnO2-ZnO and Pt@SnO2-ZnO (Figs. S1e and f) retained the polyhedral morphology as their precursors. However, a comparison of the particle sizes indicates a reduction relative to the precursors [28–30].
The microstates of the samples and the distribution of Pt NPs within the samples were further investigated by TEM. The PVP-treated Pt NPs are well-dispersed and the particle size is around 5 nm (Fig. S2a in Supporting information). The HRTEM image of Fig. S2b (Supporting information) clearly shows a crystallographic spacing of 0.225 nm, which corresponds to the (111) crystallographic plane of the Pt NPs. It should be noted that the amount of Pt NPs encapsulated in Pt@ZIF-8 is relatively low, as shown in Fig. S2c (Supporting information), which may be due to the high nucleation rate of ZIF-8, resulting in the encapsulate and dispersion of Pt NPs into massive crystals [31]. As a result, the Pt NPs could hardly be observed in the TEM images of the samples obtained after pyrolysis (Fig. S2d in Supporting information). However, the Sn/Zn-ZIF-8 precursor and its derivatives exhibited a dodecahedral morphology (Figs. S2e and f in Supporting information), and the successful encapsulation of Pt NPs within the polyhedral structures of Pt@SnO2-ZnO could be readily observed and confirmed.
The spatially confined domains of Pt NPs were realized by encapsulating them in the crystal of the bimetallic MOF precursor, which can be clearly observed from Fig. 1d. The HRTEM image of the Pt@Sn/Zn-ZIF-8 obtained from the selected region (Fig. 1e) showed a lattice spacing of 0.227 nm corresponding to the (111) crystal plane of the Pt NPs, further confirming that the Pt NPs were encapsulated inside the bimetallic MOF particles [32]. The sample Pt@SnO2-ZnO obtained after pyrolysis maintained the hollow polyhedral structure of the precursor (Fig. 1f), and the lattice spacing of 0.280 nm and 0.260 nm can be observed from Fig. 1g, which corresponds to the (100) plane of ZnO and the (002) plane of orthorhombic SnO2, respectively [27]. Since most of the Pt NPs existed in the internal cavities of the polyhedral and it was difficult to observe the corresponding lattice stripes, the distribution of Pt NPs in the pyrolysis products was further investigated via energy dispersive spectrometer (EDS). It can be clearly observed that Zn, Sn and O elements are uniformly distributed throughout the polyhedral, while Pt NPs are relatively concentrated in the interior of the composites (Fig. 1h) [33]. This proves that the core-shell structure of Pt@SnO2-ZnO was successfully constructed.
The porosity properties of SnO2-ZnO and Pt@SnO2-ZnO were demonstrated by N2 adsorption-desorption isotherms (Fig. 2a and Fig. S3 in Supporting information). The specific surface areas of SnO2-ZnO and Pt@SnO2-ZnO were 26.57 and 34.17 m2/g, respectively. The pore sizes were calculated using the Barret-Joyner-Halenda (BJH) model, confirming the presence of micropores and mesopores [34]. To elucidate the effect of Pt NPs in the formation of bimetallic MOF derivatives, the thermal stability of Sn/Zn-ZIF-8 and Pt@Sn/Zn-ZIF-8 samples were analyzed. The sharp weight loss in Fig. 2b can be attributed to the decomposition of organic ligands. Notably, the sharp weight loss temperature of Pt@Sn/Zn-ZIF-8 (432 ℃) is lower than that of the Sn/Zn-ZIF-8 (447 ℃), suggesting the relatively lower thermal stability of Pt@Sn/Zn-ZIF-8. The Pt NPs may have catalyzed the pyrolysis of the Pt@Sn/Zn-ZIF-8 in air, inducing the collapse of more micropores and the rapid formation of mesopores [35].
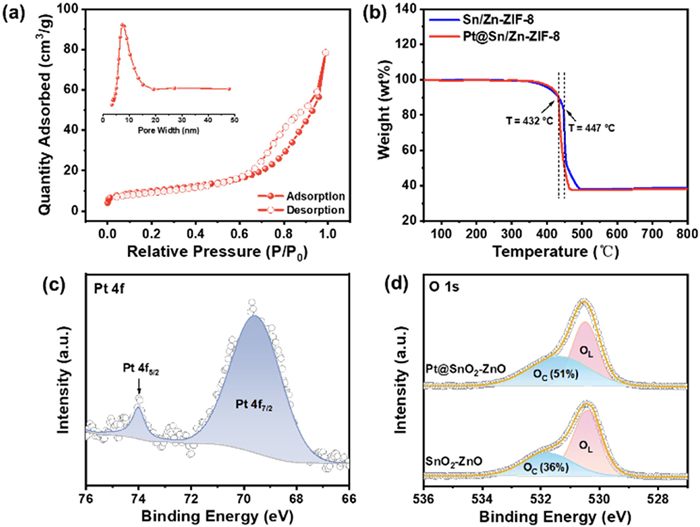
To investigate the surface chemical states of Pt@SnO2-ZnO and SnO2-ZnO, X-ray photoelectron spectroscopy (XPS) spectra were recorded (Fig. S4 in Supporting information). For the Pt@SnO2-ZnO, the peaks at 69.55 eV and 74.01 eV correspond to Pt 4f7/2 and Pt 4f5/2 respectively, which is consistent with the peak of platinum metal (Fig. 2c) [36]. In Fig. S5a (Supporting information), the two peaks at 1021.82 eV and 1044.86 eV can be respectively labelled as Zn 2p3/2 and Zn 2p1/2, which correspond to Zn(Ⅱ) ions [37]. In the Sn 3d spectra, the peaks at 486.66 and 495.01 eV correspond to Sn 3d5/2 and Sn 3d3/2, respectively, suggesting the presence of Sn(Ⅳ) ions (Fig. S5b in Supporting information) [38]. The Zn 2p peaks and Sn 3d peaks for Pt@SnO2-ZnO did not exhibit significant shifts compared to that of SnO2-ZnO. As for the SnO2-ZnO, the presence of Zn(Ⅱ) and Sn(Ⅳ) were confirmed by Zn 2p spectra and Sn 3d spectra (Figs. S5c and d in Supporting information). The oxygen species of the Pt@SnO2-ZnO and SnO2-ZnO were characterized using O 1s spectra (Fig. 2d). The peaks for both materials could be categorized into lattice oxygen and surface adsorbed oxygen according to the results. The Pt@SnO2-ZnO exhibited the higher surface adsorbed oxygen contents (51%) compared to SnO2-ZnO (36%). Subsequently, the metal-atom ratios of the materials were calculated and listed in Table S1 (Supporting information). It can be found that the atomic ratio of Sn increases as the Pt NPs were encapsulated into the dodecahedron.
To evaluate the sensing performance of Pt@SnO2-ZnO for methanol detection, gas sensors were constructed with SnO2-ZnO and Pt@SnO2-ZnO composites as sensing materials, respectively, and their gas-sensing performance were tested. Fig. 3a shows the response curves of the gas sensors for 10 ppm methanol at different operating temperatures (180–350 ℃). It is easy to find that the sensitivity of the sensor shows a volcano pattern of increasing and then decreasing with the change of operating temperature. At temperatures suboptimal to the threshold, the kinetics of gaseous adsorption, diffusion, and reaction at the material surface, as well as the subsequent desorption, are markedly slowed, leading to attenuated sensor responses. Conversely, when the temperature exceeds the optimal level, the desorption process is accelerated to the point where it outpaces the adsorption, resulting in a sharp decline in sensor response from its maximum value. It was determined that the optimum operating temperature for SnO2-ZnO and Pt@SnO2-ZnO based sensors is 320 ℃. For the SnO2-ZnO based sensor, the maximum response value of 25.74 for 10 ppm methanol is observed, while the sensitivity of the Pt@SnO2-ZnO based sensor for 10 ppm methanol can reach up to 73.60, which is the 2.86 times increased. In addition, the baseline resistances of SnO2-ZnO and Pt@SnO2-ZnO based sensors at different test temperatures are displayed in Fig. 3b. The baseline resistance of the sensors decreases with increasing test temperature, which is in line with the trend of the resistance of semiconductors with temperature.
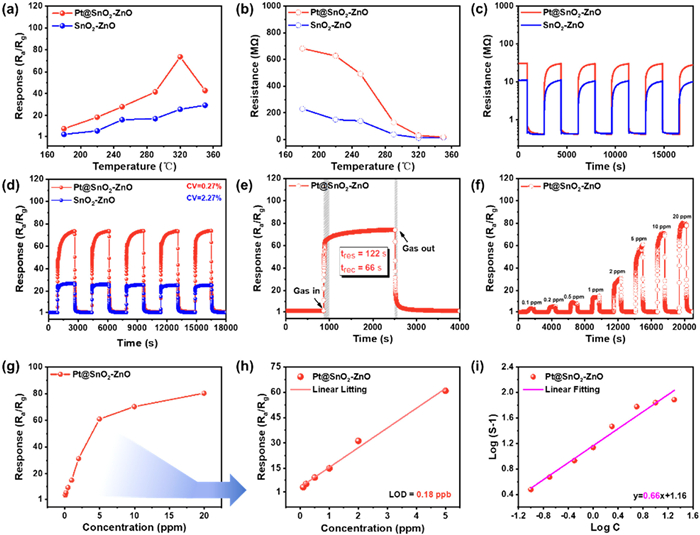
The cyclic resistance response curves of the Pt@SnO2-ZnO and SnO2-ZnO based gas sensors to 10 ppm methanol at 320 ℃ are shown in Fig. 3c. As can be seen from the graphs, both gas sensors display the typical n-type semiconducting sensing behavior, wherein the sensor resistance decreases upon exposure to the reducing gas and subsequently reverts to its initial value upon reintroduction to air. The baseline resistance of the Pt@SnO2-ZnO based gas sensor (30.0 MΩ) is higher than that of the SnO2-ZnO based gas sensor (12.7 MΩ). This is because the spillover effect of the noble metal Pt causes more oxygen molecules to be ionized into oxygen ions by the adsorbed electrons on the trapping conduction band on the material surface, resulting in a thicker electron depletion layer, which is manifested as a high baseline resistance [18,39]. The high baseline resistance is favorable to obtain high responses, and thus the responses of the Pt@SnO2-ZnO based sensor are higher compared to the SnO2-ZnO based sensor (Fig. 3d). After the decoration with Pt NPs, the coefficient of variation (CV) of the composite decreased from 2.27% to 0.27%, indicating that the response stability of the Pt@SnO2-ZnO has been improved. The response-recovery time is labeled in Fig. 3e, and the response time and recovery time of the Pt@SnO2-ZnO based sensor for 10 ppm methanol at 320 ℃ were 122 s and 66 s, respectively.
In practical applications, real-time detection of combustible and toxic gases is important. Therefore, the dynamic response curves of the Pt@SnO2-ZnO and SnO2-ZnO based sensors for methanol in the concentration range of 0.1–20 ppm at the optimal operating temperature (Fig. 3f, Figs. S6a and b in Supporting information) were investigated, respectively. The curves indicate that both sensors have good response-recovery performance, with the magnitude of the response being directly proportional to the concentration of methanol. Notably, the responses of the Pt@SnO2-ZnO based sensor to methanol were consistently surpass those of the SnO2-ZnO based sensor, which might be related to the encapsulated Pt NPs. Furthermore, the response of the Pt@SnO2-ZnO based sensor exhibits a sharp increase with rising methanol concentrations within the range of 0.1–5 ppm (Fig. 3g). In contrast, the SnO2-ZnO based sensor demonstrates a rapid response increase within a narrower concentration range of 0.1–2 ppm (Fig. S6b). This comparison suggests that the surface of the Pt@SnO2-ZnO has a greater adsorption capacity for methanol gas molecules. Even at 0.1 ppm methanol, the Pt@SnO2-ZnO based sensor achieved a response of 3.99 (Fig. S6 in Supporting information), which is below the experimental limit of detection concentration for the reported gas-sensing material in Table 1. The responses of the Pt@SnO2-ZnO and SnO2-ZnO based sensors were linearly fitted to the data of methanol gas concentration (Fig. 3h and Fig. S6c). The results of the fitting can be used to further investigate the limiting concentration of the sensor for the methanol detection, the following equation was used to calculate the theoretical limit of detection (LOD) of the gas sensor:
|
|
(1) |

 DownLoad:
CSV
DownLoad:
CSV
| Gas sensor | T (℃) | Conc. (ppm) | Response | Response/recovery time | Experimental minimum conc. (ppm)/response | Ref. |
| Pt@SnO2-ZnO | 320 | 10 | 73.6 | 122 s/66 s | 0.1/3.99 | This work |
| F-V2CTx/ZIF-67 | 25 | 10 | 7.75 | 3 s/12 s | 1/1.12 | [40] |
| 2D Cu(I) CP | 27 | 100 | 66.7 | 17.5 s/34.2 s | 0.25/3 | [41] |
| Indium tungsten oxide | 312 | 400 | 12 | 2 s/9 s | 20/1.95 | [42] |
| Nano-spindle like In2O3 | 240 | 100 | 27 | < 1 s/10 s | 10/1.3 | [43] |
| Zeolite/Pd-WO3 | 350 | 30 | 53 | – | 2/~2 | [44] |
| Pt-SnO2 | 80 | 100 | 190.88 | 10 s/10 s | 5/24.85 | [45] |
| SnS/SnS2 | 25 | 25 | 14.85 | 8 s/- | 0.1/1.14 | [46] |
where S0 is the standard deviation of the blank response value tested in the absence of the target gas and m is the slope of the linear fit equation. The calculated LOD for the Pt@SnO2-ZnO and SnO2-ZnO based sensors were 0.18 ppb and 0.49 ppb, respectively, indicating the potential of Pt@SnO2-ZnO based sensors for the detection of extremely low concentration of methanol.
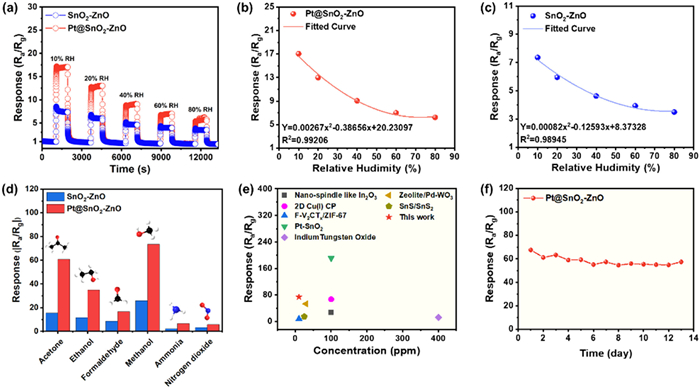
Humidity interference is also a critical consideration in gas detection. Fig. 4a illustrates the sensing behaviors of Pt@SnO2-ZnO and SnO2-ZnO based sensors for 10 ppm methanol at varying levels of different relative humidity. When the relative humidity is increased by 10%, the response of the sensor immediately decreases dramatically, which may be due to the fact that water molecules can occupy the active sites on the surface of the sensing material, interfering with the adsorption of methanol molecules [47]. Nevertheless, even at 80% relative humidity, the Pt@SnO2-ZnO based sensor sustains a response value of 6.22, suggesting the potential for use in practical situations. As shown in Figs. 4b and c, the relationship between the responses of Pt@SnO2-ZnO and SnO2-ZnO based sensors and the relative humidity was well fitted with quadratic functions, making the proposed method for quantitative analysis of methanol gas possible. To gauge the selectivity of the sensors, the response of sensors to 10 ppm acetone, ethanol, formaldehyde, ammonia, and nitrogen dioxide was tested at 320 ℃, respectively (Fig. 4d). The summarized outcomes for the Pt@SnO2-ZnO based sensors evidence its heightened selectivity for methanol, outperforming the sensor responses to other test gases. The corresponding selectivity coefficients are listed in Table S2 (Supporting information). Compared with other gas-sensing materials towards methanol in Fig. 4e, the Pt@SnO2-ZnO exhibit superior sensing response for low concentrations of methanol. Moreover, the results of long-term stability tests displayed that the Pt@SnO2-ZnO based sensor showed good stability over 14 days (Fig. 4f).
The sensing characteristics of semiconductor gas sensors are profoundly influenced by the surface reaction mechanism. The band structure of Pt@SnO2-ZnO is shown in Fig. S7 (Supporting information). When the gas sensor is exposed to air, oxygen molecules adsorb on the surface of the gas-sensing material, trapping electrons from the conduction band for ionization into adsorbed oxygen ions, leading to the formation of a thicker electron depletion layer. The result is an increase in the baseline resistance of the gas-sensing material. It has been reported that the type of oxygen adsorbed on the surface of a material can be explained by Eq. 2 shown below:
|
|
(2) |
where a and b are constants, S is the response value, and C is the concentration of the target gas [48]. The value of b around 0.5 or 1 corresponds to the adsorption of the surface oxygen species O2− or O−, respectively. The b value of Pt@SnO2-ZnO is about 0.66, which is close to 0.5, indicating that the main absorbed surface oxygen species is O2− (Fig. 3i). Once methanol gas is injected, the oxygen ions adsorbed on the surface of the material react with the methanol gas, and then release the electrons back to the conduction band of the gas-sensing material, which results in the formation of narrower electron depletion layer and the consequent decrease in the resistance of the sensor (Fig. 5). The chemical reactions involved at the surface of the gas-sensing material are as follows:
|
|
(3) |
|
|
(4) |
|
|
(5) |
|
|
(6) |
|
|
(7) |
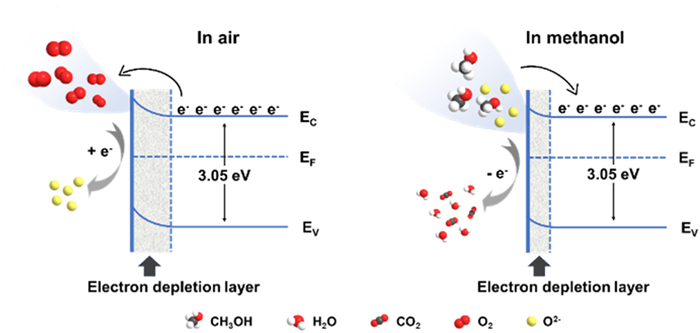
In this work, the enhanced sensing performance of the Pt@SnO2-ZnO based gas sensor for methanol can be attributed to several factors. Firstly, Platinum occupying the 5d state has been reported to decrease the adsorption and activation energies of the material to the target gas, thus promoting the sensitivity of gas-sensing material. When the Pt@SnO2-ZnO were exposed to air, more oxygen molecules could be decomposed into chemisorbed oxygen ions due to the spillover effect of Pt NPs. This augments the surface reaction between the material and oxygen, leading to more vigorous redox reactions with methanol molecules [49]. Secondly, core-shell structure plays a crucial role in preventing the aggregation of Pt NPs within the limited space, which can greatly utilize the catalytic effect of Pt NPs. As a result, the response of the Pt@SnO2-ZnO based gas sensor to methanol was significantly improved compared with that of the SnO2-ZnO-based gas sensor under the same conditions.
Benefiting from the chemical and electronic sensitization of the noble metal platinum, bimetallic Sn/Zn-ZIF-8 derivatives consisting of encapsulated Pt NPs exhibit excellent sensing performance for low concentrations of methanol. The Pt@SnO2-ZnO based sensor displays enhanced sensing performance for 10 ppm methanol at 320 ℃, with a 2.86 times improvement in response (73.6) compared with that of SnO2-ZnO and a low limit of detection (0.18 ppb). The synergistic effect of the core-shell structure for keeping Pt NPs from aggregating and the catalytic activity of Pt results in a sensor with enhanced sensitivity, selectivity, and stability, making it a promising candidate for practical methanol detection applications. The integration of metal-organic frameworks as precursor platform with noble metals presents an effective approach in the realm of chemiresistive gas sensor development.
The authors declare that they have no known competing financial interests or personal relationships that could have appeared to influence the work reported in this paper.
Hui Zhang: Writing – original draft, Investigation, Formal analysis, Data curation. Haichao Wang: Formal analysis, Data curation. Jijie Zhang: Formal analysis, Data curation. Da-Shuai Zhang: Investigation, Formal analysis. Mei-Hui Yu: Writing – review & editing, Investigation, Formal analysis, Data curation. Ze Chang: Writing – review & editing, Investigation, Formal analysis, Data curation. Xian-He Bu: Writing – review & editing, Investigation.
The work was supported by was supported by the National Natural Science Foundation of China (Nos. 22494631, 22494632, 22035003, 22371134 and 22375104), National Key R&D Program of China (No. 2022YFA1503301), Haihe Laboratory of Sustainable Chemical Transformations (No. YYJC202101), the China Postdoctoral Science Foundation (No. 2020M680855), and NCC Fund (No. NCC2022FH01).
K. Natte, H. Neumann, M. Beller, R.V. Jagadeesh, Angew. Chem. Int. Ed. 56 (2017) 6384–6394. doi: 10.1002/anie.201612520
Q. Liu, J.R. Kirchhoff, J. Electroanal. Chem. 601 (2007) 125–131. doi: 10.1016/j.jelechem.2006.10.039
J.v.d. Broek, S. Abegg, S.E. Pratsinis, A.T. Güntner, Nat. Commun. 10 (2019) 4220. doi: 10.1038/s41467-019-12223-4
J.A. Kruse, Intensive Care Med. 18 (1992) 391–397. doi: 10.1007/BF01694340
L.Y. Gai, R.P. Lai, X.H. Dong, et al., Rare Metals 41 (2022) 1818–1842. doi: 10.1007/s12598-021-01937-4
C. Shi, L. Yu, X. He, et al., Sens. Actuator. B: Chem. 401 (2024) 134888. doi: 10.1016/j.snb.2023.134888
H. Zhu, W. Liu, Z. Jiang, et al., Sens. Actuator. B: Chem. 401 (2024) 135051.
J. Lee, H. Min, Y.S. Choe, et al., Sens. Actuator. B: Chem. 394 (2023) 134359. doi: 10.1016/j.snb.2023.134359
M. Sinha, S. Neogi, R. Mahapatra, S. Krishnamurthy, R. Ghosh, Sens. Actuator. B: Chem. 336 (2021) 129729. doi: 10.1016/j.snb.2021.129729
G. Wang, S. Yang, L. Cao, et al., Coord. Chem. Rev. 445 (2021) 214086. doi: 10.1016/j.ccr.2021.214086
M. Lei, M. Gao, X. Yang, et al., ACS Appl. Mater. Interfaces 13 (2021) 51933–51944. doi: 10.1021/acsami.1c07322
T. Li, Y. Shen, X. Zhong, et al., J. Alloy. Compd. 818 (2020) 152927. doi: 10.1016/j.jallcom.2019.152927
T. Hyodo, M. Takamori, T. Goto, T. Ueda, Y. Shimizu, Sens. Actuator. B: Chem. 287 (2019) 42–52. doi: 10.1016/j.snb.2019.02.036
L. Xu, R. Xing, J. Song, W. Xu, H. Song, J. Mater. Chem. C 1 (2013) 2174–2182. doi: 10.1039/c3tc00689a
D. Shin, T.M. Besmann, B.L. Armstrong, Sens. Actuator, B: Chem. 176 (2013) 75–80. doi: 10.1016/j.snb.2012.08.084
C. Jin, H. Kim, S. Park, et al., Ceram. Int. 38 (2012) 6585–6590. doi: 10.1016/j.ceramint.2012.05.043
D. Haridas, V. Gupta, Sens. Actuator. B: Chem. 166 (2012) 156–164.
Q. Rong, B. Xiao, J. Zeng, et al., ACS Sens. 7 (2021) 199–206. doi: 10.25807/22225064_2021_63_199
F. Zheng, S. Cao, Z. Yang, et al., Energy Fuels 38 (2024) 11494–11520. doi: 10.1021/acs.energyfuels.4c01963
H. Long, Y. Li, K. Chai, W. Zeng, Sens. Actuator. B: Chem. 417 (2024) 136183. doi: 10.1016/j.snb.2024.136183
S. Wang, Z. Gao, G. Song, et al., J. Mater. Chem. C 8 (2020) 9671–9677. doi: 10.1039/d0tc01425g
M.H. Yap, K.L. Fow, G.Z. Chen, Green Energy Environ 2 (2017) 218–245. doi: 10.1016/j.gee.2017.05.003
N. Garg, A. Deep, A.L. Sharma, Coord. Chem. Rev. 445 (2021) 214073. doi: 10.1016/j.ccr.2021.214073
P. Hajivand, J.C. Jansen, E. Pardo, et al., Coord. Chem. Rev. 501 (2024) 215558. doi: 10.1016/j.ccr.2023.215558
C. Park, W.T. Koo, S. Chong, et al., Adv. Mater. 33 (2021) 2101216. doi: 10.1002/adma.202101216
Z. Wang, H. Liu, J. Shao, et al., Nanotechnology 33 (2022) 365501. doi: 10.1088/1361-6528/ac7475
H. Zhang, S. Guo, W. Zheng, et al., Chem. Eng. J. 469 (2023) 143927. doi: 10.1016/j.cej.2023.143927
S. Zhang, H. Li, N. Zhang, et al., Sens. Actuator. B: Chem. 330 (2021) 129286. doi: 10.1016/j.snb.2020.129286
W.T. Koo, S. Yu, S.J. Choi, et al., ACS Appl. Mater. Interfaces 9 (2017) 8201–8210. doi: 10.1021/acsami.7b01284
C. Montoro, J.Y. Kim, A. Mirzaei, et al., Compos. Pt. B: Eng. 283 (2024) 111637. doi: 10.1016/j.compositesb.2024.111637
D. Saliba, M. Ammar, M. Rammal, M. Al-Ghoul, M. Hmadeh, J. Am. Chem. Soc. 140 (2018) 1812–1823. doi: 10.1021/jacs.7b11589
C. Qin, B. Wang, P. Li, et al., Sens. Actuator. B: Chem. 331 (2021) 129433. doi: 10.1016/j.snb.2021.129433
J. Zhang, T. Bai, H. Huang, et al., Adv. Mater. 32 (2020) 2004747. doi: 10.1002/adma.202004747
W.H. Guo, H.P. Pang, X.Y. Yang, et al., J. Mater. Chem. A 12 (2024) 15781–15791. doi: 10.1039/d4ta02452d
Y. Lu, W. Zhan, Y. He, et al., ACS Appl. Mater. Interfaces 6 (2014) 4186–4195. doi: 10.1021/am405858v
Y. Meng, Q. Sun, T. Zhang, et al., J. Am. Chem. Soc. 145 (2023) 5486–5495. doi: 10.1021/jacs.3c00047
J. Liu, P. Wang, W. Qu, et al., Appl. Catal. B: Environ. Energy 257 (2019) 117880. doi: 10.1016/j.apcatb.2019.117880
J.M. Themlin, M. Chtaïb, L. Henrard, et al., Phys. Rev. B 46 (1992) 2460–2466. doi: 10.1103/PhysRevB.46.2460
N. Daelman, M. Capdevila-Cortada, N. López, Nat. Mater. 18 (2019) 1215–1221. doi: 10.1038/s41563-019-0444-y
Y. Qin, J. Zhang, ACS Appl. Nano Mater. 7 (2024) 26175–26186. doi: 10.1021/acsanm.4c05523
S. Mishra, C. Patel, D. Pandey, S. Mukherjee, A. Raghuvanshi, Small 20 (2024) 2311448. doi: 10.1002/smll.202311448
C. Wang, X. Kou, N. Xie, et al., ACS Sens. 2 (2017) 648–654. doi: 10.1021/acssensors.7b00028
G. Ma, J. Li, K. Feng, B. Zhang, S. Zhang, Ceram. Int. 45 (2019) 7295–7301. doi: 10.1016/j.ceramint.2019.01.011
Y. Zeng, Z. Hua, X. Tian, et al., Sens. Actuator. B: Chem. 273 (2018) 1291–1299. doi: 10.1016/j.snb.2018.07.041
Y. Li, D. Deng, N. Chen, et al., RSC Adv. 6 (2016) 83870–83879. doi: 10.1039/C6RA16636A
Y. Qin, S. Chen, Y. Bai, ACS Appl. Electron. Mater. 4 (2022) 158–167. doi: 10.1021/acsaelm.1c00911
A.M. Al-Enizi, M. Naushad, A.A.H. Al-Muhtaseb, et al., Chem. Eng. J. 345 (2018) 58–66. doi: 10.1016/j.cej.2018.03.138
Q. Wei, J. Sun, P. Song, et al., Sens. Actuator. B: Chem. 317 (2020) 128205. doi: 10.1016/j.snb.2020.128205
Q. Rong, B. Xiao, J. Zeng, et al., ACS Sens. 7 (2022) 199–206. doi: 10.1021/acssensors.1c01959

Scheme 1 The schematic illustration of the preparation and sensing process of Pt@SnO2-ZnO based sensor.

Figure 1 (a) The scheme for the construction of Pt@SnO2-ZnO composites. PXRD patterns of (b) Sn/Zn-ZIF-8 and Pt@Sn/Zn-ZIF-8, and (c) SnO2-ZnO and Pt@SnO2-ZnO. (d) TEM and (e) HRTEM images of Pt@Sn/Zn-ZIF-8. (f) TEM and (g) HRTEM images and (h) EDX elemental mapping analysis of Pt@SnO2-ZnO for the distribution of Zn (orange), Sn (green), Pt (yellow) and O (blue) elements.

Figure 2 (a) The N2 adsorption-desorption isotherms and the corresponding pore size distribution plots (inset) of Pt@SnO2-ZnO. (b) TGA profile of Sn/Zn-ZIF-8 and Pt@Sn/Zn-ZIF-8. (c) Pt 4f spectra of Pt@SnO2-ZnO. (d) O 1s spectra of Pt@SnO2-ZnO and SnO2-ZnO.

Figure 3 (a) The change of response and (b) baseline resistance variation curves of gas sensors based on SnO2-ZnO and Pt@SnO2-ZnO composites to 10 ppm methanol at different operating temperatures. (c) Dynamic resistance, (d) response-recovery curves and (e) response-recovery time of SnO2-ZnO and Pt@SnO2-ZnO based gas sensors at 320 ℃ for 10 ppm methanol. (f) Dynamic response-recovery curve, (g) the change of response, (h) linear relationship of response-concentration and (i) the corresponding log(S-1) vs. log(C) for different concentrations of methanol at 320 ℃ of Pt@SnO2-ZnO based sensor.

Figure 4 Pt@SnO2-ZnO and SnO2-ZnO based sensors for (a) dynamic response curves toward 10 ppm methanol at different relative humidity (RH). The fitted curve for methanol concentration and response values of (b) Pt@SnO2-ZnO and (c) SnO2-ZnO. (d) Sensor responses to 10 ppm various target gases of Pt@SnO2-ZnO and SnO2-ZnO at 320 ℃ (black: C, white: H, red: O, blue: N). (e) The comparison of the sensing response for several the reported gas sensors towards methanol. (f) Long-term stability of the Pt@SnO2-ZnO based sensor response to methanol at 320 ℃ for 14 days.

Figure 5 Schematic illustration of the sensing mechanism of the Pt@SnO2-ZnO based sensor.
Table 1. The performance comparison of the methanol gas sensors.
| Gas sensor | T (℃) | Conc. (ppm) | Response | Response/recovery time | Experimental minimum conc. (ppm)/response | Ref. |
| Pt@SnO2-ZnO | 320 | 10 | 73.6 | 122 s/66 s | 0.1/3.99 | This work |
| F-V2CTx/ZIF-67 | 25 | 10 | 7.75 | 3 s/12 s | 1/1.12 | [40] |
| 2D Cu(I) CP | 27 | 100 | 66.7 | 17.5 s/34.2 s | 0.25/3 | [41] |
| Indium tungsten oxide | 312 | 400 | 12 | 2 s/9 s | 20/1.95 | [42] |
| Nano-spindle like In2O3 | 240 | 100 | 27 | < 1 s/10 s | 10/1.3 | [43] |
| Zeolite/Pd-WO3 | 350 | 30 | 53 | – | 2/~2 | [44] |
| Pt-SnO2 | 80 | 100 | 190.88 | 10 s/10 s | 5/24.85 | [45] |
| SnS/SnS2 | 25 | 25 | 14.85 | 8 s/- | 0.1/1.14 | [46] |
 下载: 导出CSV

 扫一扫看文章


扫一扫关注我们
 下载:
下载: