Citation:
Hui Ning, Dewen Song, Minjun Zhou, Xinze Bi, Mingwang Wang, Shipeng Zhang, Rui Zhou, Jiwei Wang, Dan Lu, Xiao Tang, Xiaoshan Wang, Jianling Zhang, Mingbo Wu. Rapid construction of self-supported nanoarray electrode of ultrathin-carbon coated Bi nanospheres for active and stable CO2 electroreduction[J]. Chinese Chemical Letters,
2026, 37(8): 111191.
doi:
10.1016/j.cclet.2025.111191
Rapid construction of self-supported nanoarray electrode of ultrathin-carbon coated Bi nanospheres for active and stable CO2 electroreduction
English
Rapid construction of self-supported nanoarray electrode of ultrathin-carbon coated Bi nanospheres for active and stable CO2 electroreduction
State Key Laboratory of Heavy Oil Processing, College of Chemical Engineering, College of New Energy, Institute of New Energy, School of Materials Science and Engineering, China University of Petroleum (East China), Qingdao 266580, China
b.
Institute of Chemistry, Chinese Academy of Science, Beijing 100190, China
c.
Key Laboratory for Polymeric Composite and Functional Materials of Ministry of Education, School of Chemistry, Sun Yat-sen University, Guangzhou 510006, China
d.
College of Materials Science and Engineering, College of Physics, Weihai Innovation Research Institute, Qingdao University, Qingdao 266071, China
Received Date:
12 February 2025 Accepted Date:
09 April 2025 Revised Date:
03 April 2025 Available Online:
15 August 2026
Abstract:
The CO2 electroreduction is a valuable technology towards carbon neutrality but facing great challenge in fabricating efficient and stable electrode. Here we propose the construction of self-supported nanoarray electrode of ultrathin carbon-coated Bi nanospheres through a self-assembly and Joule heating method for high-efficiency electrocatalytic CO2 reduction. The electrode combines the advantages of facilitating electron transfer, accelerating the subsequent electro-proton coupling step in CO2 reduction process and protecting Bi nanoparticles from aggregation or electrochemical corrosion. The highest Faraday efficiency for formic acid in a solid-state electrolyte cell reaches 95.46% with a partial current density of 119.10 mA/cm2 and remains above 90% for 110 h. This route for assembling self-supported nanoarray electrode is rapid, facile, and can be employed in the large-scale fabrication of industrial electrodes in the future.
The giant emission of CO2 has led to serious environmental issues [1,2]. Using renewable energy to transform CO2 into valuable products has emerged as a promising technology to reducee carbon emissions and promote carbon recycling [3,4]. Formic acid is widely utilized in industries of pharmaceuticals, rubber, and metallurgy, which is also considered as a carrier for hydrogen and a direct feedstock of fuel cells [5–9]. The electroreduction of CO2 to formic acid is a two-electron transfer reaction, which not only exhibits the highest reaction rate and electron utilization but also demonstrates the greatest economic value per kWh of electrical energy input by taking electricity costs into account [10–12]. Consequently, targeting formic acid production through CO2 electroreduction presents the most favourable outlook for industrial application among all CO2 electroreduction processes. Up to now, the high activity and selectivity for producing formic acid by electroreduction of CO2 have been achieved by various catalysts such as Bi [13–16], In [17,18], Sn [19,20] and Pb [21,22]. Specially, Bi-based catalysts have drawn most attention due to their high efficiency, non-toxicity and cost-effectiveness [23]. For instance, Nankya et al. [24] achieved a Faradaic efficiency of approximately 72% for HCOOH using a Co-doped Bi catalyst at a current density of 100 mA/cm2 in a solid-state electrolyte cell. This research indicates that introducing metal into bismuth nanoflakes can enhance the catalytic performance of the CO2 reduction reaction.
Nonetheless, the majority of metal catalysts are randomly on the electrodes. This is susceptible to structural degradation and loss of active sites arising from catalyst aggregation [25–27], and they possess relatively low electron transfer efficiency during long-term electrocatalytic processes, thereby reducing the performance of the catalysts [28]. The fabrication of metal nanoparticles through nanomorphology engineering is a proven method [29,30]. Spherical entities typically exhibit a relatively high specific surface area and reduced contact areas in a random stacking arrangement. The single-layer ordered array distribution of the catalyst on the electrode can, due to its regular layout, effectively reduce the aggregation of the catalyst, thereby minimizing the loss of active sites and achieving a highly efficient utilization rate of active sites. It is interesting to assemble arrays of metal nanoparticles for boosting both the activity and durability for long-term production of formic acid from electrocatalytic CO2 reduction.
Herein we propose the construction of self-supported nanoarray electrode of ultrathin carbon-coated Bi nanospheres for high active and stable production of formic acid from electrocatalytic CO2 reduction. Such an electrode combined the following advantages. First, the nanoarray of Bi nanospheres can expose rich active sites, maximize the contact between the nanospheres and CO2 than the random stacking configuration, and improve the electron transfer in CO2 reduction process, thus favoring catalytic activity. Second, the Bi nanospheres coated by ultrathin carbon layer can well prevent nanoparticle aggregation [31], collapse [32] and maintain the active sites. To get this well-designed electrode, a self-assembly combined with Joule heating method was proposed, which needs only 12 min and 500 ms for the whole preparation procedure. Compared to traditional pyrolysis methods, the Joule heating method is not only rapid but can well avoid the nanoparticle sintering by the mostly adopted thermolysis preparation [33–36], thus producing highly dispersed nanoparticles. By such a nanoarray electrode, the highest Faradaic efficiency (FE) of formic acid reaches 95.46% with partial current density of 119.10 mA/cm2 in a solid-state electrolyte (SSE) cell, and the FE can be maintained above 90% for 110 h.
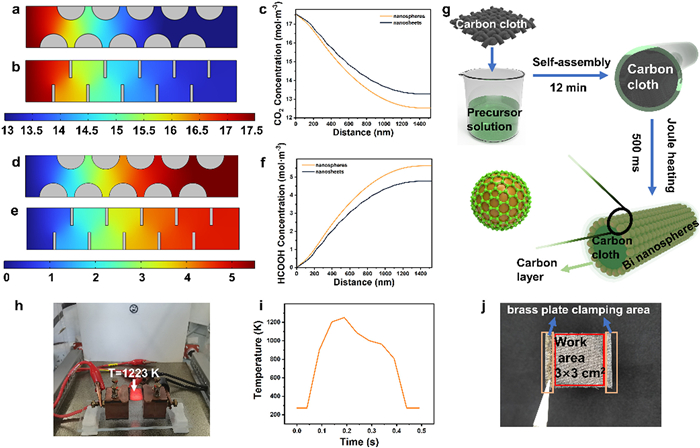
Prior to the commencement of this experiment, a multi-physics field simulation was carried out to explore how the nanoparticle morphology influences the concentration and distribution of CO2 and formic acid generated by the CO2 reduction reaction [37–39]. The nanospheres and nanosheets were equipped with the two-dimensional flow channels (Fig. S1 in Supporting information), respectively. The exposed semicircular arc length of the nanospheres and the perimeter of the three edges exposed by the nanosheets were adjusted to be nearly equal to eliminate the influence of surface areas of the model. Disregarding the actual densities of nanospheres and nanosheets in reality, we idealized the quantities of nanospheres and nanosheets as the same in this simulation. Additionally, all fundamental parameters such as reaction rates and diffusion coefficients are identical. For the nanospheres, CO2 is predominantly concentrated at the front of flow channel (Fig. 1a). In contrast, CO2 distributes towards the middle and ahead of the flow channel equipped with nanosheets (Fig. 1b), suggesting lower catalytic performance than the nanospheres. The real-time monitoring of CO2 distribution along the red line in the flow channel (Fig. S2 in Supporting information) was conducted. Evidently, the CO2 concentration in the flow channel with nanospheres is lower than the nanosheets (Fig. 1c). For example, the CO2 concentration on the nanospheres was 12.523 mol/m3 at the outlet of channel, lower than that of the nanosheets (13.279 mol/m3). It means higher CO2 consumption in the flow channel with nanospheres. It is evident from Fig. S1 that the reason for the above results is the uniform distribution of CO2 on the surface of the nanospheres. As for the nanosheets, CO2 is concentrated at the tip and cannot be uniformly transported to the root of the nanosheets, giving rise to a considerable number of dead zones for mass transfer. Furthermore, the HCOOH concentration in the two types of channels were analyzed (Figs. 1d–f). At the outlet of the flow channel, the formic acid concentration on the nanospheres was 5.626 mol/m3, higher than that on the nanosheets (4.774 mol/m3). Our previous work has investigated the application of Bi-based nanosheets array catalysts in electrocatalytic CO2 reduction [40,41]. Based on the foregoing analysis and through the comparison of the results of this experiment with those of other nanosheet arrays (Table S1 in Supporting information), it is more advantageous to construct nanoarray electrodes on carbon fibers using nanospheres rather than nanosheets.
Figure 1
Figure 1.
Concentration and distribution of CO2 over (a) nanospheres and (b) nanosheets. (c) Concentration profile of CO2 in flow channel. Concentration and distribution of HCOOH over (d) nanospheres and (e) nanosheets. (f) Concentration profile of HCOOH in flow channel. (g) Preparation procedure. (h) Digital image captured by a high-speed camera at 1223 K. (i) Heating curve. (j) Digital photo of Bi@C-J.
A two-step method was proposed to synthesize self-supported nanostructured electrode composed of Bi/C nanospheres. As shown in Fig. 1g, the pre-treated carbon cloth is immersed in the precursor solution for 12 min and then dried, resulting in the self-assembly of a transparent film on the surface of the carbon cloth (CC). The carbon cloth is then rapidly heated to 1223 K and cooled using the equipment illustrated in Fig. 1h, following the pattern shown in Fig. 1i. Subsequently, the surface of the carbon cloth turns white (Fig. 1j). The entire process is accomplished within <500 milliseconds and is applicable to both small-sized and large-sized CC. The obtained sample by Joule heating was named as Bi@C-J.
For comparison, two control samples were prepared. First, the carbon layer-free Bi nanospheres were prepared by the method the same with above but without adding the additional carbon source, which was named as Bi-J. Second, to investigate the effect of Joule heating, a conventional thermal treating method by furnace was used as an alternative of Joule heating, the other experimental conditions being the same with above for Bi@C-J. The as-synthesized sample was named as Bi@C-T. The loading of the catalysts of Bi@C-J, Bi@C-T and Bi-J is presented in Fig. S3 (Supporting information). Bi@C-J possesses the highest loading of catalyst with 1.90 mg/cm2.
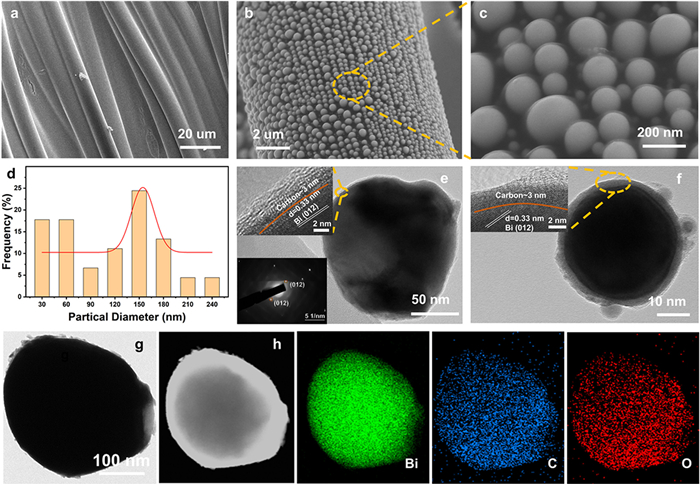
The Bi@C-J is shown in Fig. 2 and Fig. S4 (Supporting information). It can be seen that a high-density array of spheres with average diameters of 150 nm were grown on the carbon fiber of carbon cloth (Figs. 2a–d). Furthermore, there is a translucent and ultrathin carbon layer wrapped on the surface of each Bi sphere (Fig. 2c). After the nanosphere array on the carbon cloth fibers was ultrasonically removed using ethanol and observed by TEM, it was discovered that the surfaces of the nanospheres with two main particle sizes of 150 nm (Fig. 2e) and 45 nm (Fig. 2f) both had carbon layers with a thickness of approximately 3 nm. The width of lattice stripe spacing is 0.33 nm, which is ascribed to the (012) crystal plane of Bi. It is also confirmed that the Bi element exists mainly in the metallic state. According to the energy dispersive spectroscopy (EDS), the nanospheres are consisted of Bi, C, and O, with mass fraction of 84.89%, 12.60% and 2.51%, respectively (Figs. 2g and h, Table S2 in Supporting information). The Bi@C-J has a Brunauer-Emmett-Teller (BET) surface area of 10.20 m2/g, as determined by nitrogen adsorption-desorption isotherm (Fig. S5 in Supporting information) [42–44].
Figure 2
Figure 2.
Characterizations of Bi@C-J. (a-c) SEM images. (d) Particle diameter distributions. (e, f) TEM image (Inset are the SAED pattern and HRTEM images). (g) TEM image and corresponding. (h) HADDF-STEM image, EDS elemental mapping.
Compared with Bi@C-J, the Bi-J has much larger size and poor distribution (Fig. S6 in Supporting information), which can be ascribed to the absence of constraints from carbon layer. The Bi@C-T synthesized by a tube furnace shows broken carbon layer and the sporadically dispersed Bi spheres on the carbon fibers (Fig. S7 in Supporting information), and the amount of Bi increases by decreasing the heating temperature from 1223 K to 823 K (Figs. S8 and S9 in Supporting information). It means that Bi could be evaporated at elevated temperature by the long-term thermolysis. In contrast, since the Joule heating only takes a very short time (500 ms) to complete the same procedure, the evaporation of Bi can be well avoided, thus producing the dense alignment of Bi@C-J nanoparticles shown in Fig. 2.
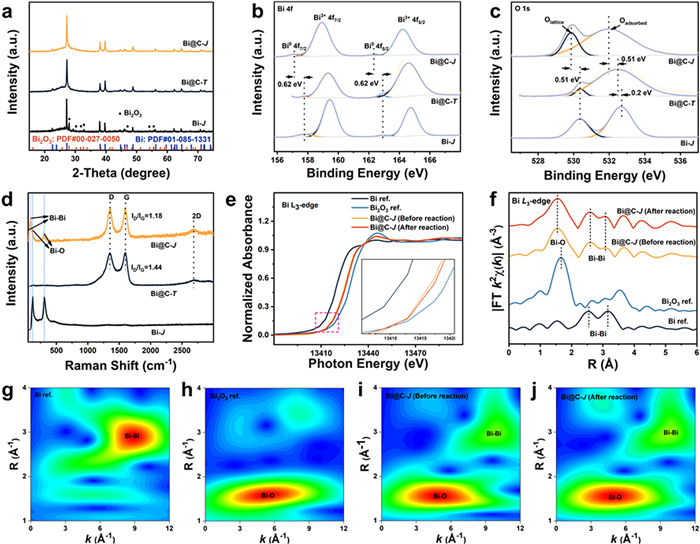
X-ray diffraction (XRD) patterns show that the Bi@C-J, Bi@C-T, and Bi-J samples all exhibit the identical Bi metal crystalline phase (Fig. 3a) [45]. The characteristic peaks at 27.2°, 37.9°, 39.6°, 48.7°, 56.0°, 62.2°, 64.5°, 70.8°, which are correspond to the (012), (104), (110), (202), (024), (116), (122), (214) planes (PDF #01–085–1329) respectively. For Bi-J, the diffractions of Bi2O3 at 27.9°, 30.3°, 31.7°, 32.7°, 46.9°, 54.3° and 55.5° were also observed (PDF #00–027–00–50), which is due to the oxidation of Bi by air without the protection of carbon layer. X-ray photoelectron spectroscopy (XPS) results indicate that distinct Bi0 peaks are present in the Bi 4f XPS spectra of the three samples (Fig. 3b). Combing with the XRD findings, it is evident that Bi0 is dominant, while the Bi3+ peak is more noticeable in the Bi 4f spectrum, as a result of the oxidation of surface Bi to Bi3+ by air [46]. The O 1s XPS spectrum displays the chemical bonds resulting from the resonance effects of Bi-O and the ambient oxygen adsorbed on the metal surface (Fig. 3c) [47]. The characteristic peaks in the C 1s XPS spectra of the three samples are associated with C—C, C—O, and C═O bonds (Fig. S10 in Supporting information). By Raman spectroscopy analysis (Fig. 3d), the Bi@C-J catalyst exhibits distinct Bi-Bi resonance peaks [48–50]. In contrast, the Bi-J catalyst, lacking a carbon source, did not display Bi monomer peaks but instead showed prominent Bi2O3 peaks. This result suggests that without the protection of a carbon layer, Bi monomers are more prone to oxidation into Bi2O3 by air, aligning with the XRD and XPS results. As for Bi@C-T, only a weak characteristic peak of Bi2O3 was observed in the Raman spectroscopy, indicating most Bi were evaporated during prolonged heating at high temperatures. We further employed X-ray absorption spectroscopy (XAS) to validate the chemical state of the Bi element in Bi@C-J. The X-ray absorption near-edge structure (XANES) spectrum reveals that the Bi L3 edge of Bi@C-J lies between Bi ref. and Bi2O3 ref. (Fig. 3e), suggesting that the average valence state of Bi ranges from 0 to +3. The Fourier-transformed extended X-ray absorption fine structure (FT-EXAFS) spectrum of the Bi L3 edge (Fig. 3f). According to the EXAFS spectrum of Bi-Bi (Fig. 3g) and Bi-O (Fig. 3h) [49], the Bi@C-J contains both peaks of Bi (Fig. 3i), even after long-time used in the reaction (Fig. 3j). Furthermore, the Fourier transform infrared (FTIR) spectrum of Bi@C-J shows a distinctive peak at 1660 cm-1, corresponding to C═O bonds from carbon layer (Fig. S11 in Supporting information) [51], which means the Bi-O bounds may be derived from the strong interaction of Bi and carbon layer.
Figure 3
Figure 3.
Crystal structure of Bi@C-J, Bi@C-T and Bi-J. (a) XRD patterns. (b) Bi 4f spectra. (c) O 1s spectra. (d) Raman spectra. (e) The XANES spectra and (f) k2-weighted FT-EXAFS spectra at Bi L3-edge of the Bi@C-J and the Bi@C-J after 1 h of the eCO2RR (cathodic potential: −0.9 V vs. RHE). Wavelet-transform analysis of EXAFS spectrum of (g) Bi ref., (h) Bi2O3 ref., (i) Bi@C-J, (j) Bi@C-J after 1 h of the eCO2RR (cathodic potential: −0.9 V vs. RHE).
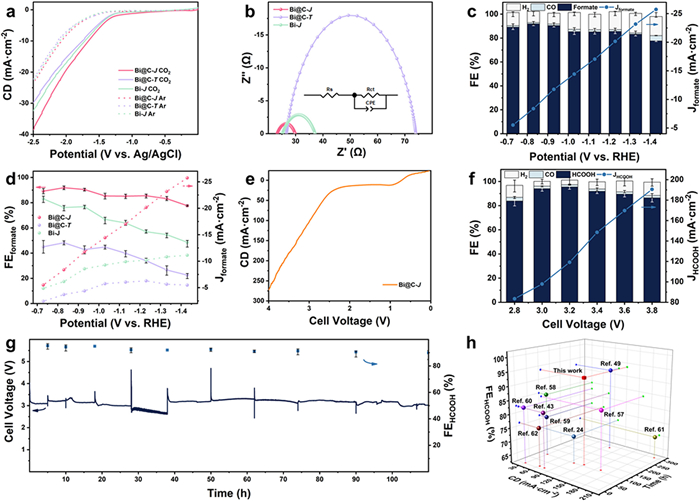
The catalytic performance of CO2 electroreduction was firstly conducted in H-cell. The Bi@C-J exhibits the highest current density in both CO2-saturated and Ar-saturated 0.1 mol/L KHCO3 solution (Fig. 4a). The Tafel slope of Bi@C-J is smaller than those of Bi@C-T and Bi-J, indicating faster kinetic reaction rate (Fig. S12 in Supporting information) [52,53]. Electrochemical impedance spectroscopy (EIS) measurements were also carried out at the optimal voltage to assess the electron transfer performance (Fig. 4b). As can be seen from Table S3, the series resistances (Rs) caused by the same electrolyte and contact resistances among the three catalysts did not have significant difference. Nevertheless, Bi@C-J has the lowest interfacial electron transfer resistance (Rct), indicating that Bi@C-J possesses the fastest electron transfer rate, which can facilitate the formation of the *CO2•− intermediate in the first electron transfer step and thereby accelerate the reaction rates [54–56]. The macroscopic resistance tests reveal that Bi@C-J exhibits the lowest face resistance among the three samples (Fig. S13 in Supporting information), which is attributed to the high-density and uniform array of carbon-coated Bi nanoparticles. The electrochemically active surface area (ECSA) was determined by double-layer capacitance method in the non-redox potential region. The double-layer capacitance values for Bi@C-J, Bi@C-T, and Bi-J are 1.88, 0.80, and 1.43 mF/cm2, respectively (Fig. S14 in Supporting information). Notably, Bi@C-J presents the highest value, resulting in the most active sites. By comparing of the ECSA-corrected partial current densities of the three catalysts (Table S4 in Supporting information), it can be found that the Bi@C-J has the highest intrinsic activity.
Figure 4
Figure 4.
Electrochemical tests. (a) LSV curves. (b) Nyquist plots of impedance. (c) The FEs of products and the partial current density of Bi@C-J. (d) Comparison of the FEformate and the partial current densities of Bi@C-J, Bi@C-T and Bi-J in the H-cell. (e) LSV curve. (f) The FEs of products and the partial current density of Bi@C-J in a SSE cell. (g) Stability test at 120 mA/cm2 in a SSE cell. (h) Comparison of the stability of formic acid production in SSE cell.
The catalytic performances of the three catalysts were tested based on Faradaic efficiency and partial current density. In a H-cell, the Bi@C-T catalyst exhibits a FE of formate exceeding 80% across a wide potential range of 700 mV (−0.73 V ~ −1.33 V vs. RHE), which reaches as high as 91.86% at −0.83 V vs. RHE (Fig. 4c). As control experiments, the catalytic performances of Bi@C-T, Bi-J, Bi@C-T-1023 K and Bi@C-T-823 K catalysts were also evaluated, which are both lower than that of Bi@C-J (Fig. 4d and Fig. S15 in Supporting information). The stability of Bi@C-J for producing formate was tested. The FE of formate over Bi@C-J remains above 80% after 24 h. In contrast, Bi-J only keep FE of 60% after 15 h electrolysis (Fig. S16 in Supporting information). The results emphasize that the carbon layer can not only enhance the activity but also strengthen the stability of Bi nanospheres.
For high-current test, the Bi@C-J was directly tested in a SSE cell (Fig. S17 in Supporting information). As depicted in Fig. 4e, the current density reaches up to 275 mA/cm2 at 4 V. The SSE cell system exhibits a tendency to stabilize the current density in the potential range from 2.8 V to 3.8 V (Fig. S18 in Supporting information). The maximum FE of formic acid is up to 95.46% at 3.2 V (Fig. 4f), with a partial current density of 119.10 mA/cm2. When increasing the applied cell voltage to 3.8 V, a partial current density as high as 190.52 mA/cm2 was obtained, while the FE of formic acid could be maintained at 86.46%. To assess the durability of Bi@C-J, we conducted long-time electrocatalytic experiments at a constant current density of 120 mA/cm2, with the full-cell voltage held at around 3.15 V for 110 h. The FE of formic acid can be kept over 90% (Fig. 4g) during the long-time test. After the experiment, the Bi@C-J was characterize by SEM, TEM and HRTEM. No obvious loss, agglomeration, or deformation of the Bi metal spheres was observed (Figs. S19a–e in Supporting information). Meanwhile, the Bi 4f XPS spectrum reveals a rise in the proportion of Bi0 peaks, which is linked to the electroreduction of surface Bi3+ (Fig. S19f in Supporting information). Conversely, it can be observed from the SEM images of that the Bi metal in Bi-J sample, without carbon layer protection, fails to maintain a spherical appearance and undergoes significant agglomeration (Fig. S20 in Supporting information). This indirectly validates the role of the carbon layer in maintaining the spherical morphology of the Bi metal during the stability test. Comparison with recent stability studies [24,32,43,49,57–61] on the production of formic acid in SSE cell by CO2 electroreduction, the Bi@C-J presents an outstanding performance (Fig. 4h). A detailed comparison with experimental conditions is listed in Tables S5 and S6 (Supporting information). Bi@C-J presents a relatively low energy consumption level and considerable reaction rate as well as product concentration in the SSE cell.
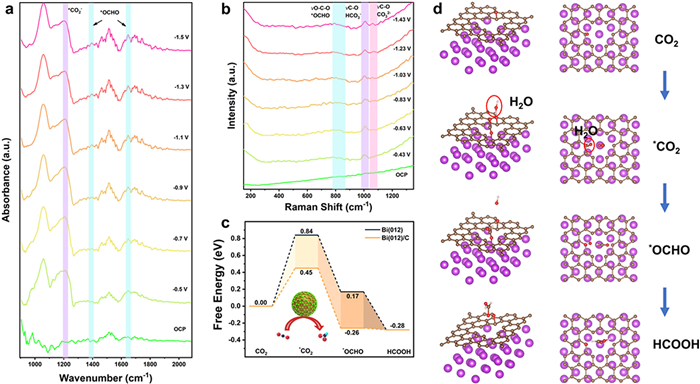
To explore the mechanism of CO2 electroreduction on Bi@C-J, in-situ ATR-FTIR spectra, in-situ Raman spectra and density functional theory (DFT) calculations were utilized. The reaction intermediates in the CO2 electroreduction process were identified by using in-situ ATR-FTIR spectra (Fig. 5a). The peak at 1210 cm-1 is ascribed to the activation of carbon dioxide molecules (*CO2•−) [62,63], while the two characteristic peaks at 1395 and 1647 cm-1 gradually intensify with the increase of potential, confirming the predominance of *OCHO intermediate for formic acid/formate generation in the reaction process [64,65]. Additionally, we also validated the species of formic acid intermediates by means of in-situ Raman spectra. The peaks at 1013 cm-1 and 1063 cm-1 are associated with the adsorption of HCO3- and CO32- on the catalytic surface, respectively (Fig. 5b) [66,67]. It was observed that the intensity of CO32- peak arises at more negative potentials due to the rise in local pH [68]. The peak at 805 cm-1 corresponds to the symmetric O—C-O bending mode of the crucial intermediate *OCHO toward formic acid formation [69,70].
Figure 5
Figure 5.
(a) In-situ ATR-FTIR spectra and (b) in-situ Raman spectra of Bi@C-J in CO2-saturated 0.1/0.5 mol/L KHCO3 at different applied potentials. (c) Free energy diagram of different pathways for eCO2RR to HCOOH. (d) Pathway and structural modelling of eCO2RR to HCOOH on Bi(012)/C (side view and top view; purple: Bi, brown: C, red: O; white: H).
To explore whether the main active sites in Bi@C-J are Bi-Bi or Bi-O at the onset of the electrocatalytic reaction, we measured the in-situ Raman spectra within the first 30 min of the eCO2RR (Fig. S21 in Supporting information). The Bi-Bi peak at 65.7 cm-1 significantly intensified within the first 25 min of the reaction initiation, while the Bi-O peak at 119.8 cm-1 began to vanish after 10 min. Once the reaction concluded, we evacuated the electrolyte, introduced air measure the in-situ Raman spectra continuously for another 10 min. It is found that the Bi-Bi peak at 65.7 cm-1 started to exhibit in a weakening trend, while the Bi-O peak at 119.8 cm-1 began to emerge. As a result, after the onset of eCO2RR, the Bi3+ in Bi@C-J was reduced to Bi0 quickly and Bi-Bi was the predominant active site in the following reaction.
Based on the above results, the pathway and structural modelling of eCO2RR to HCOOH on Bi@C-J was established (Fig. 5d and Fig. S22 in Supporting information). Owing to the continuous carbon layer, the Bi(012)/C surface possesses a faster electron transfer rate, thereby facilitating the generation of CO2 anion radical (*CO2•−). In the following proton coupling stage, water molecules immobilized by oxygen-containing groups of carbon layer provide protons to the *CO2•− intermediates, which are further reduced to *OCHO intermediates. Simultaneously, the water molecules supplying protons are transformed to OH-. The Gibbs energies for *CO2•−, *OCHO generation on Bi(012)/C are much smaller than those on the pristine Bi(012) (Fig. 5c). Specially, the Gibbs energy decreases the most in the first proton coupling step to generate *OCHO intermediates on Bi(012)/C. Therefore, it can be deduced that the carbon layer containing oxygen-functional groups on the surface of Bi nanoparticles is able to lower the energy barrier for the generation of *CO2•− and *OCHO intermediates, thereby accelerating the whole reaction rate from CO2 to formic acid.
In conclusion, inspired by finite element simulations, we invent a new type of self-supported nanoarray electrode with no binder and ionomer. This electrode was composed by Bi/C nanosphere array on the surface of carbon fiber. The Bi spheres, with average diameter of ca. 150 nm, are covered by a 3 nm thick carbon layer with abundant defects and oxygen groups. The carbon layer plays a vital role in controlling the aggregation of Bi nanospheres in the preparation, accelerating electron-proton coupling steps in the reaction and protecting the Bi from electrochemical corrosion in long-time test. The FE of formic acid reached 95.46% in the solid-state electrolyte cell and maintained over 90% at 120 mA/cm2 for up to 110 h, while the structure of Bi/C nanoarray was well preserved after long-time test. In-situ characterization and DFT calculations showed that the oxygen-containing functional groups on the carbon layer can activate water molecules and significantly decrease the Gibbs free-energy barrier of electro-proton coupling reaction, thereby speeding up the formation of the key intermediate *OCHO and enhancing the whole reaction rate. By Joule heating method, we could build the Bi/C self-supported nanoarray electrode in millisecond, which makes this binder-free electrode favorable for industrial application in the future.
Declaration of competing interest
The authors declare that they have no known competing financial interests or personal relationships that could have appeared to influence the work reported in this paper.
CRediT authorship contribution statement
Hui Ning: Writing – original draft. Dewen Song: Methodology. Minjun Zhou: Methodology. Xinze Bi: Data curation. Mingwang Wang: Software. Shipeng Zhang: Data curation. Rui Zhou: Data curation. Jiwei Wang: Data curation. Dan Lu: Formal analysis. Xiao Tang: Software. Xiaoshan Wang: Data curation. Jianling Zhang: Data curation. Mingbo Wu: Writing – review & editing.
Acknowledgments
This work was supported by the National Natural Science Foundation of China (Nos. 22378428, 22408192), the Taishan Scholar Project of Shandong Province of China (No. ts201712020), the Postdoctoral Fellowship Program of CPSF (No. GZC2023118) and the Shandong Postdoctoral Innovation Program (No. SDCX-ZG-202400262).
Supplementary materials
Supplementary material associated with this article can be found, in the online version, at doi:10.1016/j.cclet.2025.111191.
S. Mu, H. Lu, Q. Wu, et al., Nat. Commun. 13 (2022) 369.
Figure 1
Concentration and distribution of CO2 over (a) nanospheres and (b) nanosheets. (c) Concentration profile of CO2 in flow channel. Concentration and distribution of HCOOH over (d) nanospheres and (e) nanosheets. (f) Concentration profile of HCOOH in flow channel. (g) Preparation procedure. (h) Digital image captured by a high-speed camera at 1223 K. (i) Heating curve. (j) Digital photo of Bi@C-J.
Figure 2
Characterizations of Bi@C-J. (a-c) SEM images. (d) Particle diameter distributions. (e, f) TEM image (Inset are the SAED pattern and HRTEM images). (g) TEM image and corresponding. (h) HADDF-STEM image, EDS elemental mapping.
Figure 3
Crystal structure of Bi@C-J, Bi@C-T and Bi-J. (a) XRD patterns. (b) Bi 4f spectra. (c) O 1s spectra. (d) Raman spectra. (e) The XANES spectra and (f) k2-weighted FT-EXAFS spectra at Bi L3-edge of the Bi@C-J and the Bi@C-J after 1 h of the eCO2RR (cathodic potential: −0.9 V vs. RHE). Wavelet-transform analysis of EXAFS spectrum of (g) Bi ref., (h) Bi2O3 ref., (i) Bi@C-J, (j) Bi@C-J after 1 h of the eCO2RR (cathodic potential: −0.9 V vs. RHE).
Figure 4
Electrochemical tests. (a) LSV curves. (b) Nyquist plots of impedance. (c) The FEs of products and the partial current density of Bi@C-J. (d) Comparison of the FEformate and the partial current densities of Bi@C-J, Bi@C-T and Bi-J in the H-cell. (e) LSV curve. (f) The FEs of products and the partial current density of Bi@C-J in a SSE cell. (g) Stability test at 120 mA/cm2 in a SSE cell. (h) Comparison of the stability of formic acid production in SSE cell.
Figure 5
(a) In-situ ATR-FTIR spectra and (b) in-situ Raman spectra of Bi@C-J in CO2-saturated 0.1/0.5 mol/L KHCO3 at different applied potentials. (c) Free energy diagram of different pathways for eCO2RR to HCOOH. (d) Pathway and structural modelling of eCO2RR to HCOOH on Bi(012)/C (side view and top view; purple: Bi, brown: C, red: O; white: H).


 DownLoad:

 下载:
下载:


 下载:
下载:

