
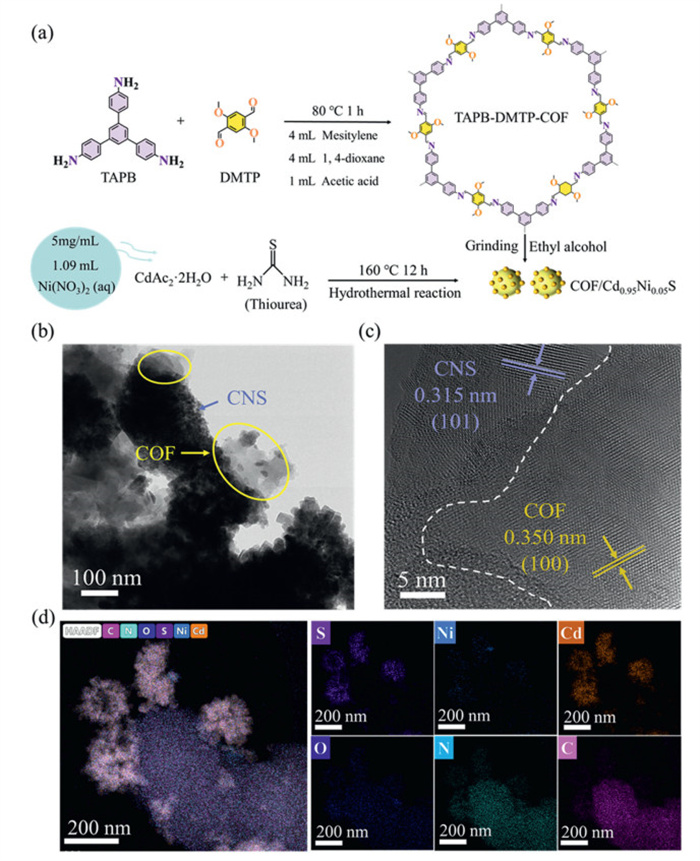
Figure 1.
(a) Schematic illustration of the synthetic process of the COF/CNS heterostructure. TEM (b), HRTEM (c), and elemental mapping images (d) of 15COF/CNS.


Energy consumption and environmental pollution have undoubtedly become two very important problems to be solved in today's world [1–3]. The development and utilization of solar energy holds great potential across various sectors [4–6]. Photocatalytic technology, as an environmentally friendly innovation, offers promising applications in energy production and environmental sustainability [7–9]. Among these, photocatalytic hydrogen production is a particularly viable strategy to reduce reliance on fossil fuels and promote clean energy initiatives [10–13]. Numerous photocatalysts have demonstrated effectiveness in hydrogen evolution [14–17]. In particular, the classical transition metal sulfide (CdS) is well-suited for this purpose owing to its narrow bandgap (2.4 eV), strong visible-light response, and high reduction capability [18–20]. Nevertheless, pristine CdS suffers from several intrinsic limitations, including low specific surface area, a scarcity of catalytically active sites, high photochemical corrosion, and rapid photogenerated charge recombination [21–23]. To address these issues, various strategies have been developed, such as metallic and nonmetallic doping, heterostructure construction and co-catalyst incorporation [24].
Covalent organic frameworks (COFs) are crystalline polymers linked by strong covalent bonds, offering high specific surface area, abundant active sites, tunable structures, and excellent chemical stability [25–27]. Their adjustable band gaps and strong visible-light response make them promising photocatalysts [28,29]. Compared with early boroxyl- or borate-linked COFs, COFs based on imine, hydrazone, triazine, phenazine, or azide linkages are more stable and perform better in harsh environments [30]. It is well known that composite photocatalysts offer significant advantages by simultaneously addressing light absorption and redox potential. COFs can form various types of heterostructures with CdS. Not only do they possess matched interleaved band structures that allow active electrons and holes to accumulate in their respective bands with stronger redox capabilities, but the π-conjugated 2D crystalline structure of COFs compensates for CdS's poor stability and severe photocorrosion defects while enhancing its carrier mobility. Therefore, coupling CdS with COFs to form a heterojunction enables rapid carrier dynamics and strong interfacial contact, thereby effectively enhancing photocatalytic performance [31]. To date, such structures primarily consist of hollow spheres, core-shell structures and 0D/2D configurations [32,33]. Notably, Gao et al. and Feng et al. reported 2D/2D organic/inorganic direct Z-scheme TpTAP/CdS heterojunctions and CdS@COF core-shell heterojunctions, which demonstrate excellent hydrogen evolution performance [34,35]. Despite these advances, most reported COF/CdS structures still face practical challenges, such as reliance on toxic organic solvents, high energy consumption, and elevated reagent costs [36–38]. Consequently, developing COF/CdS structures that are facile to synthesize, energy-efficient, and environmentally benign remains a critical goal.
In this work, a stable heterostructure was constructed between Cd0.95Ni0.05S (CNS) and a Schiff-based COF. By optimizing the COF content, the 15COF/CNS catalyst achieved a hydrogen production rate of 750.7 μmol h-1 g-1, which is 2.5 times higher than that of pristine CNS. The heterojunction effectively suppressed CNS photocorrosion and minimized photogenerated carrier recombination, while the porous COF structure facilitated proton exchange and hydrogen release. This work provides deep insight into the critical role of carrier dynamics in S-scheme heterojunctions and demonstrates substantial improvements in photocatalytic performance and hydrogen evolution efficiency.
Fig. 1a illustrates the synthetic process of the COF/CNS heterostructure. The microstructure and morphology of COF/CNS were examined using transmission electron microscopy (TEM) and high-resolution TEM (HRTEM). As shown in Fig. 1b, amounts of nanoparticles are aggregated on the surface of the irregular bulk material. Combined with the corresponding energy dispersive X-ray spectroscopy (EDS) mapping results, the surface-aggregated particles are identified as CNS, while the bulk material corresponds to COF. This assignment is further verified by HRTEM, where a lattice spacing of 0.315 nm corresponding to the (101) crystalline plane of CNS, and lattice fringes with a spacing of 0.350 nm, attributed to the (100) plane of COF (Fig. 1c). Additionally, elemental mapping demonstrates a uniform distribution of C, N, O, Ni, S, and Cd in COF/CNS composite (Fig. 1d and Fig. S1 in Supporting information). Additionally, the actual doping amount of Ni is about 4.8 mol% (Table S1 in Supporting information), which closely aligns with the theoretical doping ratio, thereby verifying the accuracy of the doping content. These results indicate the successful preparation of COF/CNS composites.
The crystalline structures of materials were analyzed using X-ray diffraction (XRD) (Figs. 2a and b, and Fig. S2 in Supporting information). The pristine CNS exhibits a hexagonal zinc blende phase, with characteristic diffraction peaks at 24.8°, 26.5°, 28.2°, 36.6°, 43.7°, and 47.8° corresponding to the (100), (002), (101), (102), (110), and (103) crystal planes, respectively, in agreement with JCPDS card #41–1049 [39]. The XRD pattern of COF shows peaks at 2.8°, 4.8°, 5.6°, 7.4°, 9.7°, and 25.4°, corresponding to the (100), (110), (200), (210), (220), and (001) crystal planes, respectively [40]. Notably, COF/CNS is basically reminiscent of pristine CNS in terms of the XRD patterns. In addition, no other peaks were detected in the samples, suggesting that no other crystalline phases were generated during synthesis.
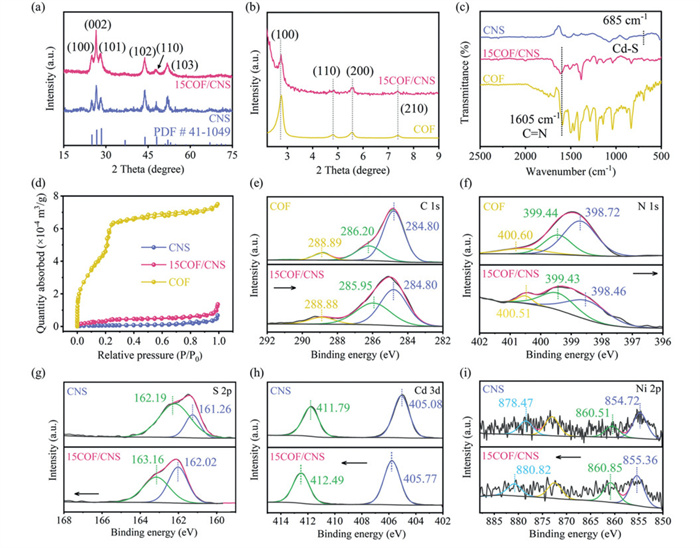
Solid-state 13C NMR further validated the chemical structure of COFs, with signals at δ 55.24 (methoxy groups), δ 110–154 (benzene rings), δ 189.03 and 207.06 (C-structures) aligning with theoretical predictions (Fig. S3 in Supporting information) [41]. The Fourier transform infrared (FTIR) spectra of CNS, COF, and COF/CNS were measured (Fig. 2c and Fig. S4 in Supporting information). In the spectrum of CNS, the stretching vibration peaks of the Cd-S group appear at 685 cm−1 [42]. When COF was grown on the surface of –NH2 modifed CNS to form the COF/CNS structure, a characteristic imine bond stretching vibration band was also observed at 1605 cm−1, suggesting the successful recombination of CNS and COF [43].
The pore structures of catalysts were investigated by nitrogen adsorption–desorption measurements (Fig. 2d and Table S2 in Supporting information). The bare COF possesses a type IV isotherm according to the IUPAC classification with a high Brunauer-Emmett-Teller (BET) surface area of 2069.8 m2/g [44]. Notably, the surface area of 15COF/CNS is about 7 times higher than that of CNS, owing to the incorporation of COF. All synthesized samples exhibit mesoporous structures (Fig. S5 in Supporting information). This mesoporous structure and large specific surface area are conducive to the progression of photocatalytic reactions. The incorporation of COF enhances the specific surface area of the composite, thereby providing more active sites for photocatalytic reactions.
The X-ray photoelectron spectroscopy (XPS) spectrum of 15COF/CNS confirms the presence of C, O, N, Cd, S, and Ni elements (Fig. S6 in Supporting information). The high-resolution C 1s spectrum of COF (Fig. 2e) exhibits peaks at 284.80, 286.20, and 288.89 eV, attributed to aromatic sp2 carbon, C—C and C—N bonds, respectively [45]. The N 1s spectrum of COF (Fig. 2f) shows peaks at 398.72, 399.44, and 400.60 eV, attributed to C–N and N–H groups [46]. For 15COF/CNS, the C 1s and N 1s shift to lower binding energy, indicating obtain electrons. The S 2p spectrum of CNS (Fig. 2g) shows peaks at 161.26 and 162.19 eV, corresponding to S2- (S 2p3/2 and S 2p1/2) [47]. The Cd 3d spectrum of CNS (Fig. 2h) presents peaks at 405.08 and 411.79 eV, characteristic of Cd2+ (Cd 3d5/2 and Cd 3d3/2) [48]. The Ni 2p spectrum (Fig. 2i) shows peaks at 854.72 and 878.47 eV, indicative of Ni2+ (Ni 2p3/2 and Ni 2p1/2), along with additional peaks at 860.51 and 873.01 eV, corresponding to Ni3+ [49]. For 15COF/CNS, the S 2p, Cd 3d, and Ni 2p shift to higher binding energy, indicating a loss of electrons.
The photocatalytic hydrogen evolution performance of catalysts was evaluated under light irradiation using sodium ascorbate (NaAsc) as a hole-trapping sacrificial agent and trace amounts of Co2+ as a cocatalyst. Nickel-doped CdS exhibits enhanced hydrogen production rates, ultraviolet absorption, and photocurrent, along with a reduced impedance arc radius, confirming that Ni doping effectively mitigates the photocorrosion of CdS (Fig. S7 in Supporting information). The photocatalytic performance of Ni-doped and composite COF materials (COF/CNS) is further enhanced. As shown in Fig. 3a, the pristine COF exhibits negligible photocatalytic activity, whereas pristine CNS achieves a H2 evolution rate of 305.2 µmol h-1 g-1, which remains insufficient for practical applications. In contrast, the COF/CNS composites display markedly enhanced H2 production rates. With increasing the mass ratio of COF to CNS, the H2 evolution efficiency of COF/CNS first improves and then declines. The H2 production rate reaches a maximum value of 750.7 µmol h-1 g-1 for 15COF/CNS, which is approximately 2.5 times and 3753.5 times that of CNS and COF, respectively. Fig. 3b demonstrates the superiority of NaAsc as a sacrificial agent. Compared to other sacrificial agents, NaAsc exhibits a redox potential more compatible with COF/CNS, thereby lowering the reaction energy barrier. It maintains good activity under weakly acidic conditions, facilitating the reduction of protons by photoelectrons to generate hydrogen [50]. Furthermore, NaAsc itself is non-toxic and non-polluting, making it environmentally friendly. Without the addition of Co2+, the hydrogen production rate decreases significantly, as shown in Fig. 3c. This is because the addition of trace amounts of Co2+ reduces the overpotential of the hydrogen evolution reaction, thereby enhancing the reaction rate [51]. Co2+ consumes accumulated electrons, mitigates the photocorrosion of CdS, and improves catalyst stability. Additionally, it reduces the amount of precious metals required, lowering production costs. Figs. 3d and e demonstrate that combined illumination with visible and ultraviolet light enhances hydrogen production performance, and that hydrogen generation is further favored under weakly acidic pH conditions. Under these pH conditions, the H+ concentration is optimal, promoting electron migration. After 3 cycles with a time interval of 1 day, the COF/CNS composite maintained a high activity of H2 generation (Fig. 3f), which is quite close to the initial performance if the mass loss was taken into account. Additionally, the crystal structure (Fig. S8 in Supporting information) of COF/CNS after cycling tests maintained the same as the original sample, demonstrating its outstanding stability. These results highlight the critical role of CNS-based heterostructures in boosting photocatalytic H2 production and underscore the favorable influence of heterojunctions on photocatalytic performance (Fig. S9 and Table S3 in Supporting information).
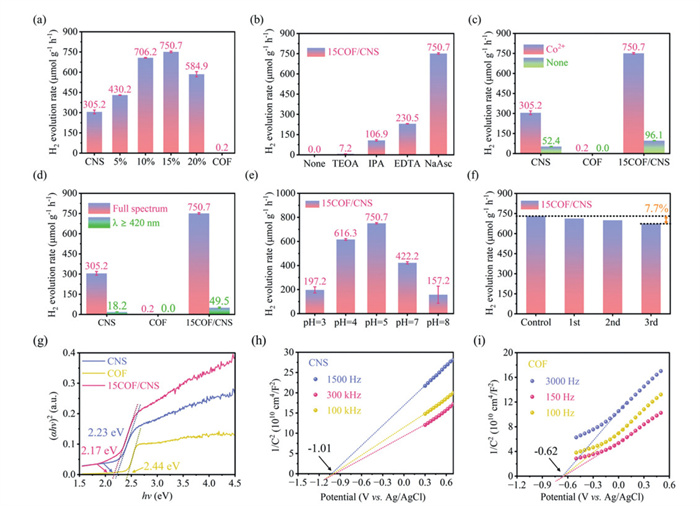
The bandgaps of catalysts were determined using the Kubelka-Munk equation: (αhv)n = K (hv - Eg) [52]. The Tauc plot (Fig. 3g) reveals that the direct bandgaps (Eg) of CNS, COF, and 15COF/CNS are 2.23, 2.44, and 2.17 eV, respectively. The flat band potentials of the photocatalysts were assessed by Mott-Schottky measurements (Figs. 3h and i). The positive slopes of the curves confirm the n-type semiconductor behavior of all catalysts [53,54]. The conduction band (CB) potentials of CNS and COF are −1.01 and −0.62 V (vs. Ag/AgCl), corresponding to −0.81 and −0.42 V after conversion to the normal hydrogen electrode (NHE) reference electrode. Based on the relationship EVB = ECB + Eg [55], the VB potentials of CNS and COF are calculated as 1.42 and 2.02 V, respectively (Fig. S10 in Supporting information). This energy band alignment indicates that COF and CNS can form an S-scheme heterojunction, which is favorable for efficient charge separation and photocatalytic performance.
The photocurrent measurements were conducted to evaluate the efficiency of photogenerated carrier separation and transfer. As shown in Fig. 4a, 15COF/CNS exhibits the highest photocurrent density among all tested photocatalysts, indicating that COF incorporation significantly promotes the separation of photoexcited electrons and holes [56]. The Nyquist plots from electrochemical impedance spectroscopy (EIS) (Fig. 4b) reveal a semicircle diameter order of COF > CNS > 15COF/CNS. The smaller semicircle diameter for 15COF/CNS indicates enhanced interfacial charge transfer, which contributes to its superior photocatalytic performance. Further analysis of the separation and transfer of photogenerated carriers was performed using the time-resolved photoluminescence (TRPL) spectroscopy (Fig. S11 and Table S4 in Supporting information). Compared with pure CNS (4.28 ns) and COF (4.39 ns), the COF/CNS composite (6.26 ns) exhibited a longer carrier lifetime, suggesting efficient carrier transport performance [57]. The optical absorption properties were evaluated using UV–visible diffuse reflectance spectroscopy (UV-vis DRS). As shown in Fig. 4c, CNS displays an optical absorption edge at approximately 540 nm, which is larger than that pristine COF (500 nm) and CNS (530 nm). Based on the above results, it concludes that the constructed COF/CNS heterojunction can highly improve the charge separation efficiency and reduce the migration resistance of electrons and holes, which is beneficial for improving the photocatalytic H2 evolution.
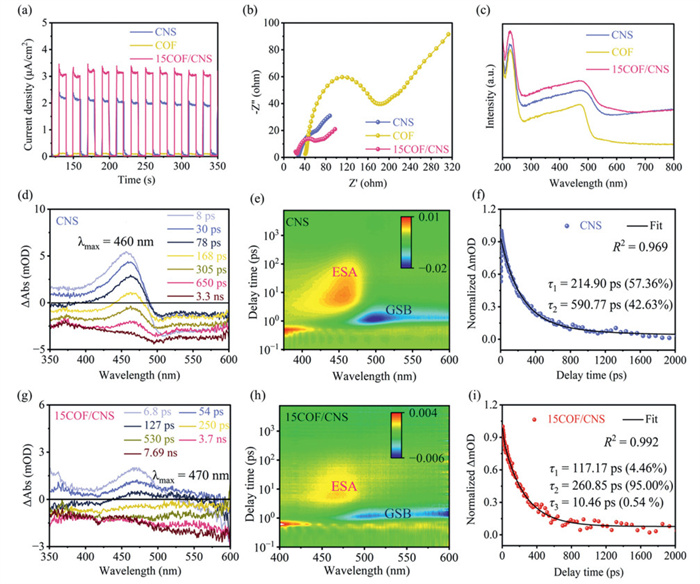
To further elucidate the charge carrier dynamics, femtosecond transient absorption (fs-TA) spectroscopy was employed. The TA spectra of CNS and 15COF/CNS (Figs. 4d and g) exhibit distinct peaks near 460 and 470 nm, respectively, corresponding to excited-state relaxation. Compared with CNS, 15COF/CNS exhibits a faster decay rate, as evidenced by the pseudo-colored fs-TA maps (Figs. 4e and h) and time-resolved profiles. The fs-TA decay kinetics were fitted at 460 nm. As shown in Fig. 4f, the faster decay time constant of τ1 (214.90 ps) in CNS is due to the trapping of photogenerated electrons by trap states near the CB edge of CNS, and the slower decay time constant of τ2 (590.77 ps) is attributed to the recombination between electrons of CB and the holes of VB. Compared with CNS, the reduced decay time constants of τ1 (117.17 ps) and τ2 (260.85 ps) in 15COF/CNS suggest that the electron relaxation is greatly accelerated (Fig. 4i), which is ascribed to the directional migration of charge carriers retarding their reverse transport. In addition, the decay time constants of 15COF/CNS are evidently reduced as illustrated in Fig. 4i, thereby proving that more efficient charge transport occurs in 15COF/CNS. The ultra-fast delay time (τ3 = 10.46 ps) corresponds to an additional dynamic process, which is attributed to charge transfer at the COF/CNS interface [58,59].
The interfacial charge transfer mechanism in the catalyst was investigated using photo-activated Kelvin probe force microscopy (KPFM). As shown in Figs. 5a-d, the surface potential distributions of CNS and 15COF/CNS were measured before and after illumination. The average surface potential of the CNS increased from 118 mV in the dark to 153 mV after irradiation, representing a potential difference of approximately 35 mV. In contrast, the surface potential of 15COF/CNS rose from −5 mV to 79 mV, exhibiting a potential difference of 84 mV (Figs. 5e and f). The results indicate that the potential difference of 15COF/CNS is significantly enhanced compared to CNS. This is attributed to light-driven electron migration from COF to CNS. This electron transfer forms an internal electric field (IEF) at its contact interface to accelerate the separation of electrons and holes and enhance transfer efficiency [60].
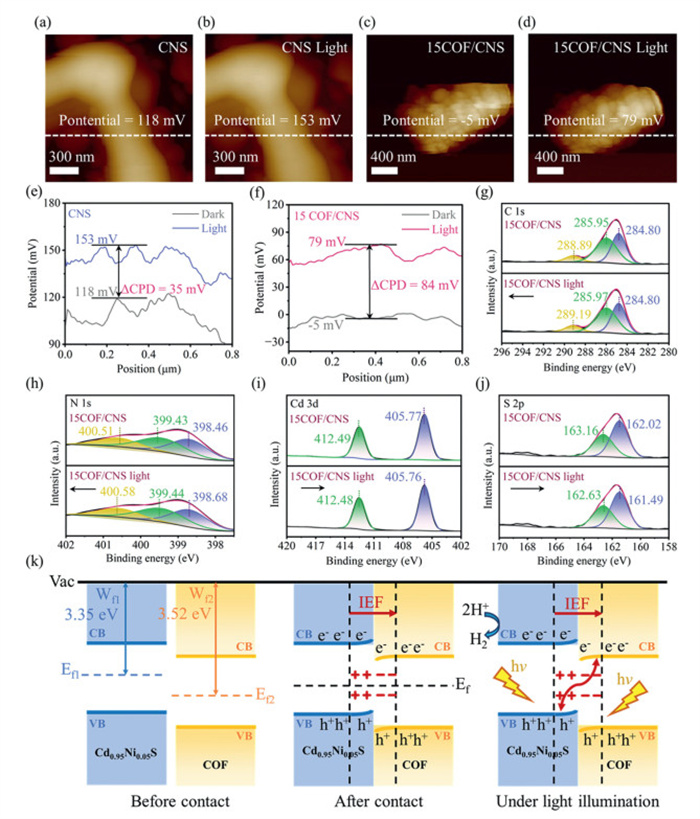
To confirm the photoreactivity mechanism, we conducted the electron spin resonance (ESR) analysis (Fig. S12 in Supporting information) with 5,5-dimethyl-1-pyrroline N-oxide (DMPO) as the trapping agent to detect superoxide radicals (·O2–) and hydroxyl radical (·OH) in an aqueous solution. No signals were observed in the dark for all the samples, indicating that ·O2– and ·OH generation requires light stimulation. This indicates that COF/CNS has both the more oxidative holes in COF and the more reductive electrons in CNS [61]. This observation indicates that the charge transfer path between COF and CNS aligns with S-scheme charge transfer.
Moreover, in-situ irradiated XPS spectra were conducted to investigate the interfacial charge transfer between CNS and COF. In the dark, the C 1s and N 1s peaks of COF/CNS shift to lower binding energies compared with COF (Figs. 5g and h), while the Cd 3d, S 2p, and Ni 2p peaks shift to higher energies relative to CNS (Figs. 5i and j, and Fig. S13 in Supporting information). This suggests electron migration from CNS to COF during composite formation, generating an IEF directed from CNS to COF. Under illumination, the C 1s and N 1s peaks shift to higher energies, whereas Cd 3d, Ni 2p, and S 2p shift to lower energies. These results indicate electron transfer from CNS to COF upon photoexcitation, providing strong evidence for an S-scheme charge migration pathway at the COF/CNS interface. DFT calculations show the charge distribution and confirmed that 0.89 electrons were transferred from CNS to COF, which is consistent with the XPS test results (Fig. S14 in Supporting information). Ultraviolet photoelectron spectroscopy (UPS) show that the work functions (Wf) of CNS and COF are 3.35 and 3.52 eV, respectively, indicating that the Fermi level of CNS is higher than that of COF (Fig. S15 in Supporting information). When the CNS/COF heterojunction forms, electrons tend to transfer from CNS to COF, which is consistent with the XPS results.
The composite materials demonstrate enhanced light absorption capacity, prolonged lifetime of photogenerated carrier, and increased active sites, resulting in significantly improved hydrogen evolution activity compared to unmodified samples. The hydrogen evolution mechanism on COF-modified CNS is illustrated in Fig. 5k. Nickel doping introduces an intermediate bandgap state, altering the electronic band structure of CdS and enhancing its light absorption capacity. This intermediate state also prolongs the lifetime of photo-generated carriers. After COF modification, the number of active sites increases, facilitating proton adsorption and H2 desorption. Under illumination, both COF and CNS are excited, with electrons being excited to their respective CB and holes being generated in the valence band. Electrons in the CB of COF transfer to the VB of CNS and recombine with holes, while excess electrons in the CB of CNS participate in hydrogen generation. Holes in the VB of COF drive the oxidation reaction. This S-scheme charge transfer mechanism accelerates charge separation, enhances activity, and promotes rapid hydrogen generation.
In conclusion, a COF/CNS heterostructure composite was successfully synthesized and thoroughly characterized. The integration of COF endows the composite with a large surface area and tunable architectures, enabling efficient charge transfer and enhanced light absorption, thereby markedly improving photocatalytic hydrogen evolution. The optimized 15COF/CNS achieved a hydrogen production rate of 750.7 µmol h-1 g-1, 2.5 times higher than of pristine CNS. This enhancement is attributed to the S-scheme charge transfer mechanism, which promotes carrier separation, suppresses electron–hole recombination, and mitigates CNS photocorrosion. Moreover, COF incorporation further increases the specific surface area and strengthens light-harvesting capability. Overall, this study presents a promising strategy for developing cost-effective and efficient CdS-based photocatalysts.
Yue Zhao: Data curation. Kezhen Qi: Writing – review & editing. Shan Wang: Formal analysis. Li Zhao: Formal analysis.
The authors declare that they have no known competing financial interests or personal relationships that could have appeared to influence the work reported in this paper.
This research was financially supported by the National Natural Science Foundation of China (Nos. 22268003 and 22568002) and Yunnan Fundamental Research Projects (Nos. 202305AF150116, 202401BA070001-035 and 202505AF350065).
Supplementary material associated with this article can be found, in the online version, at doi:
G. Cheng, X. Liu, J.Y. Xiong, et al., Chem. Eng. J. 501 (2024) 157491. doi: 10.1016/j.cej.2024.157491
L.Y. Zhu, X. Tian, G. Shi, et al., Chin. Chem. Lett. 36 (2025) 111088. doi: 10.1016/j.cclet.2025.111088
K.Z. Qi, Z.D. Wei, H.B. Wang, et al., Chin. Chem. Lett. 30 (2026) 111661.
M. Zhou, H.F. Wang, Chin. Chem. Lett. 33 (2022) 4705–4709. doi: 10.1016/j.cclet.2021.12.074
X.B. Li, Y.Y. Wan, F. Deng, et al., Chin. Chem. Lett. 36 (2025) 111418. doi: 10.1016/j.cclet.2025.111418
X.Y. Ye, Y.C. Dong, W.B. Hua, et al., Carbon Energy 5 (2025) e70024.
C. Guo, X.P. Tian, Z.X. Zhuang, et al., Chem. Eng. J. 521 (2025) 166469. doi: 10.1016/j.cej.2025.166469
R.J. Li, H.X. Li, X.D. Zhang, et al., Adv. Funct. Mater. 34 (2024) 2402797. doi: 10.1002/adfm.202402797
X.Y. Meng, S.Y. Wang, C.C. Zhang, et al., ACS Catal. 12 (2022) 10115–10126. doi: 10.1021/acscatal.2c01877
J.X. Bai, R.C. Shen, Z.M. Jiang, et al., Chin. J. Catal. 43 (2022) 359–369. doi: 10.1016/S1872-2067(21)63883-4
X.Q. Hao, Y.C. Wang, J. Zhou, et al., Appl. Catal. B: Environ. 221 (2018) 302–311. doi: 10.1016/j.apcatb.2017.09.006
Y. Wu, C. Cheng, K.Z. Qi, et al., Acta Phys. Chim. Sin. 40 (2024) 2406027. doi: 10.3866/pku.whxb202406027
J.J. Zhang, K.Z. Qi, R. Pitcheri, et al., J. Photochem. Photobiol. C Photochem. Rev. 65 (2025) 100722. doi: 10.1016/j.jphotochemrev.2025.100722
X.T. Liu, W. Li, Z. Liu, et al., Chin. Chem. Lett. 37 (2026) 111457. doi: 10.1016/j.cclet.2025.111457
P. Qiu, J.Y. Xiong, M.J. Lu, et al., J. Colloid Interf. Sci. 622 (2022) 924–937. doi: 10.1016/j.jcis.2022.04.107
C.Y. Wang, J.Y. Xiong, Z.P. Wen, et al., Ind. Eng. Chem. Res. 62 (2023) 11402–11413. doi: 10.1021/acs.iecr.3c01302
Y. Wei, G. Cheng, J.Y. Xiong, et al., J. Energy Chem. 32 (2019) 45–56. doi: 10.1117/12.2542125
Y. Tang, Y. Sun, Y.F. Li, et al., Adv. Funct. Mater. 34 (2024) 2405527. doi: 10.1002/adfm.202405527
Y.C. Zhang, X.L. Ran, H.T. Fu, et al., Adv. Funct. Mater. 34 (2024) 2404585. doi: 10.1002/adfm.202404585
Z. Qi, J.B. Chen, Q. Li, et al., Small 19 (2023) 2303318. doi: 10.1002/smll.202303318
H.S. Zhai, X.L. Liu, P. Wang, et al., Appl. Surf. Sci. 430 (2018) 515–522. doi: 10.1016/j.apsusc.2017.08.056
Y.Q. Li, S.J. Wan, W.C. Liang, et al., Small 20 (2024) 2312104. doi: 10.1002/smll.202312104
Z.Y. Xu, H.J. Liu, J.L. Yang, et al., Adv. Mater. 37 (2025) 2501091. doi: 10.1002/adma.202501091
W.X. Zhang, J.Y. Xiong, S.Z. Li, et al., Mol. Catal. 570 (2025) 114701.
H. Guo, Z.Y. Yang, L. Sun, et al., J. Colloid Interf. Sci. 659 (2024) 639–649. doi: 10.1016/j.jcis.2023.12.180
Y.L. Chen, Y. Xie, X. Sun, et al., Sens. Actuators B: Chem. 331 (2021) 129438. doi: 10.1016/j.snb.2021.129438
Y.R. Du, B.H. Xu, J.S. Pan, et al., Green Chem. 21 (2019) 4792–4799. doi: 10.1039/c9gc02126d
C.Q. Wang, S.H. Shi, F. Duan, et al., J. Mater. Chem. A 10 (2022) 16524–16532. doi: 10.1039/d2ta03461a
Y.L. Xu, X.F. Shi, R. Hua, et al., Appl. Catal. B: Environ. 260 (2020) 118142. doi: 10.1016/j.apcatb.2019.118142
J.X. Liu, K.Z. Qi, X.L. Xiang, et al., Energy Environ. Mater. 8 (2025) e70071. doi: 10.1002/eem2.70071
G.E. Tang, J.J. Zhang, C.B. Bie, et al., Adv. Mater. 37 (2025) e14576. doi: 10.1002/adma.202514576
K.Y. Zhang, G.L. Lu, Z.S. Xi, et al., Chin. Chem. Lett. 32 (2021) 2207–2211. doi: 10.1016/j.cclet.2020.12.021
Y.X. He, J.S. Zhao, Y. Sham, et al., ACS Sustain. Chem. Eng. 11 (2023) 17552–17563. doi: 10.1021/acssuschemeng.3c06421
R.Q. Gao, J.X. Bai, R.C. Shen, et al., J. Mater. Sci. Technol. 137 (2023) 223–231. doi: 10.1016/j.jmst.2022.09.001
Y.N. Feng, J.J. Li, S.H. Ye, et al., Sustain. Energy Fuels 6 (2022) 5089. doi: 10.1039/d2se01159j
C. Sun, L. Karuppasamy, L. Gurusamy, et al., Sep. Purif. Technol. 271 (2021) 118873. doi: 10.1016/j.seppur.2021.118873
D.D. Liu, C. Zhu, G. Yuan, et al., Mater. Lett. 365 (2024) 136417. doi: 10.1016/j.matlet.2024.136417
K.F. Yu, P. He, N.N. He, et al., Sci. China Mater. 66 (2023) 4680–4688. doi: 10.1007/s40843-023-2599-9
Q.W. Dong, M.L. Li, M.S. Sun, et al., Small Methods 5 (2021) e2100878. doi: 10.1002/smtd.202100878
X.F. Shi, Y.J. Yao, Y.L. Xu, et al., ACS Appl. Mater. Interfaces 9 (2017) 7481–7488. doi: 10.1021/acsami.6b16267
C.H. Li, W.Z. She, J.L. Liu, et al., Colloids Surf. A: Physicochem. Eng. Asp. 691 (2024) 133841. doi: 10.1016/j.colsurfa.2024.133841
G.T. Sun, J.J. Zhang, B. Cheng, et al., Chem. Eng. J. 476 (2023) 146818. doi: 10.1016/j.cej.2023.146818
T. Zhang, C.W. Gao, W. Huang, et al., Talanta 188 (2018) 578. doi: 10.1016/j.talanta.2018.06.032
H.W. Zhang, Q.Q. Zhu, R.R. Yuan, et al., Sens. Actuators B: Chem. 329 (2021) 129144. doi: 10.1016/j.snb.2020.129144
Y. Tang, W.Y. Li, Y. Muhammad, et al., Chem. Eng. J. 421 (2021) 129743. doi: 10.1016/j.cej.2021.129743
L. Sun, L.L. Li, J. Yang, et al., Chin. J. Catal. 43 (2022) 350–358. doi: 10.1016/S1872-2067(21)63869-X
P.L. Liang, L.Y. Yuan, K. Du, et al., Chem. Eng. J. 420 (2021) 129831. doi: 10.1016/j.cej.2021.129831
C. Zhang, Z.Z. Ai, X.L. Xu, et al., Small 21 (2025) 2411128.
N. Li, Y.P. Qiu, L.P. Li, et al., Small 21 (2025) 2408057. doi: 10.1002/smll.202408057
X.Y. Zhang, X. Wu, R.F. Chen, et al., J. Colloid Interf. Sci. 665 (2024) 100–108. doi: 10.1016/j.jcis.2024.03.104
R.M. Irfan, D.C. Jiang, Z.J. Sun, et al., J. Catal. 353 (2017) 274–285. doi: 10.1016/j.jcat.2017.06.010
Y.Y. Qin, H. Li, J. Lu, et al., Chem. Eng. J. 384 (2020) 123275. doi: 10.1016/j.cej.2019.123275
J.Y. Qiu, K. Meng, Y. Zhang, et al., Adv. Mater. 36 (2024) 2400288. doi: 10.1002/adma.202400288
W.Z. Li, Y. Liu, Z.Y. Wang, et al., J. Environ. Chem. Eng. 12 (2024) 114204. doi: 10.1016/j.jece.2024.114204
K.Y. Lin, L. Feng, D.K. Li, et al., Appl. Catal. B: Environ. 286 (2021) 119880. doi: 10.1016/j.apcatb.2021.119880
J. Wang, Y.Q. Zhang, S.J. Jiang, et al., Angew. Chem. Int. Ed. 62 (2023) e202307808. doi: 10.1002/anie.202307808
B. Qi, R.C. Shen, Z.Q. Ren, J. Mater. Sci. Technol. 232 (2025) 65–73. doi: 10.1016/j.jmst.2025.03.003
X. Fei, S. Zhang, D. Zhai, et al., Chem. Sci. 13 (2022) 9914–9920. doi: 10.1039/d2sc00263a
N. Lv, S. Lin, L. Ding, et al., Chem. Eng. J. 522 (2025) 167143. doi: 10.1016/j.cej.2025.167143
M. Wei, C. Cheng, B.W. He, et al., Acta Phys. Chim. Sin. 41 (2025) 100158. doi: 10.1016/j.actphy.2025.100158
J.Y. Lu, S.Y. Liu, R. Pitcheri, et al., Chem. Res. Chin. Univ. 41 (2025) 799–811. doi: 10.1007/s40242-025-5089-6

Figure 1 (a) Schematic illustration of the synthetic process of the COF/CNS heterostructure. TEM (b), HRTEM (c), and elemental mapping images (d) of 15COF/CNS.

Figure 2 XRD (a), small-angle XRD (b), FTIR (c), and N2 adsorption–desorption (d) of COF, CNS, and 15COF/CNS. High resolution XPS spectra of C 1s (e) and N 1s (f) for COF and 15COF/CNS. High resolution XPS spectra of S 2p (g), Cd 3d (h), Ni 2p (i) for CNS and 15COF/CNS.

Figure 3 (a) H2 evolution rates of CNS, COF, and COF/CNS composites with different mass ratios. The effects of sacrificial agent type (b), Co2+ cocatalyst (c), light exposure (d), and buffer solution pH (e) on H2 evolution rate. (f) H2 evolution in the cycle test for the COF/CNS catalyst. (g) Tauc plots of CNS, COF, and 15COF/CNS. Mott-Schottky curves of CNS (h) and COF (i).

Figure 4 Photocurrent response plots (a), EIS Nyquist plots (b), and UV–vis DRS (c) of CNS, COF and 15COF/CNS. fs-TA spectra of CNS (d) and 15COF/CNS (g) with delay time from 8 ps to 3.3 ns, pseudocolor fs-TA plots of CNS (e) and 15COF/CNS (h). Normalized ESA recovery kinetics of CNS (f) probed at 460 nm and 15COF/CNS (i) probed at 470 nm with a delay time within 2000 ps.

Figure 5 KPFM images of CNS (a, b) and 15COF/CNS with or without light irradiation (c, d). The line-scanning surface potential of CNS (e) and 15COF/CNS (f). In situ C 1s (g), N 1s (h), Cd 3d (i), and S 2p (j) XPS spectra of 15COF/CNS. (k) Charge carrier transfer mechanism in the COF/CNS heterojunction.

 扫一扫看文章


扫一扫关注我们
 DownLoad:
 下载:
 下载: