 图1
TG/DSC curves of mixture of FCG-Ni0.7Co0.15Mn0.15(OH)2 and LiOH·H2O
Figure1.
TG/DSC curves of mixture of FCG-Ni0.7Co0.15Mn0.15(OH)2 and LiOH·H2O
图1
TG/DSC curves of mixture of FCG-Ni0.7Co0.15Mn0.15(OH)2 and LiOH·H2O
Figure1.
TG/DSC curves of mixture of FCG-Ni0.7Co0.15Mn0.15(OH)2 and LiOH·H2O
Citation:
TAN Chao-Pu, HU Guo-Rong, DU Ke, LUO Hong-Jun, HUANG Dian-Hua, DUAN Jian-Guo, CAO Yan-Bing. Effect of Synthesis Temperature on the Structural and Electrochemical Properties of a Full Concentration Gradient LiNi0.7Co0.15Mn0.15O2 Cathode Material[J]. Chinese Journal of Inorganic Chemistry,
2017, 33(9): 1537-1546.
doi:
10.11862/CJIC.2017.203

合成温度对全梯度正极材料LiNi0.7Co0.15Mn0.15O2的结构和电化学性能影响
摘要:
通过控制结晶法和浓度梯度进料的方式制备了Ni、Co和Mn三元素组分含量呈全梯度分布的类球形Ni0.7Co0.15Mn0.15(OH)2前驱体,与LiOH·H2O均匀混合并焙烧后获得LiNi0.7Co0.15Mn0.15O2正极材料,系统研究了不同焙烧温度对材料Ni、Co和Mn三元素扩散情况、晶体结构及电化学性能的影响规律。通过能谱仪(EDXS)分析不同焙烧温度下材料颗粒中Ni、Co、Mn三元素的扩散程度。研究结果表明,在800℃下焙烧得到的正极材料梯度分布特征明显且电化学性能最佳,首次放电比容量为186.1 mAh·g-1(2.8~4.3 V,0.2C),2C大倍率充放电条件下循环200次后容量保持率为90.1%。这种材料兼具高比容量及良好的循环稳定性,可以用作下一代高能量密度锂离子电池正极材料。
English
Effect of Synthesis Temperature on the Structural and Electrochemical Properties of a Full Concentration Gradient LiNi0.7Co0.15Mn0.15O2 Cathode Material
Abstract:
Spherical Ni0.7Co0.15Mn0.15(OH)2 precursor with a full concentration gradient (FCG) of Ni, Co and Mn elements was obtained via co-precipitation method. The precursor was evenly mixed with LiOH·H2O and then sintered at 750~900℃ for 12 h in oxygen to synthesize FCG-LiNi0.7Co0.15Mn0.15O2 cathode material with the Ni rich in core and Mn rich in the outer layer. The diffusion of Ni, Co, and Mn under different calcination temperatures led to various elements homogeneity, and was analyzed by energy-dispersive X-ray spectroscopy (EDXS). Then, the electrochemical properties of samples were investigated by the charge-discharge test and electrochemical impedance spectroscopy (EIS) test. The results indicate that the cathode material sintered at 800℃ has an obvious concentration-gradient distribution with a shell of LiNi0.52Co0.24Mn0.24O2 and exhibits the optimal electrochemical performance. Under the voltage range 2.8~4.3 V, it deliveres an initial discharge of 186.1 mAh·g-1 at a charge-discharge rate of 0.2C, and shows an excellent capacity retention of 90.1% after 200 cycles at a high rate of 2C.
-
Key words:
- Lithium-ion battery
- / cathode material
- / full concentration-gradient
- / element diffusion
-
0 Introduction
Lithium-ion battery (LIB) has been widely used in portable electronic devices, electric vehicles and efficient energy storage systems owing to its high energy density and outstanding cycle life[1]. With further demand for the cycle life and safety of the power batteries, developing the novel cathode material with higher energy density and better rate performance is essential[2]. The layered Ni-rich LiNixCoyMn1-x-yO2 (x > 0.6) compounds with higher energy density, low toxicity and relatively low cost have attracted more attention as cathode materials for electric vehicles[3-4]. However, its poor cyclic performance, rate performance and thermal stability caused by cation mixing between Li+ and Ni2+ and the reactions with electrolytes restrict its further application[5-6].
To solve the issues such as short cycle life and poor thermal stability, extensive studies have been carried out by doping other metals such as Ti, Al or Mg into the LiNixCoyMn1-x-yO2 framework[7-9], which help to stabilize the layered structure. Another approach to stabilize the transition-metal oxide framework is to coat the materials with a layer of stable compounds such as Al2O3, SiO2, AlF3, and ZrO2, resulting in materials with modified characteristics such as superior cyclic performance[10-13]. In addition, the cathode materials such as Li(Ni1/3Co1/3Mn1/3)O2 and Li(Ni0.5Mn0.5)O2 have been coated on the material′s surface, improving the cycle performance and thermal stability of the material without significantly reducing the capacity, thus being of significant research value[14-15]. A series of researches on diverse core-shell, gradient core-shell and the full gradient materials were also developed[16-18]. For example, Sun et al. developed a concentration-gradient Li(Ni0.72Co0.18Mn0.10)O2 with a high discharge capacity of 193 mAh·g-1 (3.0~4.3 V, 0.2C rate, temperature 55 ℃), After 50 cycles, the capacity was maintained at 95.3%[19]. Du et al. synthesized spherical Li(Ni0.8Co0.1Mn0.1)O2 with a full concentration gradient (FCG) of Ni and Mn in a particle, in which the Mn concentration decreased linearly whereas the Ni concentration increased linearly from the outer layer to the center of each particle, which achieved an initial capacity of 185.2 mAh·g-1 at 1C (3.0~4.3 V, 0.2C rate, temperature 25 ℃) and retains 93.2% after 100 cycles[20]. The surface of the FCG material is abundant in stable Mn4+ while is poor in the active Ni4+ being tend to trigger phase transition. It is possible to reduce the corrosion of the electrolytic solution on the surface of the electrode material during the long-term circulation and to suppress the increase in the interfacial resistance of the material. Meanwhile, according to the relevant research, it′s worth noting that the Ni element will diffuse from the inside of the particle to the surface during the high temperature sintering process, while the Co and Mn elements will diffuse from the surface of the particle to the center[19, 21].
In this paper, Ni0.7Co0.15Mn0.15(OH)2 precursor with the FCG structure was prepared by a co-precipitated method. Then, a uniform mixture of the as-prepared precursor and LiOH·H2O was sintered at different temperature to synthesize the FCG-LiNi0.7Co0.15Mn0.15O2 cathode materials. The change of concentration gradient distribution of Ni, Co, and Mn in the products was carefully investigated. The structural properties, morphologies, and electrochemical properties of these materials were also studied in detail.
1 Experimental
1.1 Materials synthesis
FCG-Ni0.7Co0.15Mn0.15(OH)2 precursor was synthe-sized in NaOH-NH3-H2O system. According to the component design of the precursor, NiSO4·6H2O, CoSO4·7H2O, and MnSO4·H2O, with the cation′s molar ratio of nNi: nCo: nMn=0.87: 0.15: 0.15, were firstly dissolved in deionized water to prepare solution A of 2.0 mol·L-1. NiSO46H2O, CoSO4·7H2O, and MnSO4·H2O, with the cation′s molar ratio of nNi: nCo: nMn=1: 1: 1, were dissolved in deionized water to prepare solution B of 2 mol·L-1. During the co-precipitation reaction, the solution B was continuously pumped into solution A at a flow rate of 5.0 mL·min-1, while the mixed solution of A and B was maintaining stirred. Then, the mixed solution was pumped into a continuous stirred tank reactor (50 L) filled with nitrogen at a flow rate of 10.0 mL·min-1. While a NaOH precipitate solution (4.0 mol·L-1) and NH4OH solution (4.0 mol·L-1) as a chelating agent were simultaneously pumped into the reactor. The pH of the solution in the reactor was set to 11.5 and real-time monitored using an online pH analyzer. The temperature and stirring speed of the mixture in the reactor were kept at 55 ℃ and 600 rpm, respectively. With the continuous progress of the reaction, the concentration of Ni in solution A continuously decreased, while the Co and Mn contents gradually increased, forming full gradient distribution of Ni, Co, and Mn from the center to the surface of the precursor particles growing in the reactor. The volume ratio of the solution A and B was 1: 1 and two solutions were simultaneously consumed off after 40 h. Then, the obtained precipitate was filtered, washed several times and dried at 120 ℃ for 24 h. After being sieved using a 400 mesh, the as-designed FCG-Ni0.7Co0.15Mn0.15(OH)2 precursor was obtained.
The obtained spherical precursor was mixed with LiOH·H2O (a molar ratio of nLi: (nNi+nCo+nMn)=1.05: 1) uniformly using an inclined mixer and then calcined at 500 ℃ for 6 h in air. Then, the product was calcined at different temperature for 12 h in oxygen atmosphere to obtain FCG-LiNi0.7Co0.15Mn0.15O2.
1.2 Physical and chemical characterization
The chemical composition of the materials was evaluated by the inductively coupled plasma test (ICP). The structure of the samples was identified by Powder X-ray diffraction (XRD, D/max-r A type, 40 kV, 300 mA, Rigaku) using Cu Kα radiation (λ=0.154 05 nm). The XRD data were collected between 2θ range of 10°~80° and a scanning rate of 2°·min-1. The microstructure and morphology of compounds were analyzed by scanning electron microscopy (SEM FEI Quanta 750, USA) operated with an accelerating voltage of 20 kV. The chemical composition of the samples was characterized by energy disperse X-ray spectrometer (EDX-720, Japan, the acceleration voltage was 20 kV). The cross-section samples of the material particles were prepared by cutting a small amount of the material powder into the middle of the two slides, and then the SEM and EDXS analysis were conducted.
1.3 Electrochemical measurement
The material was first made into an electrode and then assembled into a CR2025 type coin cell in a glove box full of dry argon (Mikrouna, O2 and H2O ~0.5 ppm respectively) for the electrochemical performance test. A certain amount of cathode material, polyvinyli-dene fluoride (PVDF) binder and acetylene black were mixed at a mass ratio of 8: 1: 1 with N-methylpyrroli-done as a solvent in an agate mortar to form a slurry. The slurry was uniformly spread onto an aluminum foil (thickness: 14 μm) and then transferred to a vacuum oven at 110 ℃. After 12 h heating, the dried foil was punched to obtain a round electrode plate with a diameter of 11 mm, and the membrane density of electrode plate was 3.5 mg·cm-2. LiPF6 organic solution (1 mol·L-1) using mixed solvents of ethylmethyl carbonic acid ester, ethylene carbonate, and dimethyl carbonate at a volume ratio of 1: 1: 1 was used as the electrolyte. A round lithium plate with a diameter and thickness of 15.4 and 1.0 mm, respectively, was used as the negative electrode and Celgard 2400 as the separator. The fabricated coin cells were subjected to electrochemical performance test on an LAND CT2001A system with potential range of 2.8~4.3 V, a current density of 1C=180 mA·g-1, and a stabilized temperature of 25 ℃. Electrochemical impedance spectroscopy (EIS) of the battery with fully discharged state was performed using a Model 2273A electro-chemical workstation (Perkin Elmer, USA), under the frequency range 10 mHz~100 kHz and a amplitude for the AC signal of 5 mV. The battery rest for 2 h after assembling was subjected to EIS experiment. The electrochemical impedance software Zview (Version 2.1, Scribner Associates, Inc.) was performed to analyze the Impedance data.
2 Results and discussion
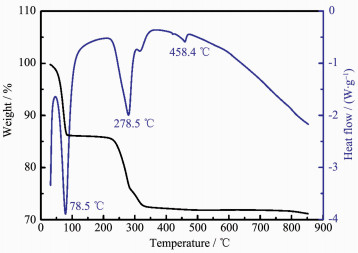
Fig. 1 shows the TG-DTA curves of the mixture of FCG-Ni0.7Co0.15Mn0.15(OH)2 precursor and LiOH·H2O. As shown in the Fig. 1, three endothermic peaks corresponding to three weight loss stages are observed within the temperature range of 50~600 ℃. Among them, the first obvious weight loss stage occurs from the room temperature to 100 ℃ results from the evaporation of water absorbed on the surface and the crystal water in the hydroxide; the second endo-thermic peak appearing at 279 ℃, can be attributed to the decomposition of M(OH)2 to the oxide of transition metal (MOx); the third endothermic peak appears at 458 ℃, caused by the combination of melting of LiOH·H2O and MOx to form Li-M-O compounds. Then, no obvious phase change is observed when the temperature is higher than 500 ℃. However, a small amount of Li2O volatilized from the mixture in case of overheat will deteriorate the material′s electro-chemical performance. Thus, an excessive amount of LiOH·H2O is added in the process of sintering to compensate the loss of Li2O by volatilization. In view of the above analysis, the synthesis of the target material FCG-LiNi0.7Co0.15Mn0.15O2 is divided into two steps: the first step is the 6 h calcination of the precursor mixed with LiOH·H2O at 500 ℃; Following is the calcination process temperature range of 750~900 ℃ to synthesize the final products.
图1
TG/DSC curves of mixture of FCG-Ni0.7Co0.15Mn0.15(OH)2 and LiOH·H2O
Figure1.
TG/DSC curves of mixture of FCG-Ni0.7Co0.15Mn0.15(OH)2 and LiOH·H2O
The XRD pattern of FCG-Ni0.7Co0.15Mn0.15(OH)2 precursor is shown in Fig. 2a. The typical diffraction peaks are indexed well with that of Ni(OH)2 with a space group of R3m[22-23], The cell parameters of the layered FCG-Ni0.7Co0.15Mn0.15(OH)2 are a=0.309 9 nm and c=0.459 0 nm, indicating that Ni2+ is partially substituted by Co2+ and Mn2+ ions in the Ni(OH)2 structure. Fig. 2b shows the XRD patterns of FCG-LiNi0.7Co0.15Mn0.15O2 cathode materials prepared at 750, 800, 850 and 900 ℃, indicating no extra reflection and the lattice type is close to that of LiNiO2 with a typical α-NaFeO2-type layered structure, and belonging to the space group of R3m. In the XRD patterns of the layered nickel-rich cathode material, the chara-cteristic peaks (006)/(102) and (108)/(110) are often used to characterize the ordering of the layered structure[24]. As shown in Fig. 2b, the (100)/(102) and (108)/(110) peaks split clearer with the calcination temperature increasing, showing that the materials have better hexagonal structure at higher temperature. The intensity ratio of (003) and (104) peaks I003/I104 is usually used to reflect the cation distribution in the lattice of the layered oxide. The larger I003/I104 and c/a indicate a lower degree of cation mixing[14, 25]. The lattice parameters a and c are listed in Table 1. As the calcination temperature increases, a and c increases, and at 800 ℃, the values of c/a and the intensities of (003) and (004) are both higher than those at other calcination temperatures. The data in the table indicate that the FCG-LiNi0.7Co0.15Mn0.15O2 cathode material sintered at 800 ℃ has a more orderly layered structure, higher crystallinity, and lower mixing extent of cation in all the samples obtained, all these characteristics correspond to a well-ordered layered structure and good electrochemical activity.
 图2
XRD patterns for FCG-Ni0.7Co0.15Mn0.15(OH)2 (a) and FCG-LiNi0.7Co0.15Mn0.15O2 (b) samples prepared at 750, 800, 850 and 900 ℃
Figure2.
XRD patterns for FCG-Ni0.7Co0.15Mn0.15(OH)2 (a) and FCG-LiNi0.7Co0.15Mn0.15O2 (b) samples prepared at 750, 800, 850 and 900 ℃
图2
XRD patterns for FCG-Ni0.7Co0.15Mn0.15(OH)2 (a) and FCG-LiNi0.7Co0.15Mn0.15O2 (b) samples prepared at 750, 800, 850 and 900 ℃
Figure2.
XRD patterns for FCG-Ni0.7Co0.15Mn0.15(OH)2 (a) and FCG-LiNi0.7Co0.15Mn0.15O2 (b) samples prepared at 750, 800, 850 and 900 ℃
 Table 1.
Lattice parameters of FCG-LiNi0.7Co0.15Mn0.15O2 samples calcined at various temperatures
Table 1.
Lattice parameters of FCG-LiNi0.7Co0.15Mn0.15O2 samples calcined at various temperatures
Temperature a/nm c/nm c/a V/nm3 I003/I104 750 ℃ 0.286 7 1.419 8 4.952 2 0.101 2 1.445 800 ℃ 0.286 8 1.421 2 4.955 4 0.101 3 1.543 850 ℃ 0.287 0 1.421 4 4.952 6 0.101 4 1.503 900 ℃ 0.287 1 1.421 8 4.952 3 0.101 5 1.317 The SEM images of the FCG-Ni0.7Co0.15Mn0.15(OH)2 precursor having aggregated spherical-like morphology with tiny spindle-like primary particles are shown in Fig. 3a and b. The particle distribution is relatively concentrated with an average size of almost 12 μm in diameter. With a good morphology and particle size distribution, the tap density of the precursor reached to 2.16 g·cm-3. As shown in Fig. 3c, the cross-section of the synthesized FCG-Ni0.7Co0.15Mn0.15(OH)2 precursor exhibits an obvious concentration-gradient distribution of Ni, Co and Mn along the direction from the center to the surface of the particle. EDXS line scanning shows that the Ni content (a molar ratio of nNi/(nNi+nCo+nMn), similarly hereinafter) decreases continuously with almost linearly change from 0.87 to 0.36, while the Co and Mn contents increase gradually from nearly 0.15 to 0.32, respectively. The distance from the center to the outer shell is close to 6 μm.
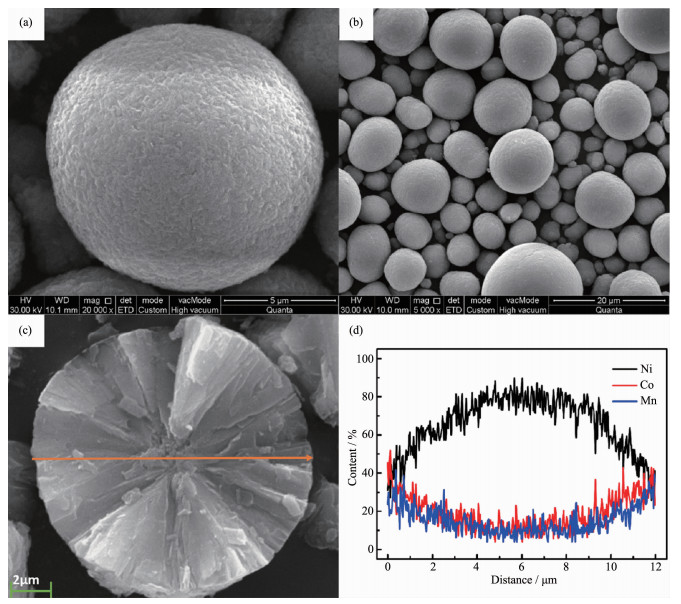 图3
SEM images of FCG-Ni0.7Co0.15Mn0.15(OH)2 samples at various temperature: ×20 000 (a), ×5 000 (b); cross-section (c) and EDXS line scanning (d) of the atomic ratio of transition metals across the diameter of a particle
Figure3.
SEM images of FCG-Ni0.7Co0.15Mn0.15(OH)2 samples at various temperature: ×20 000 (a), ×5 000 (b); cross-section (c) and EDXS line scanning (d) of the atomic ratio of transition metals across the diameter of a particle
图3
SEM images of FCG-Ni0.7Co0.15Mn0.15(OH)2 samples at various temperature: ×20 000 (a), ×5 000 (b); cross-section (c) and EDXS line scanning (d) of the atomic ratio of transition metals across the diameter of a particle
Figure3.
SEM images of FCG-Ni0.7Co0.15Mn0.15(OH)2 samples at various temperature: ×20 000 (a), ×5 000 (b); cross-section (c) and EDXS line scanning (d) of the atomic ratio of transition metals across the diameter of a particle
The SEM images of FCG-LiNi0.7Co0.15Mn0.15O2 cathode materials calcined at various temperatures are shown by Fig. 4. It is obvious that all of the material powders maintain the spherical morphology of the FCG-Ni0.7Co0.15Mn0.15(OH)2 precursor after high-temper-ature calcination. The spherical particle is actually aggregated by the larger polyhedral primary particles changed from spindle-like primary particles of the precursor. As the calcination temperature increases, the size of primary particles increases (Fig. 4). Generally, a fine grain size is conducive to the insertion and extraction of lithium-ions during charge-discharge process, resulting in the promotion of the electrochemical performance[26]. The XRD and SEM results indicate a well-ordered layered structure and good spherical morphology of the material calcined at 800 ℃.
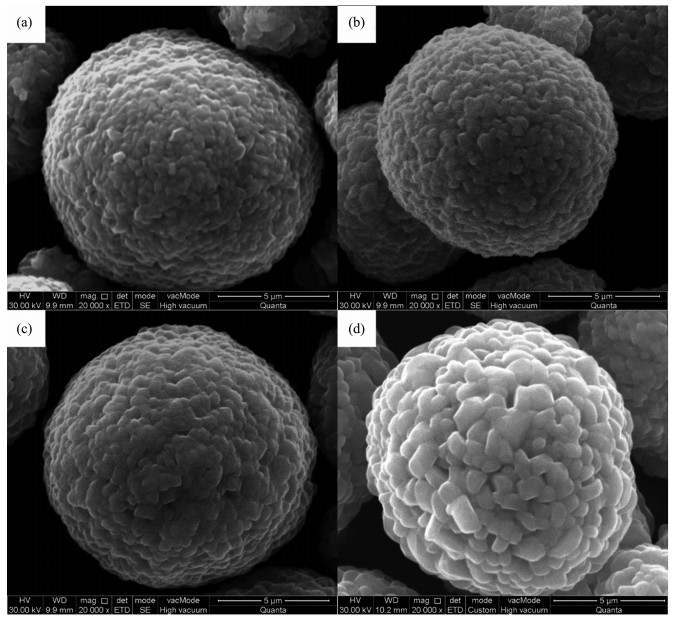 图4
SEM images of FCG-LiNi0.7Co0.15Mn0.15O2 powders calcined at various temperatures
Figure4.
SEM images of FCG-LiNi0.7Co0.15Mn0.15O2 powders calcined at various temperatures
图4
SEM images of FCG-LiNi0.7Co0.15Mn0.15O2 powders calcined at various temperatures
Figure4.
SEM images of FCG-LiNi0.7Co0.15Mn0.15O2 powders calcined at various temperatures
Fig. 5 shows the EDXS line scanning results of the cross-section of FCG-LiNi0.7Co0.15Mn0.15O2 cathode materials particles prepared by FCG-Ni0.7Co0.15Mn0.15(OH)2 precursor at different calcination temperatures within the range of 750~900 ℃. The concentration distribution of Ni, Co, and Mn varies across the diameter of the particles′ cross-section. As shown in the Fig. 5a, the distribution of these three elements has the most obvious feature of concentration gradient, with the Ni content decreasing continuously with nearly linearly change from 0.83 to 0.42, while the Co and Mn contents increasing gradually from nearly 0.15 to 0.29, respectively. However, The XRD and SEM results indicate a poor layered structure and abnormal morphology of the material calcined at 750 ℃. It can be obviously observed from Fig. 5b that with the calcination temperature reaching to 800 ℃, the Ni, Co and Mn variation of the cross-section of the lithiated oxide still retains the distribution character-istics in accordance with the FCG-Ni0.7Co0.15Mn0.15(OH)2 precursor indicated in Fig. 3c, and the Ni content decreases to 0.52 while the Co and Mn contents increase to 0.24 in the outer layer of the particle. With calcination temperature further increasing, the distribution of the three elements in the particles shows a trend of homogenization. As the calcination temperature increases to 850 and 900 ℃, the distribu-tion inside materials′ particles become significantly homogeneous, as shown in Fig. 5c and d, at 900 ℃ especially, the Ni, Co and Mn variation within the cross-section of the sample exhibit a homogeneous distribution from the center to the surface of the particle.
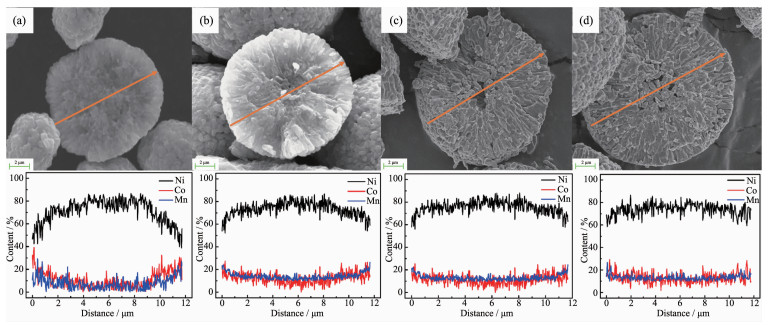 图5
SEM images of the cross-section and EDXS line scanning results of the FCG-LiNi0.7Co0.15Mn0.15O2
Figure5.
SEM images of the cross-section and EDXS line scanning results of the FCG-LiNi0.7Co0.15Mn0.15O2
图5
SEM images of the cross-section and EDXS line scanning results of the FCG-LiNi0.7Co0.15Mn0.15O2
Figure5.
SEM images of the cross-section and EDXS line scanning results of the FCG-LiNi0.7Co0.15Mn0.15O2
The electrochemical performance of the materials calcined at different temperatures is shown in Fig. 6. The cells were subjected to the first charge and discharge test at a rate of 0.2C in the voltage range of 2.8~4.3 V (Fig. 6a), while the cyclic performance is tested at the charge and discharge rate of 2C at the same potential range. The mass of the active material in the electrode plate is 3.2 to 3.3 mg. Fig. 6a illustrates the initial charge-discharge performance for samples synthesized at different calcination tempera-tures, indicating the initial discharge capacity of the materials as 174.8, 186.1, 180.2, and 176.5 mAh·g-1 accompanied by the initial charge-discharge efficiency of 88.3%, 90.1%, 86.4% and 82.7% at 750, 800, 850, and 900 ℃, respectively. As the XRD analysis shows above, the material sintered at 800 ℃ has a more orderly layered structure and the highest crystallinity in all the samples obtained, and the higher initial charge-discharge efficiency benefits from the lower mixing extent of cation[27]. Fig. 6b shows the different cyclic performance of all of the samples as-synthesized. Within the voltage range of 2.8~4.3 V, the samples calcined at 750, 800, 850, and 900 ℃ have the retention rates of 85.4%, 90.1%, 86.4%, and 80.8% after 200 cycles of charge-discharge, respectively. Above all, the higher manganese content and lower nickel content within the particles of the material calcined 800 ℃ increases the stability of the material and reduces the side reaction of the material with the electrolyte, thus inhibiting the increase of the interface impedance and enhancing the capacity retention during cycling[28]. Combined with the XRD analysis and EDXS scanning results above, the material with the most orderly layered structure and an obvious gradient distribution of the three elements at 800 ℃ shows the optimal discharge capacity and cyclic performance.
 图6
Charge/Discharge curves at 0.2C (a) and Cyclic performance at 2C (b) in 2.8~4.3 V of the FCG-LiNi0.7Co0.15Mn0.15O2 synthesized at various temperatures
Figure6.
Charge/Discharge curves at 0.2C (a) and Cyclic performance at 2C (b) in 2.8~4.3 V of the FCG-LiNi0.7Co0.15Mn0.15O2 synthesized at various temperatures
图6
Charge/Discharge curves at 0.2C (a) and Cyclic performance at 2C (b) in 2.8~4.3 V of the FCG-LiNi0.7Co0.15Mn0.15O2 synthesized at various temperatures
Figure6.
Charge/Discharge curves at 0.2C (a) and Cyclic performance at 2C (b) in 2.8~4.3 V of the FCG-LiNi0.7Co0.15Mn0.15O2 synthesized at various temperatures
The kinetic process of lithium ions intercalation/deintercalation into the electrodes can be investigated by the electrochemical impedance spectroscopy (EIS)[29]. Fig. 7a and b show the Nyquist plots of as-assembled and 200 cycles later for electrodes made from FCG-LiNi0.7Co0.15Mn0.15O2 calcined at 750, 800, 850, and 900 ℃, and it was achieved at room temperature (25 ℃) at the charged state (4.3 V), and the EIS parameters result from the test are presented in Table 2. The Nyquist plots of as-assembled and 200 cycled batteries are shown in Fig. 7c and d, which indicates the equivalent circuit model used to analyze the impedance spectra. In the models, the ohmic resistance of the electrode, separator, electrolyte, etc. in the cell is represented by Re. The capacitance and resistance of lithium ions migration through the surface film which are reflected by the semicircle in the high-frequency region is represented by R1 and CPE1; R2 and CPE2 indicate the charge transfer resistance at the electrolyte/electrode interface which are related to the second semicircle existing in the medium and lower frequency region[30-31]; Zw represents Warburg impedance which is associated with the slant in the low-frequency region, resulted from the diffusion of lithium ions in the electrode. Here, the pure capacitors are substituted by the constant-phase elements (CPE1 and CPE2).
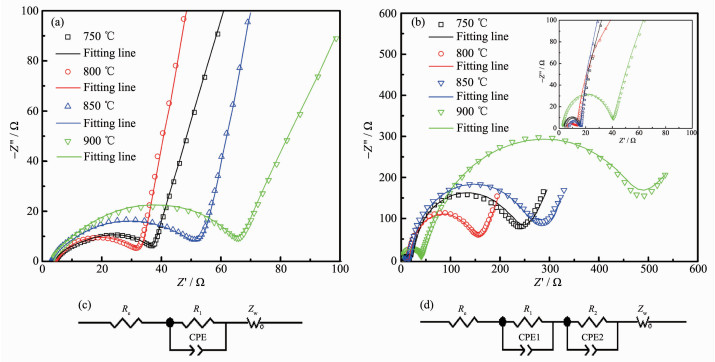 图7
Nyquist plots of FCG-LiNi0.7Co0.15Mn0.15O2 synthesized at various temperatures after 0 (a) and 200 cycles (b) and the equivalent circuit models (c, d)
Figure7.
Nyquist plots of FCG-LiNi0.7Co0.15Mn0.15O2 synthesized at various temperatures after 0 (a) and 200 cycles (b) and the equivalent circuit models (c, d)
Table 2.
Charge-transfer resistance (R2) for the FCG-LiNi0.7Co0.15Mn0.15O2 samples synthesized at various temperatures after different cycles
图7
Nyquist plots of FCG-LiNi0.7Co0.15Mn0.15O2 synthesized at various temperatures after 0 (a) and 200 cycles (b) and the equivalent circuit models (c, d)
Figure7.
Nyquist plots of FCG-LiNi0.7Co0.15Mn0.15O2 synthesized at various temperatures after 0 (a) and 200 cycles (b) and the equivalent circuit models (c, d)
Table 2.
Charge-transfer resistance (R2) for the FCG-LiNi0.7Co0.15Mn0.15O2 samples synthesized at various temperatures after different cycles
Calcined temperature 750 ℃ 800 ℃ 850 ℃ 900 ℃ R2/Ω As-assembled 32.87 27.33 47.38 61.83 200 cycles later 196.33 137.19 261.64 446.26 Chen et al. reported that the impedance of cathode, especially charge-transfer resistance R2 is the primary cause for the impedance of lithium-ion cells[32]. Thus, through comparing the second semicircle after cycles of cells which is related to R2, the difference between the surface of various materials can be obtained. As shown in Table 2, the value of the cells made of FCG-LiNi0.7Co0.15Mn0.15O2 before cycle is 32.87, 27.33, 47.38, and 61.83 Ω for the samples calcined at the temperature of 750, 800, 850, and 900 ℃, respectively. Along with the cycling of the cells, the value increases to 196.33, 137.19, 261.64, and 446.26 Ω accordingly. Therefore, with a well-ordered structure and a typical concentration gradient distribution of Ni, Co and Mn, the R2 of the FCG-LiNi0.7Co0.15Mn0.15O2 synthesized at 800 ℃ increases slowest from 27.33 Ω before cycle to 137.19 Ω after 200 cycles. Owing to the stable outer layer which has decreased Ni content and increased Mn content along with a weaker Li/Ni mixing, the FCG-LiNi0.7Co0.15Mn0.15O2 performs the stable charge-transfer resistance. Thus, as to the lowst charge-transfer resistance of the electrode /electrolyte interface, the FCG-LiNi0.7Co0.15Mn0.15O2 synthesized at 800 ℃ has an improved electrochemical performance compared with the other samples.
3 Conclusions
FCG-Ni0.7Co0.15Mn0.15(OH)2 precursor was success-fully synthesized by the special feed method in a NaOH-NH3-H2O system. The EDXS characterization results indicate that the semi-sphere of particle has an obvious concentration gradient distribution along the direction from the center to the surface. Different from the Ni-rich condition at the particle′s center, the Co and Mn enrich the outer layer of the particle with decreasing Ni element. During the process of sintering, the homogenized diffusion of the three elements in the interior of the particle is inevitable. Such diffusion process is more serious and tends to homogenize with increasing calcination temperature. Although the lower sintering temperature can maintain a more obvious concentration gradient distribution, it results in poorer layered structure and electrochemical performance. The experimental results show that all the three Ni, Co, and Mn elements still have a relatively obvious concentration gradient distribution at a sintering temperature of 800 ℃ and a surface nickel content of the 52%, respectively. The increased stable Mn4+ content and the reduced Ni4+ amount in the particle surface can do significant favor to enhance the electrochemical stability of the cathode material. Meanwhile, it has a significant influence on restraining the increase of charge-transfer resistance during cycling and thus elevates the cyclic performance. At a rate of 0.2C, the specific discharge capacity is 186.1 mAh·g-1 and the retaining capacity percentage is 90.1% even after 200 cycles at a charge-discharge rate of 2C, representing superior electrochemical performance.
-
-
[1]
Andersson A M, Abraham D P, Haasch R, et al. J. Electrochem. Soc., 2002, 149:A1358-A1369 doi: 10.1149/1.1505636
-
[2]
Goodenough J B, Kim Y. Chem. Mater., 2010, 22:587-603 doi: 10.1021/cm901452z
-
[3]
Armand M, Tarascon J M. Nature, 2008, 451:652-657 doi: 10.1038/451652a
-
[4]
Liu W, Oh P, Liu X, et al. Angew. Chem. Int. Ed., 2015, 54:4440-4458 doi: 10.1002/anie.201409262
-
[5]
Fu C, Li G, Luo D, et al. ACS Appl. Mater. Interfaces, 2014, 18:15822-15831 http://europepmc.org/abstract/med/25203668
-
[6]
张钰, 粟智, 潘会.无机化学学报, 2015, 31(9):1827-1830 http://www.cnki.com.cn/Article/CJFDTOTAL-SYQY201603027.htmZHANG Yu, SU Zhi, PAN Hui. Chinese J. Inorg. Chem., 2015, 31(9):1827-1830 http://www.cnki.com.cn/Article/CJFDTOTAL-SYQY201603027.htm
-
[7]
Mo Y, Li D, Chen Y, et al. RSC Adv., 2016, 6:75293-75298 doi: 10.1039/C6RA14796H
-
[8]
李晓炜, 林应斌, 林莹, 等.无机化学学报, 2011, 27(4):643-648 http://www.cnki.com.cn/Article/CJFDTOTAL-SYQY201603027.htmLI Xiao-Wei, LIN Ying-Bin, LIN Ying, et al. Chinese J. Inorg. Chem., 2011, 27(4):643-648 http://www.cnki.com.cn/Article/CJFDTOTAL-SYQY201603027.htm
-
[9]
Liao P Y, Duh J G, Sheu H S. J. Power Sources, 2008, 183:766-770 doi: 10.1016/j.jpowsour.2008.05.058
-
[10]
Huang Y, Chen J, Cheng F, et al. J. Power Sources, 2010, 195:8267-8274 doi: 10.1016/j.jpowsour.2010.07.021
-
[11]
Liang L, Hu G, Jiang F, et al. J. Alloys Compd., 2016, 657:570-581 doi: 10.1016/j.jallcom.2015.10.177
-
[12]
王旭阳, 叶学海, 郅晓科, 等.无机化学学报, 2013, 29(4):774-778 http://www.cnki.com.cn/Article/CJFDTOTAL-SYQY201603027.htmWANG Xu-Yang, YE Xue-Hai, ZHI Xiao-Ke, et al. Chinese J. Inorg. Chem., 2013, 29(4):774-778 http://www.cnki.com.cn/Article/CJFDTOTAL-SYQY201603027.htm
-
[13]
Kong J Z, Wang S S, Tai G A, et al. J. Alloys Compd., 2016, 657:593-600 doi: 10.1016/j.jallcom.2015.10.187
-
[14]
Cho S W, Kim G O, Ju J H, et al. Mater. Res. Bull., 2012, 47:2830-2833 doi: 10.1016/j.materresbull.2012.04.088
-
[15]
Lee K S, Myung S T, Sun Y K. J. Power Sources, 2010, 195:6043-6048 doi: 10.1016/j.jpowsour.2010.02.002
-
[16]
Myung S T, Noh H J, Yoon S J, et al. J. Phys. Chem. Lett., 2014, 5:671-679 doi: 10.1021/jz402691z
-
[17]
Du K, Hua C, Tan C, et al. J. Power Sources, 2014, 263:203-208 doi: 10.1016/j.jpowsour.2014.04.047
-
[18]
Lee E J, Noh H J, Yoon C S, et al. J. Power Sources, 2015, 273:663-669 doi: 10.1016/j.jpowsour.2014.09.161
-
[19]
Sun Y K, Kim D H, Yoon C S, et al. Adv. Funct. Mater., 2010, 20:485-491 doi: 10.1002/adfm.v20:3
-
[20]
Hua C, Du K, Tan C, et al. J. Alloys Compd., 2014, 614:264-270 doi: 10.1016/j.jallcom.2014.06.049
-
[21]
Huang Z, Gao J, He X, et al. J. Power Sources, 2012, 202:284-290 doi: 10.1016/j.jpowsour.2011.10.143
-
[22]
Kim M H, Yang K S. J. Power Sources, 2006, 159:1328-1333 doi: 10.1016/j.jpowsour.2005.11.083
-
[23]
胡国荣, 刘强, 杜柯, 等.无机化学学报, 2012, 28(6):1171-1176 http://www.cnki.com.cn/Article/CJFDTOTAL-SYQY201603027.htmHU Guo-Rong, LIU Qiang, DU Ke, et al. Chinese J. Inorg. Chem., 2012, 28(6):1171-1176 http://www.cnki.com.cn/Article/CJFDTOTAL-SYQY201603027.htm
-
[24]
Xiang M, Tao W, Wu J, et al. Ionics, 2016, 22:1003-1009 doi: 10.1007/s11581-016-1639-8
-
[25]
刘欣艳, 赵煜娟, 李燕, 等.无机化学学报, 2006, 22(6):1007-1012 http://www.cnki.com.cn/Article/CJFDTOTAL-SYQY201603027.htmLIU Xin-Yan, ZHAO Yu-Juan, LI Yan, et al. Chinese J. Inorg. Chem., 2006, 22(6):1007-1012 http://www.cnki.com.cn/Article/CJFDTOTAL-SYQY201603027.htm
-
[26]
Wu K, Wang F, Gao L, et al. Electrochim. Acta, 2012, 75:393-398 doi: 10.1016/j.electacta.2012.05.035
-
[27]
Kang S H, Abraham D P, Yoon W S, et al. Electrochim. Acta, 2009, 54:684-689 http://www.sciencedirect.com/science/article/pii/S0013468608008578
-
[28]
Abraham D P, Twesten R D, Balasubramanian M, et al. J. Electrochem. Soc., 2003, 150:A1450-A1456 doi: 10.1149/1.1613291
-
[29]
Shaju K M, Subba Rao G V, Chowdari B V R. J. Electrochem. Soc., 2003, 150:A1-A13 doi: 10.1149/1.1521754
-
[30]
Levi M D, Gamolsky K, Aurbach D, et al. Electrochim. Acta, 2000, 45:1781-1789 doi: 10.1016/S0013-4686(99)00402-8
-
[31]
Liu H, Zhang Z, Gong Z, et al. Solid State Ionics, 2004, 166:317-325 doi: 10.1016/j.ssi.2003.11.010
-
[32]
Chen C H, Liu J, Amine K. J. Power Sources, 2001, 96:321-328 doi: 10.1016/S0378-7753(00)00666-2
-
[1]
-

Figure 2 XRD patterns for FCG-Ni0.7Co0.15Mn0.15(OH)2 (a) and FCG-LiNi0.7Co0.15Mn0.15O2 (b) samples prepared at 750, 800, 850 and 900 ℃

Figure 3 SEM images of FCG-Ni0.7Co0.15Mn0.15(OH)2 samples at various temperature: ×20 000 (a), ×5 000 (b); cross-section (c) and EDXS line scanning (d) of the atomic ratio of transition metals across the diameter of a particle

Figure 4 SEM images of FCG-LiNi0.7Co0.15Mn0.15O2 powders calcined at various temperatures
(a) 750 ℃; (b) 800 ℃; (c) 850 ℃; (d) 900 ℃

Figure 5 SEM images of the cross-section and EDXS line scanning results of the FCG-LiNi0.7Co0.15Mn0.15O2
(a) 750 ℃; (b) 800 ℃; (c) 850 ℃; (d) 900 ℃

Figure 6 Charge/Discharge curves at 0.2C (a) and Cyclic performance at 2C (b) in 2.8~4.3 V of the FCG-LiNi0.7Co0.15Mn0.15O2 synthesized at various temperatures

Figure 7 Nyquist plots of FCG-LiNi0.7Co0.15Mn0.15O2 synthesized at various temperatures after 0 (a) and 200 cycles (b) and the equivalent circuit models (c, d)
Table 1. Lattice parameters of FCG-LiNi0.7Co0.15Mn0.15O2 samples calcined at various temperatures
Temperature a/nm c/nm c/a V/nm3 I003/I104 750 ℃ 0.286 7 1.419 8 4.952 2 0.101 2 1.445 800 ℃ 0.286 8 1.421 2 4.955 4 0.101 3 1.543 850 ℃ 0.287 0 1.421 4 4.952 6 0.101 4 1.503 900 ℃ 0.287 1 1.421 8 4.952 3 0.101 5 1.317  下载: 导出CSV
Table 2. Charge-transfer resistance (R2) for the FCG-LiNi0.7Co0.15Mn0.15O2 samples synthesized at various temperatures after different cycles
Calcined temperature 750 ℃ 800 ℃ 850 ℃ 900 ℃ R2/Ω As-assembled 32.87 27.33 47.38 61.83 200 cycles later 196.33 137.19 261.64 446.26
下载: 导出CSV
-


 扫一扫看文章
计量
- PDF下载量: 12
- 文章访问数: 1367
- HTML全文浏览量: 180
 下载:
下载:
