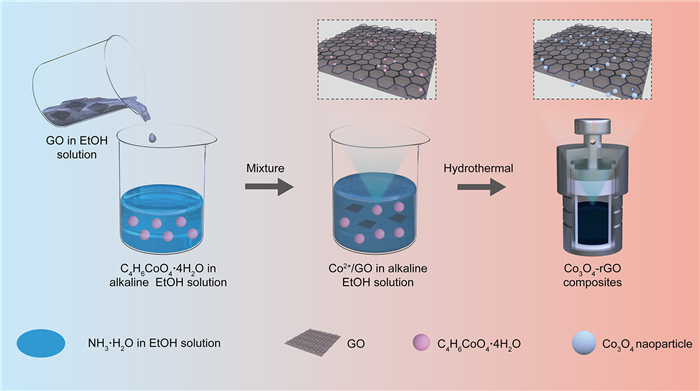
Scheme 1.
The synthesis route of ultra-small Co3O4 NCs decorated rGO nanosheets.

Exceptional domain-confined growth of Co3O4 nanocrystals-decorated reduced graphene oxide for formaldehyde sensing at low temperatures
Yu Deng , Mengli Lei , Xiaowei Cheng , Wei Luo , Yuanyuan Zhang , Yu Wang , Yidong Zou


Formaldehyde (HCHO), a typical colorless and strong-smelling gas, is widely applied in clinical medical, chemical industry, and building materials, which can inevitable release from indoor decoration, industrial manufacture, and antiseptic substances [1]. It has been regarded as well-known carcinogenic volatile organic compounds (VOCs) based on its powerful cancer-promoting effects even at low level exposure, and long-term exposure to formaldehyde gas will cause irreversible damage such as irritating coughs, bronchial asthma, chronic obstructive pulmonary disease, and interstitial pneumonia [2,3]. Thus, it is distinctly meaningful to accurately detect trace formaldehyde gas for environmental protection and human health. However, traditional detection methods are mainly relying on the expensive and bulky chromatographic or mass spectrometry (MS) devices, and it is difficult to satisfy the application requirements of portability, miniaturization and low-power detection.
In order to detect the exposed HCHO gas effectively, various formaldehyde sensors have been developed based on various efficient sensitive materials [3-7]. In recent years, a series of metal oxide semiconductors (MOS) have been designed for formaldehyde detection, such as TiO2 [8], CuO [9], SnO2 [10], ZnO [11], WO3 [12], In2O3 [13], Co3O4 [14]. Metal oxide is widely used in gas sensing because of its merits of low-cost, easy miniaturization and simple synthesis [15-20]. However, limited properties of traditional metal oxides-based sensors bring about huge obstacles for HCHO detection in practical application, such as high working temperature, low sensitivity and poor selectivity. For example, most of metal oxides are usually required high temperature of above 200 ℃ to induce the surface catalytic reaction with targeted gases to achieve the optimal sensing performance [21]. Low-temperature devices not only reduce power consumption but also significantly extend sensor lifetime [22-24]. Moreover, lacking of selectivity due to the inherent undifferentiated catalytic interaction between metal oxides and most target gases still remains more challenging [25]. Therefore, it is vital to exploiting efficient sensors with low working temperature, fast response-recovery kinetics, and good selectivity.
As the heart of gas sensors, sensitive materials directly determine the comprehensive performance of the gas sensor [26-30]. Thus, developing efficient sensitive materials is the key to solving the above-mentioned problems. Compared with traditional metal oxide materials, carbon-family materials, such as graphene, carbon nanotubes have exhibited great potentials in low temperature gas detection due to their excellent electrical conductivity, surface-active groups and easy to modify [31,32]. As a type of star material, graphene and its derivatives exhibit unique versatility in various applications, such as catalysis, gas sensor, biomedicine and energy conversion owing to their excellent properties of large surface area, thermal stability, porosity and electronic conductivity [33]. In order to combining the advantages of graphene and metal oxides, a variety of efficient semiconductor metal oxide/graphene oxide composite materials were developed for smart gas sensors, and most of them can effectively detect various gases with lower detection limit and power consumption [34-37]. The presence of functional groups on graphene oxide (GO) enhances the properties of composite, and also improves the dispersion, stability and electronic recognition ability of nanomaterials. Typically, Ye et al. developed GO modified with TiO2 by spraying and heat treatment, and the composites could be employed as efficient sensitive materials to detect sub ppm HCHO gas at room temperature [38]. Similarly, Zheng et al. prepared a room temperature HCHO sensor with high sensitivity using a vertical graphene network modified with SnO2 nanoparticles (NPs) [39]. It is well-known that the physicochemical properties of nanocrystals strongly depend on the shapes and sizes of the crystals, which can be considered as key factors determining their ultimate performance in various applications. Based on this consideration, composite materials made of metal oxide nanocrystal and graphene oxides provide a new research direction for further improving the performance of MOS-based gas sensors.
Herein, novel Co3O4 nanocrystals (NCs) with controllable sizes were in-situ introduced into reduced graphene oxide (rGO) nanosheets to construct hybrid interface, and abundant oxygen vacancies were introduced to change the properties of semiconductor hybrid materials. Meanwhile, the introduction of rGO can effectively inhibit the aggregation of Co3O4 NCs, and the sizes of Co3O4 NCs (3–20 nm) can be easily adjusted via changing the ratio of ethanol to water. The tailored composites show excellent formaldehyde sensing performance at low temperature (ca. 78 ℃), including high sensitivity, excellent selectivity and anti-humidity. Especially, when 3 nm Co3O4 NCs incorporated into 5% rGO, the gas sensor shows the optimal application performance, and even exposed to ppb-level formaldehyde.
In this study, novel Co3O4 NCs embedded-rGO hybrid materials were synthesized via one-step solvothermal method (Scheme 1), and the GO nanosheets could be employed as efficient supports for the loading of Co3O4 NCs. In the liquid-phase reaction, the quantified cobalt precursor and GO nanosheets were dissolved in ethanol, respectively, and ammonia was added dropwise to the ethanol solution of cobalt precursor. Then the two solutions were mixed via continuous stirring and the formed mixed solution was transferred to an autoclave for solvothermal treatment. Due to the abundant oxygen-containing functional groups (e.g., -OH, -COOH) on the surface of GO nanosheets, which can combine with metal ions through strong coordination, and the Co3O4 NCs generated in the solvothermal process will be firmly loaded on the surface of rGO nanosheets [40,41]. In addition, the loading of Co3O4 NCs can prevent the stacking of active rGO nanosheets, and the layered rGO nanosheets can further inhibit the agglomeration and growth of Co3O4 NCs.
TEM images of Co3O4 NCs obtained in various ratios of ethanol/water solution were shown in Figs. S1a-c (Supporting information), and it exhibited various sizes under different solution systems. Typically, the volume of ethanol was reduced from 25 mL to 20 and 10 mL, and the average sizes of Co3O4 NCs obtained were 3, 9, and 20 nm, respectively. It shows that the amount of ethanol has a great influence on the size of Co3O4 NCs, and the size of Co3O4 NCs increased gradually with the decrease of ethanol content. Therefore, it can be found that the crystal size of Co3O4 NCs can be effectively controlled by changing the ratio of ethanol to water in the reaction system. It is well known that the polarity of ethanol is lower than that of water, and thus the content of ethanol directly affects the polarity of ethanol/water mixed solvent. In general, the polarity of the mixed solvent is lower when the amount of ethanol is increased. It shows that the size of Co3O4 NCs obtained in low polarity solvent is smaller than that in high polarity solvent. This phenomenon can be explained by the following description: There are a lot of hydroxyl groups on the surface of Co3O4 NCs (or their precursors), which can induce ethanol molecules adsorb on the surface of Co3O4 NCs (or their precursors) through hydrogen bonds. In the system with higher ethanol content, more ethanol molecules will be adsorbed on the surface, which inhibits the growth and aggregation of Co3O4 NCs, resulting in smaller crystal size [42]. It can be seen that the obtained Co3O4 NCs have good dispersion in ethanol (Fig. S1d in Supporting information).
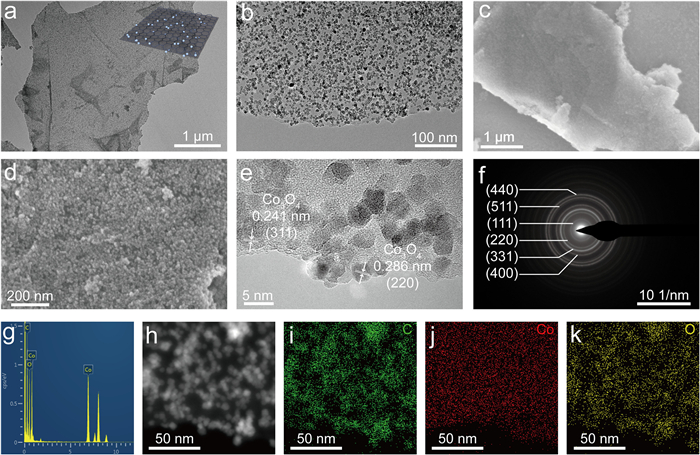
It can be clearly seen the nearly transparent GO nanosheets from the transmission electron microscopy (TEM) image with ultrathin size (Fig. S2 in Supporting information), and there is typical wrinkle structure on the surface of the GO nanosheets, which may be due to the raw graphene material undergoes a strong oxidation process. Polar groups (hydroxyl, carboxyl, etc.) destroy the π bond in the GO layer or change the van der Waals force between the layers, which causes the plane to be twisted. The designed Co3O4-rGO composites loaded of Co3O4 NCs with tunable sizes can be prepared by adding GO nanosheets into the system of synthesizing Co3O4 NCs. TEM images of Co3O4-rGO composites indicated that the size of Co3O4 NCs increased with the increase of water content in the reaction system (Figs. 1a and b, Fig. S3 in Supporting information). Similarly, the size of Co3O4 NCs is < 25 nm, and the smallest is about 3 nm, and the smaller size of Co3O4 NCs can make full use of the size effect of inorganic nanomaterials.
In addition, the tailored Co3O4-rGO composites can also be clearly observed from scanning electron microscopy (SEM) images (Figs. 1c and d, Fig. S4 in Supporting information), which is consistent with the results observed in TEM images. According to the high-resolution TEM (HRTEM) image (Fig. 1e), the formed Co3O4 NCs possess high crystallinity, and the selected-area electron diffraction (SAED) pattern of Co3O4-rGO composite shows the typical diffraction rings (Fig. 1f), which well matches the crystal surfaces of (111), (220), (311), (400), (511) and (440) planes of cubic Co3O4 (JCPDS No. 42–1467). It indicates that the synthesized Co3O4 NCs possess great crystalline properties. In addition, the energy dispersive X-ray spectroscopy (EDS) (Fig. 1g) confirmed the existence of C, O and Co and the homogeneous distribution of three elements in Co3O4-rGO composite could be observed by the elemental mapping of elements (Figs. 1h-k).
The X-ray diffraction (XRD) spectra of Co3O4 and Co3O4-rGO composites exhibited the well-resolved diffraction peaks at 19.0°, 31.3°, 36.9°, 44.9°, 59.6° and 65.3°, respectively, which could be indexed to (111), (220), (311), (400), (511) and (440) reflections of Co3O4, respectively (Fig. 2a). Interestingly, without correlation peak of rGO was observed in the pattern, which might be due to the low content of rGO in the complex. Fourier transform infrared (FTIR) spectrum of Co3O4-rGO composite showed two intense symmetric bands at 579 and 664 cm−1 (Fig. 2b), corresponding to the vibration of Co3+ and the stretching vibration of Co2+, which also confirmed the existence of Co3O4 in the composite [43]. Besides, the characteristic bands of oxygen-containing groups are also shown in the IR spectra. There is an obvious wide peak near 3410 cm−1, which may be due to the stretching vibration of hydroxyl group or the influence of water molecules [44]. However, the peak positions of Co3O4-rGO and Co3O4 near 3410 cm−1 are obviously shifted, which are attributed to the weak interaction between Co3O4 NCs and rGO nanosheets. The Raman peaks at 192, 468, 520 and 672 cm−1 correspond to the F2g, Eg, F2g and A1g active modes of Co3O4, respectively (Fig. 2c) [45]. In addition, the N2 adsorption-desorption isotherm and pore size distribution of Co3O4-rGO samples are shown in Figs. 2d and e. The pore size of the sample is 3.76 nm and the specific surface area is 135.98 m2/g, and the larger specific surface area can provide abundant adhesion sites for Co3O4 NCs. The Co3O4-rGO composites and Co3O4 (3 nm) were conducted by Mott-Schottky measurements. The Mott-Schottky plots of the Co3O4 (3 nm) display clear negative slopes, confirming its typical p-type semiconductor behavior (Fig. S5 in Supporting information). The negative slopes can be also observed for Co3O4-rGO composites (Fig. 2f), indicating the formation of p-p heterojunctions.
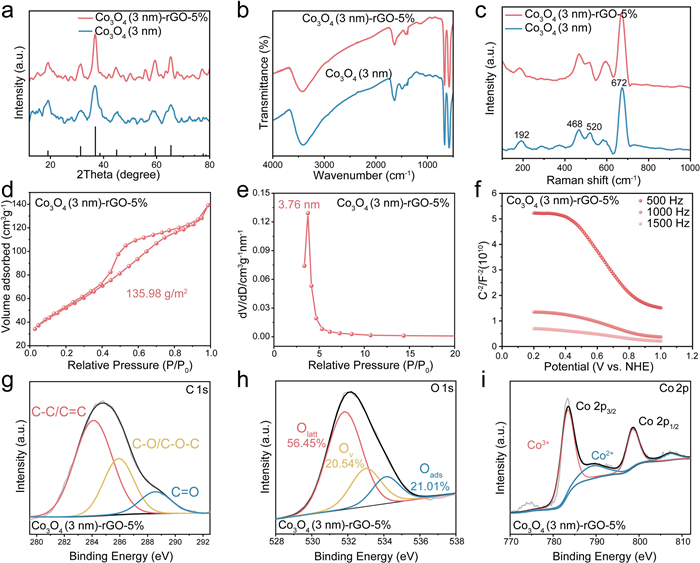
The phase composition of Co3O4 NCs and Co3O4-rGO composites was further characterized by X-ray photoelectron spectroscopy (XPS). According to Fig. 2g, the C 1s orbital of Co3O4-rGO composite can be fitted with three peaks, where 284.0, 286.0 and 288.5 eV are assigned to C—C/C═C, C—O/C—O—C and C═O, respectively [46]. The narrow-scan O 1s XPS spectrum can be fitted with three significant peaks at 531.8, 533.0 and 534.1 eV (Fig. 2h), which can be corresponded to lattice oxygen (Olatt), oxygen vacancies (Ov) and dissociative adsorption oxygen species (Oads) [47,48]. For pure Co3O4 (3 nm) NCs, the O 1s spectrum can also be fitted with three significant peaks at 531.4, 532.7 and 533.9 eV (Fig. S6a in Supporting information). Based on the calculation of integral area, the content of adsorption oxygen (Ov and Oads) is about 41.55% for Co3O4 (3 nm)-rGO-5%, higher than Co3O4 (3 nm) NCs (38.03%). Moreover, the Co 2p XPS spectrum of the composite contains two peaks with binding energies of 783.0 and 798.5 eV (Fig. 2i), which are attributed to the spin orbit peaks of Co 2P3/2 and Co 2p1/2, respectively. In addition, two weak satellite peaks appeared along with the two main peaks, which is very consistent with the typical characteristics of Co3O4 phase [48]. The two main peaks of the Co 2p spectrum of pure Co3O4 are located at 780.7 and 795.9 eV, respectively (Fig. S6b in Supporting information). Compared with pure Co3O4, the peak position of Co 2p spectrum of the above composites shows higher binding energy, which indicates that there is a certain surface interaction between Co3O4 NCs and rGO.
In order to verify that the prepared Co3O4-rGO heterojunction materials have excellent gas sensing properties and observe the difference of gas sensing properties caused by different sizes of Co3O4, and a series of gas sensors based on Co3O4 NCs and Co3O4-rGO sensitive materials have been fabricated and evaluated their gas sensing properties via batch experiments.
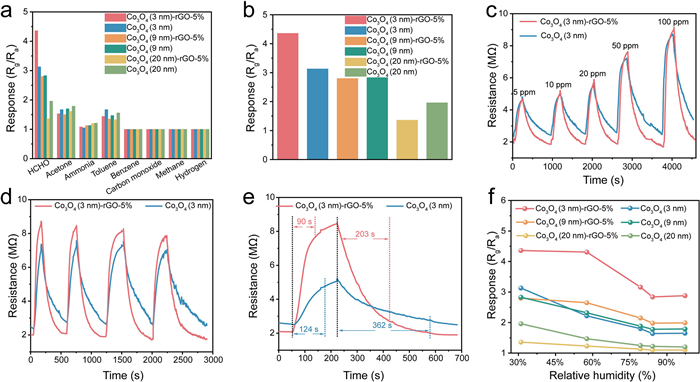
In order to determine the selectivity of the materials, the sensitivity of Co3O4 NCs and Co3O4-rGO samples are tested toward 50 ppm different interference gases at 78 ℃ (Fig. 3a). It is found that Co3O4 and Co3O4-rGO samples (except for Co3O4 (3 nm)-rGO-5%) have the highest sensitivity to formaldehyde gas, which may be due to the fact that when the size of the NCs is large (20 nm), the lamellar rGO has lost its function of dispersing crystals and its covering effect on the material leads to a reduction in exposed active sites. For pure Co3O4 NCs, the sensitivity to formaldehyde gradually decreases with the increase of crystal size, and the Co3O4-rGO series samples also show the same change phenomenon (Fig. 3b). Except for Co3O4 (3 nm)-rGO-5%, the performance of the samples loaded with rGO was improved, and the samples loaded with 3 nm Co3O4 NCs toward formaldehyde exhibited the highest response. Co3O4 NCs and Co3O4-rGO samples have good response-recovery performance to formaldehyde gas (Fig. 3c). When Co3O4 (3 nm)-rGO-5% samples were exposed to formaldehyde gas with low concentration (0.1 ppm-1.0 ppm), the materials still exhibited excellent response and kinetics (Fig. S7 in Supporting information). Moreover, the materials have good cycle stability (Fig. 3d). As shown in Fig. 3e, the response and recovery time of Co3O4-rGO material is shorter than that of pure Co3O4 NCs. In addition, the baseline resistance of Co3O4-rGO composites is lower due to the introduction of rGO increases the carrier mobility of the composites. When the humidity of the test environment increased from 30% to 100%, the sensitivity of each sample decreased, but it still had a good response when the humidity was 100% (Fig. 3f).
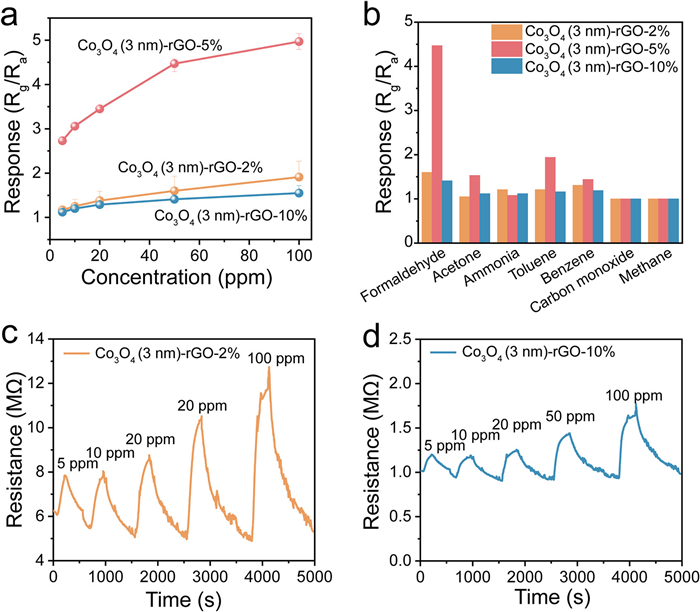
Based on the above tests, the gas sensing properties of Co3O4-rGO composites with different graphene oxide weight loading (i.e., 2%, 5%, 10%) were further evaluated, and the crystal size of Co3O4 NCs was controlled in 3 nm. With the increase of rGO content, the density of Co3O4 NCs distributed on the rGO nanosheets became much lower due to the increased overall interface for growth of Co3O4 NCs. When the loading amount of rGO nanosheets is 2%, the aggregation phenomenon of Co3O4 NCs is obvious (Figs. S8a and b in Supporting information). However, when the loading amount of GO nanosheets increased to 10%, the density of Co3O4 NCs on the layer is significantly reduced (Figs. S8c and d in Supporting information). In addition, the gas sensing properties of Co3O4-rGO samples with different graphene oxide content were also compared. As shown in Figs. 4a and b, when the addition amount of rGO is 5%, it shows the optimal sensing performance toward formaldehyde gas, including the selectivity and sensitivity. All the as-made Co3O4-rGO composites with different rGO loading (2%, 5%, 10%) have good response-recovery performance (Figs. 4c and d).
To further elucidate the sensing mechanism, in-situ DRIFTS spectra were recorded to gain information during the HCHO sensing process (Figs. 5a and b). The experiment was initiated by introducing a mixture of HCHO and air into the reaction chamber for 20 min at a precisely controlled temperature of 78 ℃. As clearly depicted in Fig. 5a, characteristic absorption bands associated with various reaction intermediates and products were observed. Specifically, bands associated with dioxymethylene species (1356 cm–1), formate species (2938 and 1597 cm–1), carbonate species (1642 and 1259 cm−1) and the doublet at 2377 and 2337 cm–1 were assigned to the stretching vibrations of CO2 [49]. Notably, the intensities of these bands increased steadily over time, suggesting continuous chemical reactions occurring on the sensing material surface. Subsequently, the supply of HCHO was terminated, and a stream of pure air was introduced into the system for an additional 20 min. As shown in Fig. 5b, the absorption bands of the intermediate species gradually diminished, indicating their decomposition and subsequent conversion into CO2. In this process, the active sites will be set free, enabling it to participate in subsequent sensing cycles. Based on above results, these reaction processes are described in Eqs. 1–6.
|
|
(1) |
|
|
(2) |
|
|
(3) |
|
|
(4) |
|
|
(5) |
|
|
(6) |
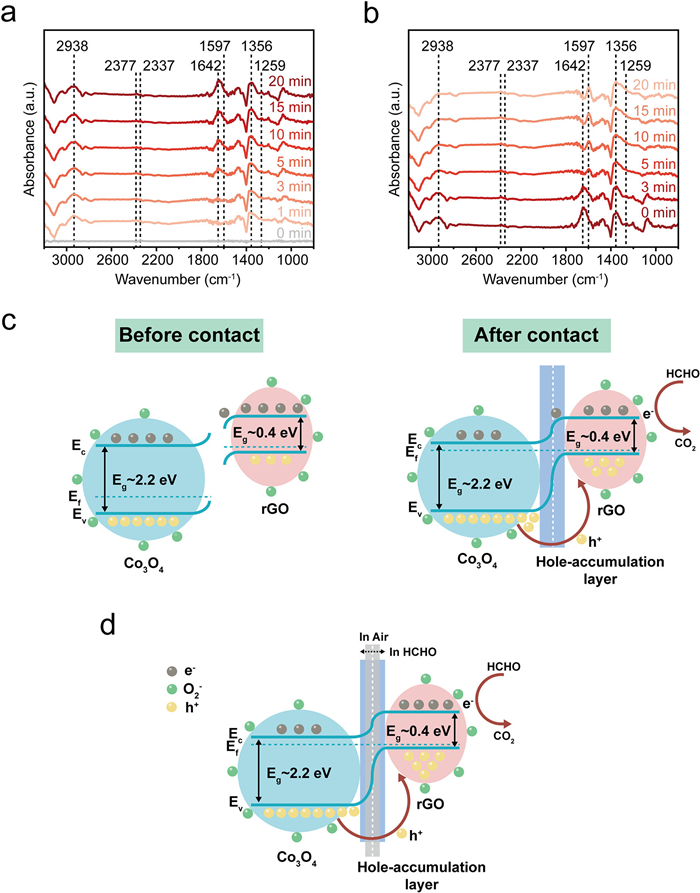
Considering that the formed Co3O4-rGO composites is typical p-p heterojunction, and the sensing mechanism of the Co3O4 (3 nm)-rGO-5% sensor follows the surface-resistance-controlled model. As illustrated in Fig. 5c, the schematic diagrams depict the formation of p-p heterojunctions before and after gas exposure. Due to the distinct work functions of Co3O4 and rGO, an interaction occurs between Co3O4 NCs and rGO [48,50]. This interaction facilitates the migration of holes from Co3O4 to rGO and electrons in the opposite direction, until equilibrium is achieved at both Fermi levels. The formation of p-p heterojunctions, combined with changes in the thickness of the hole-accumulation layer at the heterojunction interface, significantly contributes to the enhanced detection capabilities of the sensor (Fig. 5d). In an air environment, electrons captured by adsorbed oxygen increase the concentration of holes near the surface. When exposed to reducing HCHO gas, chemisorbed HCHO further increases the number of available holes near the material surface, thickening the hole-accumulation layer and further increasing the resistance (Fig. 5d). The combination of rGO with Co3O4 NCs not only reduces the electrical resistance in air but also increases it upon HCHO exposure. This phenomenon can be attributed to the reaction between O2- ions and HCHO, which leads to the decomposition of HCHO into CO2 and the release of electrons, ultimately causing the increase in resistance.
The Co3O4-rGO based sensor has excellent formaldehyde sensing performance, which can be explained from the following aspects. Firstly, highly dispersed Co3O4 NCs have excellent catalytic activity, favoring gas sensing process. Secondly, the conductivity of rGO nanosheets is much better than that of Co3O4 NCs. Adding an appropriate amount of rGO nanosheets can improve the conductivity of the composite, thus accelerating the electron transfer and improving the low-temperature formaldehyde sensing performance [40]. The addition of rGO nanosheets improve the dispersion of Co3O4 NCs. All these are beneficial to improve the sensing performance of formaldehyde. Finally, when p-type Co3O4 NCs are combined with p-type rGO, numerous p-p heterojunction interfaces can be formed for enhanced resistance changes during gas sensing [21].
In conclusion, inspired by the concept of “nanocrystals catalysis-sensing”, tailored active Co3O4 nanocrystals were elaborately designed via a facile solvothermal synthesis technique, and the abundant functional groups on the surface of rGO could facilitate the in-situ growth of ultra-small Co3O4 NCs to produce Co3O4-rGO heterojunctions by one-step solvothermal method. The composite showed excellent sensing performance towards formaldehyde at low temperature (78 ℃). When the size of Co3O4 NCs is 3 nm and the content of rGO nanosheets is 5 wt%, the designed composites exhibit the optimal sensing performance, even toward ppb-level formaldehyde gas. The excellent formaldehyde sensing performance is attributed to the high catalytic activity of Co3O4 NCs which were well dispersed in the rGO nanosheets with good conductivity. The design of Co3O4-rGO heterojunctions via in situ solvothermal reaction can be extended to synthesize other functional nanocomposites for various applications.
Yu Deng: Writing – review & editing, Writing – original draft, Investigation, Formal analysis. Mengli Lei: Writing – review & editing, Writing – original draft, Investigation. Xiaowei Cheng: Writing – review & editing, Investigation, Formal analysis. Wei Luo: Writing – review & editing, Writing – original draft, Supervision. Yuanyuan Zhang: Investigation. Yu Wang: Supervision. Yidong Zou: Supervision.
The authors declare that they have no known competing financial interests or personal relationships that could have appeared to influence the work reported in this paper.
This work was supported National Natural Science Foundation of China (Nos. 52225204, W2511047, 52173233), AI-Enhanced Research Program of Shanghai Municipal Education Commission (No. SMEC-AI-DHUZ-04), the Natural Science Foundation of Shanghai (Nos. 23ZR1479200, 25ZR1402515), the Innovation Program of Shanghai Municipal Education Commission (No. 2021-01-07-00-03-E00109), the Shanghai Scientific and Technological Innovation Project (No. 24520712800), the Fundamental Research Funds for the Central Universities (Nos. 2232024Y-01, 22120240298 and CUSF-DH-T-2024022) and the DHU Distinguished Young Professor Program (No. LZA2022001).
Supplementary material associated with this article can be found, in the online version, at doi:
T. Salthammer, S. Mentese, R. Marutzky, Chem. Rev. 110 (2010) 2536–2572. doi: 10.1021/cr800399g
Y. Tang, Y. Zhao, W. Lin, Nat. Protoc. 15 (2020) 3499–3526. doi: 10.1038/s41596-020-0384-7
N. Wang, Z. Liu, Y. Zhou, et al., Small 20 (2024) 2310465. doi: 10.1002/smll.202310465
Z. Chen, J. Wang, X. Liu, et al., J. Am. Chem. Soc. 147 (2025) 3478–3487. doi: 10.1021/jacs.4c14808
H. Liang, X. Guo, L. Guo, et al., Adv. Funct. Mater. 33 (2023) 2215099. doi: 10.1002/adfm.202215099
Y. Geng, Y. Cao, R. Wu, et al., Adv. Funct. Mater. 35 (2025) 2422578. doi: 10.1002/adfm.202422578
J. Zhang, F. Lv, Z. Li, et al., Adv. Mater. 34 (2022) 2105276. doi: 10.1002/adma.202105276
S. Shao, H.W. Kim, S.S. Kim, Y. Chen, M. Lai, Appl. Surf. Sci. 516 (2020) 145932. doi: 10.1016/j.apsusc.2020.145932
W. Geng, Z. Ma, Y. Zhao, et al., Sens. Actuator. B: Chem. 325 (2020) 128775. doi: 10.1016/j.snb.2020.128775
L. Zhou, X. Chang, W. Zheng, X. Liu, J. Zhang, Chem. Eng. J. 475 (2023) 146300. doi: 10.1016/j.cej.2023.146300
L.X. Zhang, M.M. Zhao, Y.Y. Yin, Y. Xing, L.J. Bie, Rare Met. 41 (2022) 2292–2304. doi: 10.1007/s12598-021-01946-3
J.H. Li, J. Wu, Y.X. Yu, Appl. Surf. Sci. 546 (2021) 149104. doi: 10.1016/j.apsusc.2021.149104
L. Zhu, J. Wang, J. Liu, et al., Sens. Actuator. B: Chem. 403 (2024) 135129. doi: 10.1016/j.snb.2023.135129
R. Zhang, S. Cao, T. Zhou, et al., Sens. Actuator. B: Chem. 310 (2020) 127695. doi: 10.1016/j.snb.2020.127695
A. Sharma, S.B. Eadi, H. Noothalapati, et al., Chem. Soc. Rev. 53 (2024) 2530–2577. doi: 10.1039/d2cs00761d
J. Li, Z. Wang, Y. Deng, et al., Chin. Chem. Lett. 35 (2024) 110111. doi: 10.1016/j.cclet.2024.110111
Y. Deng, Y. Liu, Y. Deng, et al., Chin. Chem. Lett. 35 (2024) 108898. doi: 10.1016/j.cclet.2023.108898
H. Zhang, H. Wang, J. Zhang, et al., Chin. Chem. Lett. 37 (2026) 111180. doi: 10.1016/j.cclet.2025.111180
B. Shen, T. Yuan, W. Zhang, Y. Chen, J. Xu, Chin. Chem. Lett. 35 (2024) 109490. doi: 10.1016/j.cclet.2024.109490
H. Zhang, S. Guo, Y. Chen, et al., Chin. Chem. Lett. 37 (2026) 111328. doi: 10.1016/j.cclet.2025.111328
J. Hu, Y. Zou, Y. Deng, et al., Prog. Mater. Sci. 150 (2025) 101409. doi: 10.1016/j.pmatsci.2024.101409
B. Feng, Y. Feng, Y. Li, et al., ACS Sens. 7 (2022) 3963–3972. doi: 10.1021/acssensors.2c02232
P. Li, L. Diao, X. Liao, et al., Nano Lett. 25 (2025) 8243–8250. doi: 10.1021/acs.nanolett.5c01309
B. Feng, Z. Wang, Y. Feng, et al., ACS Nano 18 (2024) 22888–22900. doi: 10.1021/acsnano.4c03566
P.M. Bulemo, D.H. Kim, H. Shin, et al., Chem. Rev. 125 (2025) 4111–4183. doi: 10.1021/acs.chemrev.4c00592
J. Hu, F. Wang, J. Yu, et al., Chin. Chem. Lett. 37 (2026) 110863. doi: 10.1016/j.cclet.2025.110863
Y. Chen, L. Liu, J. Li, et al., Chin. Chem. Lett. 37 (2026) 111654. doi: 10.1016/j.cclet.2025.111654
J. Li, X. Chen, X. Zhu, et al., Chin. Chem. Lett. 35 (2024) 108286. doi: 10.1016/j.cclet.2023.108286
Z. Zhou, J. Song, Y. Xie, et al., Chin. Chem. Lett. 36 (2025) 110906. doi: 10.1016/j.cclet.2025.110906
Y. Chen, J. Xu, Y. Pan, Q. Cao, K. Yuan, Chin. Chem. Lett. 37 (2026) 110606. doi: 10.1016/j.cclet.2024.110606
Z. Xiao, L.B. Kong, S. Ruan, et al., Sens. Actuator. B: Chem. 274 (2018) 235–267. doi: 10.1016/j.snb.2018.07.040
F. Yin, W. Yue, Y. Li, et al., Carbon 180 (2021) 274–297. doi: 10.1016/j.carbon.2021.04.080
J. Wu, H. Lin, D.J. Moss, K.P. Loh, B. Jia, Nat. Rev. Chem. 7 (2023) 162–183. doi: 10.1038/s41570-022-00458-7
A.D. Ugale, G.G. Umarji, S.H. Jung, et al., Sens. Actuator. B: Chem. 308 (2020) 127690. doi: 10.1016/j.snb.2020.127690
J. Han, Y. Wang, W. Zhou, et al., Sens. Actuator. B: Chem. 422 (2025) 136613. doi: 10.1016/j.snb.2024.136613
H. Wu, N. Yu, Y. Yuan, S. Wang, Sens. Actuator. B: Chem. 427 (2025) 137157. doi: 10.1016/j.snb.2024.137157
J. Zhang, X. Jia, T. Liu, et al., Sens. Actuator. B: Chem. 359 (2022) 131601. doi: 10.1016/j.snb.2022.131601
Z. Ye, H. Tai, T. Xie, et al., Sens. Actuator. B: Chem. 223 (2016) 149–156. doi: 10.1016/j.snb.2015.09.102
Z. Bo, M. Yuan, S. Mao, et al., Sens. Actuator. B: Chem. 256 (2018) 1011–1020. doi: 10.1016/j.snb.2017.10.043
W. Zhang, H. Xu, F. Xie, et al., Nat. Commun. 13 (2022) 471. doi: 10.1007/978-3-031-13822-5_42
Y. Dong, K. He, L. Yin, A. Zhang, Nanotechnology 18 (2007) 435602. doi: 10.1088/0957-4484/18/43/435602
X. Liang, X. Wang, J. Zhuang, et al., Adv. Funct. Mater. 16 (2006) 1805–1813. doi: 10.1002/adfm.200500884
W. Liu, Y. An, X. Zhang, et al., Adv. Funct. Mater. 34 (2024) 2313274. doi: 10.1002/adfm.202313274
P.-H. Chang, Y. Yang, Y. Wen, et al., Chem. Eng. J. 500 (2024) 156379. doi: 10.1016/j.cej.2024.156379
L. Nowakowski, C. Hudy, F. Zasada, et al., J. Am. Chem. Soc. 146 (2024) 24450–24466. doi: 10.1021/jacs.4c06587
Y. Liu, J. Li, A. Das, et al., J. Am. Chem. Soc. 143 (2021) 21532–21540. doi: 10.1021/jacs.1c07236
B. Xiao, X. Liu, Z. Xie, et al., Chem. Eng. J. 503 (2025) 158269. doi: 10.1016/j.cej.2024.158269
L. Zhao, C. Xin, C. Yu, et al., InfoMat 7 (2025) e12634. doi: 10.1002/inf2.12634
G. Fan, L. Nie, H. Wang, et al., Sens. Actuator. B: Chem. 373 (2022) 132640. doi: 10.1016/j.snb.2022.132640
T. Haldar, J.W. Shiu, R.X. Yang, et al., ACS Sens. 9 (2024) 5856–5865. doi: 10.1021/acssensors.4c01397

Figure 1 (a, b) TEM images, (c, d) FESEM images, (e) high-resolution TEM image, (f) the corresponding SAED pattern, (g-k) energy-dispersive X-ray spectroscopy element mapping of Co3O4 (3 nm)-GO-5%. The inset in (f) is the selected area electron diffraction (SAED) pattern.

Figure 2 Characterization and analysis of Co3O4 NCs and Co3O4-rGO composites. (a) XRD patterns, (b) FTIR spectra, (c) Raman spectra of Co3O4 and Co3O4-rGO composites. (d) N2 adsorption-desorption isotherms and (e) pore size distribution curve of Co3O4 (3 nm)-rGO-5%. (f) Mott-Schottky plots of Co3O4 (3 nm)-rGO-5% measured at 500, 1000 and 1500 Hz. XPS spectra of Co3O4 (3 nm)-rGO-5%: (g) C 1s (h) O 1s, and (i) Co 2p.

Figure 3 Gas sensing performances of Co3O4 NCs and Co3O4-rGO composites at 78 ℃. (a) Selectivity of sensors toward 50 ppm various gases. (b) Response of sensors toward 50 ppm HCHO. (c) Response-recovery curves of sensors to different concentration of HCHO. (d) Cyclic curve and (e) response-recovery curve of sensors to 50 ppm HCHO. (f) Response of sensitive materials toward 50 ppm HCHO under different humidity conditions.

Figure 4 (a) Response of Co3O4-rGO composites sensors to different concentration of HCHO, (b) Response of Co3O4-rGO composites sensors to 50 ppm different gases, (c, d) Response-recovery curves of Co3O4-rGO composites sensors to HCHO.

Figure 5 In-situ DRIFTS spectra of Co3O4 (3 nm)-rGO-5% at 78 ℃ (a) in a flow of HCHO + air for 20 min and (b) followed by high-pure air purging for 20 min. (c) Illustration of the formation of the p-p heterojunction of Co3O4 and rGO, and (d) energy band diagram of Co3O4 NCs combined with rGO.

 扫一扫看文章


扫一扫关注我们
 DownLoad:

 下载:
 下载: