Citation:
Zhi-Long Li, Hao-Fei Ni, Bo Zhuang, Kun Ding, Da-Wei Fu, Qiang Guo, Meng-Meng Lun. Halogen substitution strategy for regulating the photoluminescence and dielectric response of ferroelastics[J]. Chinese Chemical Letters,
2026, 37(4): 110755.
doi:
10.1016/j.cclet.2024.110755
Halogen substitution strategy for regulating the photoluminescence and dielectric response of ferroelastics
English
Halogen substitution strategy for regulating the photoluminescence and dielectric response of ferroelastics
Ordered Matter Science Research Center, Jiangsu Key Laboratory for Science and Applications of Molecular Ferroelectrics, Southeast University, Nanjing 211189, China
b.
Institute for Science and Applications of Molecular Ferroelectrics, Key Laboratory of the Ministry of Education for Advanced Catalysis Materials, Zhejiang Normal University, Jinhua 321019, China
c.
School of Electronics and Information, Zhengzhou University of Light Industry, Zhengzhou 450000, China
230208797@seu.edu.cn (M.-M. Lun). 1 These authors contributed equally to this work.
Received Date:
13 November 2024 Accepted Date:
11 December 2024 Revised Date:
06 December 2024 Available Online:
15 April 2026
Abstract:
Ferroelastics have attracted considerable interest because of their promising uses in areas such as energy conversion, sensing technologies, and beyond. However, exploring ferroelastics with high-temperature dielectric switching and photoluminescence remains a challenge. Here, we have synthesized two ferroelastics (DMTP)PbBr3 (DMTP = N,N-dimethyl-1,2,3,6-tetrahydropyridine) and (DMTP)PbI3 under the guidance of halogen substitution strategy. (DMTP)PbI3 experiences the dielectric switching at 371 K, and upon halogen substitution, the strengthened intermolecular interactions lead to (DMTP)PbBr3 undergoing a similar switching at around 390 K. Additionally, two compounds both emit orange light under ultraviolet illumination. (DMTP)PbI3 has the photoluminescence quantum yield of 2.68%, while (DMTP)PbBr3, due to the increased distortion of the inorganic part after halogen substitution, achieves the higher quantum yield of 12%. This work offers meaningful perspectives on exploring the search for ferroelectrics with photoluminescence and high-temperature dielectric switching, and also demonstrates the rationality of the halogen substitution strategy.
Ferroelastics, as a crucial member among ferroic materials, possess the property that the spontaneous strain can be altered by the application of external pressure which makes them highly valuable in fields of sensors, actuators and so on [1-9]. Since their discovery, ferroelastics have been rapidly developed [10-17]. Currently, there are still some challenges in the development of ferroelastics, such as how to increase the dielectric switching temperature or develop ferroelastics with photoluminescent property by rational strategies.
When discussing molecular materials [18-26], it is essential to recognize the rapid advancements in molecular ferroelectrics that have taken place in recent years. As mentioned in ferroelectrochemistry, molecular ferroelectrics have emerged due to their structural flexibility [27]. This point is also applicable to the development of molecular ferroelastics. The structural tunability of molecular materials offers tremendous potential for optimizing the properties of materials. For example, by using mono-/double-protonation strategy, Luo et al. successfully obtained the mono-protonated [Me2N(CH2)2NH3]ReO4 and double-protonated [Me2NH(CH2)2NH3](ReO4)2, the result showed that the double-protonated [Me2NH(CH2)2NH3](ReO4)2 underwent the paraelastic-ferroelastic phase transition at 322 K while the mono-protonated [Me2N(CH2)2NH3]ReO4 did not have the ferroelasticity [28]. Deng et al. designed high-Tc ferroelastic materials (R/S-CTA)2SbCl5 (CTA = 3‑chloro-2-hydroxypropyltrimethyllammonium) under the guidance of the H/OH- substitution-induced homochiral strategy [29]. Lin et al. successfully synthesized and characterized three multiaxial plastic ferroelectrics with the strategy of halogen engineering in organic part [30]. Sun et al. successfully designed two lead-based hybrid materials ([BMPD]PbBr3 and [CMPD]PbBr3, BMPD = N-BrCH2—N-methylpiperidine, CMPD = NnullClCH2—N-methylpiperidine) under the strategy of halogen engineering in inorganic part, when Cl in [CMPD]PbBr3 is changed to Br in [BMPD]PbBr3, the phase transition temperature for [BMPD]PbBr3 is improved by 45 K [31].
Here, we synthesized two multi-functional molecular ferroelastics (DMTP)PbBr3 and (DMTP)PbI3 under the guidance of the halogen strategy. Experimental results showed that two compounds both crystallized in the non-centrosymmetric space group Pna21 at room temperature and P63mc after the phase transition which means that they both underwent the ferroelastic–paraelastic phase transition with the Aizu notation of 6mmFmm2. (DMTP)PbI3 underwent the phase transition at 371 K and (DMTP)PbBr3 underwent the phase transition at a higher temperature of 390 K. Structural analysis indicated that after halogen substitution, the distance between inorganic chains decreased for (DMTP)PbBr3, causing the organic cations are more likely to be influenced by the forces from the inorganic framework. The intermolecular interaction forces of (DMTP)PbBr3 are stronger than those of (DMTP)PbI3, which leads to the phase transition temperature of (DMTP)PbBr3 is increased. In addition, they could emit orange light under the ultraviolet radiation at room temperature with the quantum yield of 2.68% for (DMTP)PbI3 and 12% for (DMTP)PbBr3, which is due to the inorganic framework of (DMTP)PbBr3 exhibiting a higher degree of distortion. The luminous intensity of two compounds weakened gradually with increasing temperature and disappeared rapidly after undergoing the phase transition.
Synthesis: All medicines are commercially available and were used directly without further processing. The synthesis of the organic ligand for two compounds is as follows: Firstly, 0.1 mol of 1,2,3,6-tetrahydropyridine hydrochloride and 0.25 mol of iodomethane were added into the solvent mixture of acetonitrile and methanol and then 10 g of potassium carbonate was added to absorb the HCl in the 1,2,3,6-tetrahydropyridine hydrochloride and the HI produced in the reaction. Secondly, the mixed solution was moved to the oil bath to react for 24 h at 323 K then KI, KCl and excess potassium carbonate were removed by filtration. Thirdly, the solution obtained in the previous step was transferred to rotary evaporation at 325 K and the ligand which we need was made. For (DMTP)PbBr3, at first, 3 mmol of the ligand and 1.5 mmol of silver carbonate were added in 15 mL of deionised water and then the mixed solution reacted for 2 h in the fume hood and was protected from light. Secondly, the mixed solution was filtered to remove AgI. Thirdly, 3 mmol of lead bromide was weighed and added into the mixed solution and hydrobromic acid was added continuously and at the same time, the solution was heated and stirred until lead bromide is dissolved. At last, the transparent solution was placed to the hot plate and after few days, the transparent block crystals of (DMTP)PbBr3 were precipitated. For (DMTP)PbI3, firstly, 2.5 mmol of the ligand was added into hydriodic acid then 2.5 mmol lead iodide was weighed and added into the solution. Secondly, the mixed solution was heated with stirring until the solution became clear and transparent. At last, the transparent solution was transferred to the hot plate at 333 K and after almost one-week, yellow needle crystals of (DMTP)PbI3 were successfully obtained.
Characterization: Single crystal X-ray diffraction (SXRD) was used to study the crystal structure, differential scanning calorimetry (DSC) was used for thermal analysis, and powder X-ray diffraction (PXRD) was used to verify the purity of the crystal. The more details of these measurement methods are in Supporting information.
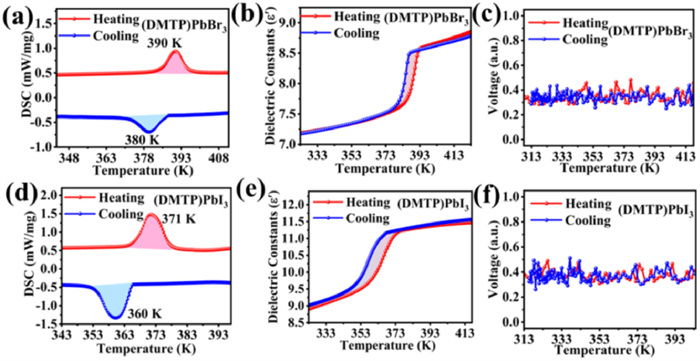
Thermal analysis and dielectric properties: When the structure of the crystal changes, heat-absorbing or heat-emitting phenomena usually can be observed [32-38]. DSC is often used to observe the rate of heat absorption or emission of the sample as it is heated up or cooled down. When there is an anomalous heat change, the corresponding peak can be seen from the DSC result. Figs. 1a and d show the DSC results for (DMTP)PbBr3 and (DMTP)PbI3, respectively. From the Fig. 1a, we can see that (DMTP)PbBr3 has a heat absorption peak at 390 K in the heating process and correspondingly, it has an exothermic peak at 380 K in the cooling process. Similarly, for (DMTP)PbI3, a pair of peaks is observed at 371 K (heating process) and 360 K (cooling process), respectively. For (DMTP)PbBr3, we can get the corresponding entropy changes (ΔS) to be 13.1 and 13.4 J mol-1 K-1 combining the formula ΔS = ΔH/T, respectively. Similarly, for (DMTP)PbI3, the corresponding ΔS to be 39.1 and 41.6 J mol-1 K-1, respectively. For ease of description, we denote the phase of the crystal before the phase transition as RTP and the phase after the phase transition as HTP. The dielectric constant of the compound near the temperature point of the phase transition usually undergoes an abrupt change [39-44]. Fig. 1b illustrates the variation of the dielectric constant of (DMTP)PbBr3 with the temperature. In the RTP, the dielectric constant is around 7.0, as the temperature increases near the phase transition point, the dielectric constant undergoes a significant change, with the dielectric constant increasing to 8.5 in the HTP. Similarly, we can observe that for (DMTP)PbI3 from the Fig. 1e, the dielectric constant is around 9.0 before the phase transition, and when the temperature is increased to around 371 K, the dielectric constant rapidly increases to around 11.0 and remains almost unchanged. The property that the dielectric constants of two compounds undergo an abrupt change at the point of phase transition and remain almost constant before and after the phase transition indicates the suitability of the two compounds for dielectric switching materials. The variations of the dielectric constants of two compounds with temperature at other frequencies are shown in Fig. S2 (Supporting information).
Figure 1
Figure 1.
DSC curves of (a) (DMTP)PbBr3 and (d) (DMTP)PbI3 in the heating and cooling process. The temperature-responsive dielectric cycles of (b) (DMTP)PbBr3 and (e) (DMTP)PbI3 at 1 MHz in the heating and cooling process. The second harmonic generation (SHG) intensity plots of (c) (DMTP)PbBr3 and (f) (DMTP)PbI3 during the heating and cooling cycle.
Second harmonic generation analysis: The SHG intensities of (DMTP)PbBr3 and (DMTP)PbI3 are about 0.32 and 0.35 times that of potassium dihydrogen phosphate (KDP) at room temperature (Fig. S3 in Supporting information). The variation curves of SHG signals of two compounds with increasing temperature are shown in Figs. 1c and f. The result indicates that two compounds both crystallize in the non-centrosymmetric space group which can be seen in the structure analysis.
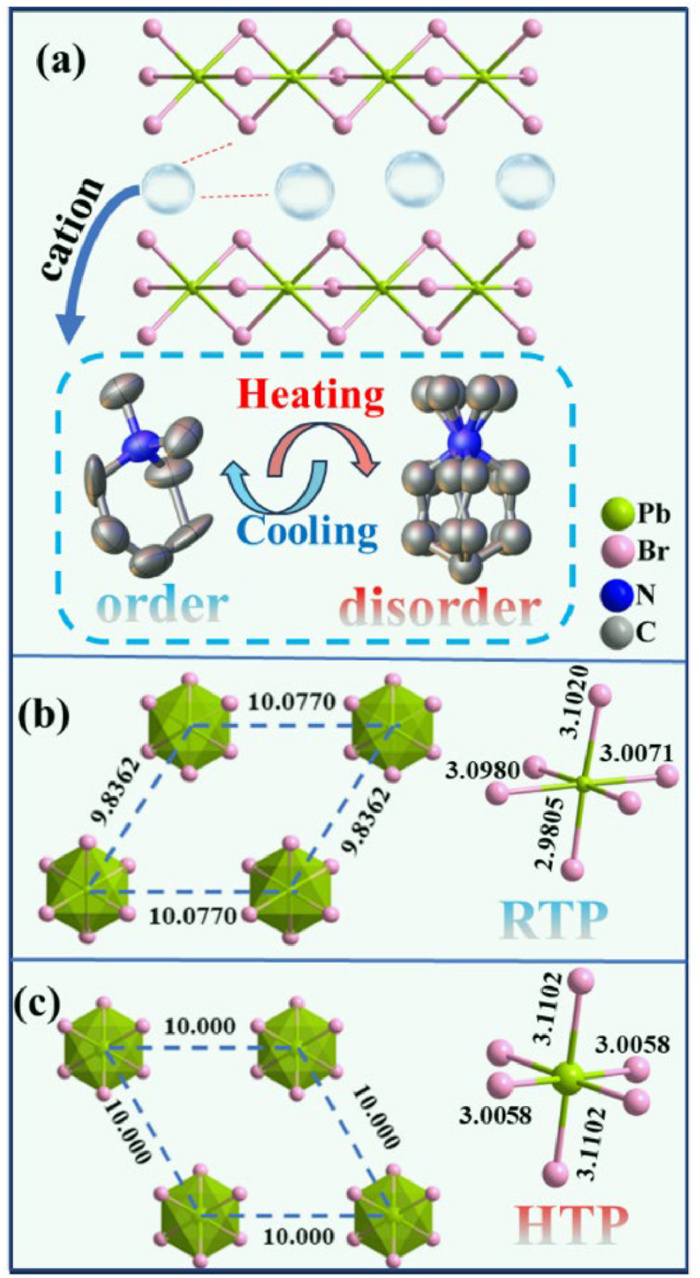
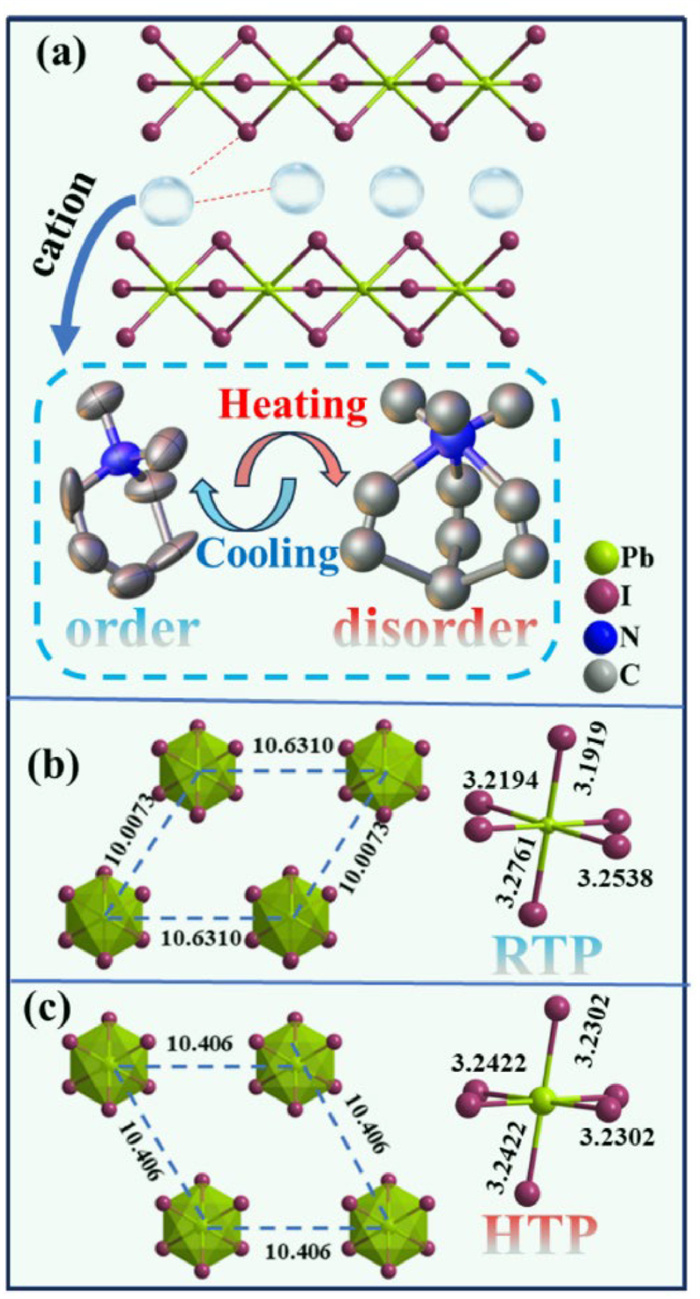
Structure analysis: In order to study the phase transition mechanism of the crystals, we performed SXRD experiments. In the LTP, (DMTP)PbBr3 crystallizes in the Pna21 space group which belongs to the orthorhombic system with crystal cell parameters of a = 7.9038(16) Å, b = 16.108(4) Å, c = 10.077(2) Å, and V = 1283.0(5) Å3 (Table S1 in Supporting information). The inorganic framework of (DMTP)PbBr3 exhibits a distinct one-dimensional chain structure which is same as the reported one-dimensional lead halide structures (Fig. 2a). Organic cations are located in the space between the inorganic chains. The organic cations are ordered at RTP and the carbon atoms on the six-membered ring are almost in one plane due to the limitation of the double bond, which is different from the general configuration of the six-membered ring. Inorganic chains are parallel to each other and the distance between them is 10.0770 or 9.8362 Å. Each lead atom is coordinated to six bromine atoms and the bond lengths of Pb-Br are between 2.92 Å and 3.1 Å (Fig. 2b). From the DSC result, it is clear that (DMTP)PbBr3 undergoes a structural phase transition at around 390 K, in order to study the structure of (DMTP)PbBr3 after phase transition, variable temperature SXRD was conducted at 403 K. In the HTP, (DMTP)PbBr3 crystallizes in the P63mc space group which belongs to the hexagonal system with crystal cell parameters of a = 10.000(3) Å, b = 10.000(3) Å, c = 7.912(4) Å, and V = 685.2(6) Å3 (Table S1). The organic cation is in the state of severe disorder and sits on the special position with the 6 mm symmetry (Fig. 2a). The bond lengths of Pb-Br change slightly and the distance between adjacent inorganic chains is changed to 10.000 Å (Fig. 2c). The results show that the organic cation undergoes severe thermal vibration while the inorganic framework undergoes relatively weak change which leads to the phase transition of (DMTP)PbBr3. In the LTP, (DMTP)PbI3 crystallizes in the Pna21 space group which belongs to the orthorhombic system with crystal cell parameters of a = 8.2388(10) Å, b = 16.691(2) Å, c = 10.6310(15) Å, and V = 1461.9(3) Å3 (Table S1). Cations are in an ordered state in the LTP (Fig. 3a). Inorganic chains are parallel to each other and the distance between them is 10.6310 or 10.0073 Å. Each lead atom is coordinated to six iodine atoms and the bond lengths of Pb-Ⅰ are between 3.1919 Å and 3.2761 Å (Fig. 3b). We can see that after halogen substitution, the distance between the inorganic chains of (DMTP)PbI3 is greater than that of (DMTP)PbBr3, which means that the cations of (DMTP)PbI3 would be less constrained by the inorganic framework. In the HTP, (DMTP)PbI3 crystallizes in the P63mc space group which belongs to the hexagonal system with crystal cell parameters of a = 10.406(3) Å, b = 10.406(3) Å, c = 8.171(3) Å, and V = 766.3(5) Å3 (Table S1). The change of organic cation and inorganic framework of (DMTP)PbI3 are similar to those of (DMTP)PbBr3 after undergoing the phase transition (Fig. 3c). Overall, the phase transitions of these two compounds arise from the order-disorder motion of organic cations and deformation of the inorganic frameworks.
Figure 2
Figure 2.
(a) The packing structures of (DMTP)PbBr3 and evolution of organic cation for (DMTP)PbBr3. Evolution of inorganic part for (DMTP)PbBr3 in the (b) RTP and (c) HTP.
Figure 3.
(a) The packing structures of (DMTP)PbI3 and evolution of organic cation for (DMTP)PbI3. Evolution of inorganic part for (DMTP)PbI3 in the (b) RTP and (c) HTP.
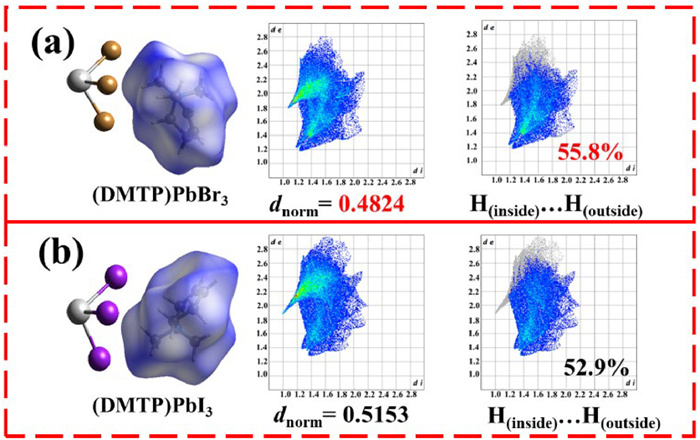
Intermolecular Interaction Analysis: Intermolecular interaction forces are crucial to influencing the phase transition temperature of compounds [45-51]. Therefore, the Hirshfeld dnorm surfaces of two compounds were calculated and estimated with the help of CrystalExplorer software based on their structural files. As depicted in Fig. 4, the dnorm value for (DMTP)PbBr3 is 0.4824, and for (DMTP)PbI3 is 0.5153, smaller dnorm value represents larger intermolecular force so the cation for (DMTP)PbBr3 experiences stronger restraining forces from the surrounding cations and anions, which causes that the phase transition temperature of (DMTP)PbBr3 (390 K) is higher than that of (DMTP)PBI3 (371 K). In addition, the C—H(inside)⋯H—C(outside) for (DMTP)PbBr3 is 55.8% and for (DMTP)PbI3 is 52.9%, which suggests that the hydrogen bonds between cations of (DMTP)PbBr3 are stronger than that of (DMTP)PbI3. From the structural analysis we can see that the distance between adjacent inorganic chains of (DMTP)PbBr3 is 10.0770 Å or 9.8362 Å while that of (DMTP)PbI3 is 10.6310 Å or 10.0073 Å, which indicates that the inorganic frameworks of (DMTP)PbBr3 have smaller space so the organic cations are more likely to be influenced by the forces from the framework.
Figure 4
Figure 4.
Hirshfeld surface and two-dimensional (2D) fingerprint plots of (a) (DMTP)PbBr3 and (b) (DMTP)PbI3.
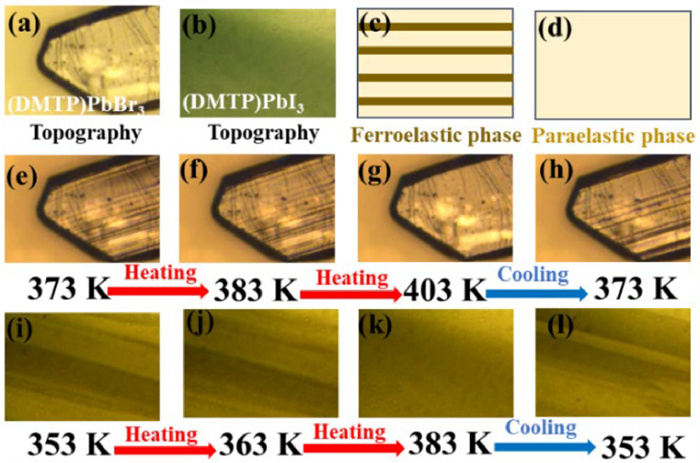
Ferroelasticity: For (DMTP)PbBr3 and (DMTP)PbI3, the space group transition from Pna21 to P63mc is occurred with an Aizu notation of 6mmFmm2 which meets one of the 94 species of ferroelastic phase transitions defined by Aizu. Figs. 5a and b show the topography of two compounds. The significant feature of the ferroelastic phase transition is that the change of ferroelastic domains can be directly observed under the polarized light. Figs. 5e-h show the change of ferroelastic domains of (DMTP)PbBr3 under the polarized light. We can see that in ferroelastic phase there are parallel stripes on the surface of the crystal and these stripes are ferroelastic domains. With further increase in temperature, these stripes disappear when the temperature exceeded the phase transition temperature and reappear as the temperature is lowered below the phase transition temperature. Figs. 5i-l show the variation of ferroelastic domains of (DMTP)PbI3 under the polarized light. In order to better observe the changes of ferroelastic domains for two compounds under the polarized light, we also provide relevant videos (Movies S1 and S2 in Supporting information).
Figure 5
Figure 5.
Topography of (a) (DMTP)PbBr3 and (b) (DMTP)PbI3. Schematic diagram of the (c) ferroelastic phase to (d) paraelastic phase. (e–h) Evolution of ferroelastic domains of (DMTP)PbBr3 under the polarized light. (i-l) Evolution of ferroelastic domains of (DMTP)PbI3 under the polarized light.
To further investigate the ferroelastic properties of the two compounds, we calculated their spontaneous strain tensor using Eq. 1 [52].
εij=[l11l12l13l21l22l23l31l32l33]
(1)
Finally, the spontaneous strains for (DMTP)PbBr3 and (DMTP)PbI3 were calculated to be approximately 0.7 and 0.6 at room temperature (calculation details are given in Supporting information) based on Eq. 2.
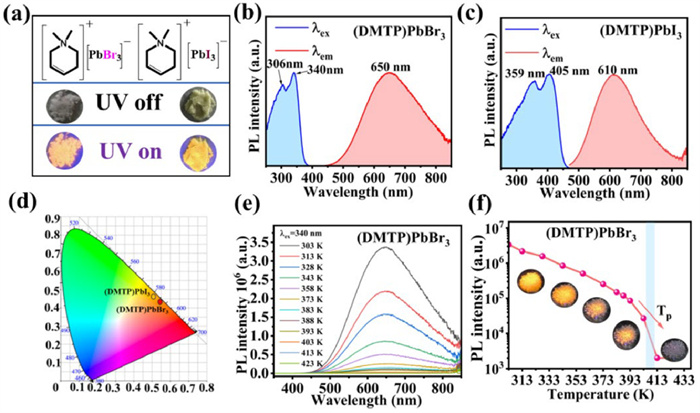
Photoluminescence properties: From the Fig. 6a, crystals of two compounds can both emit the orange light under the exposure of the ultraviolet radiation. In order to further describe their colours, chromaticity coordinates have been calculated and their chromaticity coordinates are (0.5386, 0.4397) and (0.5164, 0.4598) (Fig. 6d), respectively according to the standard of Commission Internationale de I’Eclairage (CIE). For better understanding the photoluminescence properties of two compounds, we measured their excitation as well as emission spectra at first. From Fig. 6b, we can see that (DMTP)PbBr3 has two excitation peaks at 306 nm and 340 nm. Its emission peak was measured under the excitation of 340 nm wavelength and the result showed that the emission peak of (DMTP)PbBr3 is located at 650 nm. Similarly, two excitation peaks of (DMTP)PbI3 are located at 359 nm and 405 nm and the emission peak is located at 610 nm (Fig. 6c). The emission wavelength of the bromine substitution is somewhat red-shifted compared to that of the iodine substitution. Next, we measured photoluminescence lifetimes of two compounds. As shown in Fig. S4 (Supporting information), the lifetimes were 53.84 ns for (DMTP)PbBr3 and 7.67 ns for (DMTP)PbI3. They are similar to the lifetimes which have been reported so far in lead-based organic-inorganic hybrid materials. Further, the quantum yields of two compounds were measured and the yields were 12% for (DMTP)PbBr3 (Fig. S6 in Supporting information) and 2.68% for (DMTP)PbI3 (Fig. S5 in Supporting information). The quantum yields of two compounds varied dramatically due to the difference in halogen. This once again demonstrates that the halogen substitution strategy can effectively influence the photoluminescence properties of organic-inorganic hybrid materials. To further investigate why the quantum yields of two compounds were so different. We calculated the respective values of the ortho-octahedral distortion. The bond length distortion (Δd) and bond angle variance (β2) of two compounds were calculated based on Eqs. 3 and 4.
Figure 6.
(a) Photographs of (DMTP)PbBr3 and (DMTP)PbI3 under ambient light and UV light. Excitation and emission spectra for (b) (DMTP)PbBr3 and (c) (DMTP)PbI3. (d) CIE chromaticity coordinate of (DMTP)PbBr3 and (DMTP)PbI3. (e) Temperature-dependent PL spectra of (DMTP)PbBr3. (f) PL trend from 303 K to 423 K of (DMTP)PbBr3.
In Eq. 3, di is the independent bond length of Pb–X (X=Cl/Br) and d0 is the average Pb–X bond length and βi represents the bond angle of X–Pb–X. The quantitative values for Δd and β2 were calculated to be 2.7 × 10⁻⁴ and 63.6305 in (DMTP)PbBr3, 1.2 × 10⁻⁴ and 40.7984 in (DMTP)PbI3. The result shows that the degree of distortion of bromine substitution is greater than that of iodine substitution, which explains why the quantum yield of bromine substitution is higher than that of iodine substitution. We noted that the luminous intensity of both crystals diminished with increasing temperature and disappeared near the phase transition temperature point. So we measured the temperature-dependent emission spectra of two compounds (Fig. 6e and Fig. S4a), and for ease of observation, we made plots of variation of the intensity of the emission light with temperature for fixed emission wavelengths (650 nm for (DMTP)PbBr3 and 610 nm for (DMTP)PbI3). From Fig. 6f, we can see that the intensity of the emission light gradually became smaller as the temperature increased, while near the phase transition temperature point, the intensity of the emitted light dropped rapidly.
In summary, we have successfully designed and synthesized two multi-functional ferroelastics (DMTP)PbBr3 and (DMTP)PbI3 under the guidance of halogen substitution strategy. Two compounds both crystallized in the non-centrosymmetric space group Pna21 at room temperature and P63mc after the phase transition. They both underwent the ferroelastic–paraelastic phase transition with the Aizu notation of 6mmFmm2. The phase transitions of these two crystals arise from the order-disorder motion of organic cations and deformation of the inorganic frameworks. After halogen substitution, (DMTP)PbBr3 exhibits a higher dielectric switching temperature compared to (DMTP)PbI3 due to the enhanced intermolecular interactions in (DMTP)PbBr3. Moreover, the greater distortion in the inorganic framework of (DMTP)PbBr3 results in a higher photoluminescence quantum yield compared to (DMTP)PbI3. This work not only validates the rationality of the halogen substitution strategy but also offers valuable insights for the exploration of multifunctional ferroelastic materials.
Declaration of competing interest
The authors declare that they have no known competing financial interests or personal relationships that could have appeared to influence the work reported in this paper.
CRediT authorship contribution statement
Zhi-Long Li: Writing – original draft. Hao-Fei Ni: Data curation. Bo Zhuang: Data curation. Kun Ding: Data curation. Da-Wei Fu: Supervision. Qiang Guo: Data curation. Meng-Meng Lun: Data curation.
Acknowledgments
This work was financially supported by the National Natural Science Foundation of China (No. 22371258) and the research fund of Southeast University.
Supplementary materials
The supplementary crystallographic data for this paper have been uploaded in the Cambridge Structural Database. The number of CCDC are 2400546-2400549. Supplementary material associated with this article can be found, in the online version, at doi:10.1016/j.cclet.2024.110755.
[1]
F.F. Di, H. Peng, H. Zhang, et al., Mater. Chem. Front. 5 (2021) 2842–2848. doi: 10.1039/d1qm00007a
Z.X. Zhang, H. Wang, H.F. Ni, et al., Angew. Chem. Int. Ed. 63 (2024) e202319650. doi: 10.1002/anie.202319650
[51]
Z.X. Zhang, H.F. Ni, J.S. Tang, et al., J. Am. Chem. Soc. 146 (2024) 27443–27450. doi: 10.1021/jacs.4c07268
[52]
J. Li, T. Zhang, M.M. Lun, et al., Chem. Commun. 59 (2023) 4644. doi: 10.1039/d3cc00776f
Figure 1
DSC curves of (a) (DMTP)PbBr3 and (d) (DMTP)PbI3 in the heating and cooling process. The temperature-responsive dielectric cycles of (b) (DMTP)PbBr3 and (e) (DMTP)PbI3 at 1 MHz in the heating and cooling process. The second harmonic generation (SHG) intensity plots of (c) (DMTP)PbBr3 and (f) (DMTP)PbI3 during the heating and cooling cycle.
Figure 2
(a) The packing structures of (DMTP)PbBr3 and evolution of organic cation for (DMTP)PbBr3. Evolution of inorganic part for (DMTP)PbBr3 in the (b) RTP and (c) HTP.
Figure 3
(a) The packing structures of (DMTP)PbI3 and evolution of organic cation for (DMTP)PbI3. Evolution of inorganic part for (DMTP)PbI3 in the (b) RTP and (c) HTP.
Figure 5
Topography of (a) (DMTP)PbBr3 and (b) (DMTP)PbI3. Schematic diagram of the (c) ferroelastic phase to (d) paraelastic phase. (e–h) Evolution of ferroelastic domains of (DMTP)PbBr3 under the polarized light. (i-l) Evolution of ferroelastic domains of (DMTP)PbI3 under the polarized light.
Figure 6
(a) Photographs of (DMTP)PbBr3 and (DMTP)PbI3 under ambient light and UV light. Excitation and emission spectra for (b) (DMTP)PbBr3 and (c) (DMTP)PbI3. (d) CIE chromaticity coordinate of (DMTP)PbBr3 and (DMTP)PbI3. (e) Temperature-dependent PL spectra of (DMTP)PbBr3. (f) PL trend from 303 K to 423 K of (DMTP)PbBr3.

 DownLoad:

 下载:
下载:


 下载:
下载:
