Figure 1.
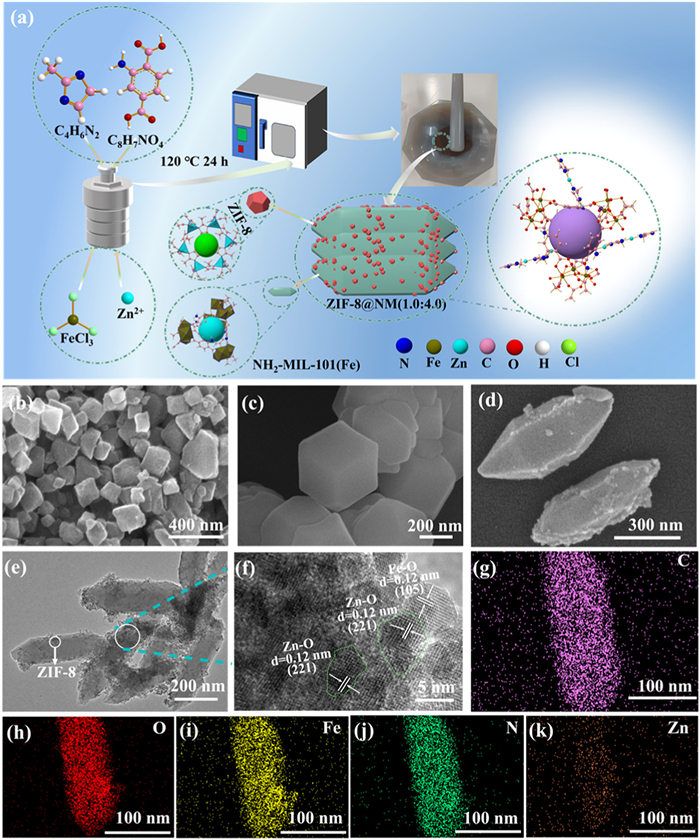
(a) Preparation flowchart of the catalysts. (b-d) SEM images of NH2−MIL-101 (Fe), ZIF-8 and ZIF-8@NM(1.0:4.0). (e, f) HRTEM image of ZIF-8@NM(1.0:4.0). (g-k) EDS elemental scans of ZIF-8@NM(1.0:4.0).
Efficient degradation of tetracycline hydrochloride via high-redox S-scheme MOF-on-MOF heterojunction catalyst
Yu Wang , Changjiang Lu , Danhua Jiao , Fei Wang , Xiaojian Gong , Tianhua Yu , Anping Wang , Chong-Chen Wang

Antibiotics have been extensively used as fundamental therapeutic agents in modern medicine since their discovery. However, the indiscriminate overuse of these pharmacological compounds in clinical and agricultural practices has resulted in the widespread accumulation of antibiotic residues in ecological systems, which has emerged as a pressing global health concern that demands urgent interdisciplinary intervention [1,2]. Tetracycline hydrochloride (TCH) residues are resistant to degradation due to their stable chemical structures [3], posing a potential threat to both ecosystems and human health [4–6]. Consequently, developing efficient degradation methods for TCH residues has become a priority in environmental remediation research. Various biological, physical, and chemical methods have been employed to treat wastewater contaminated with antibiotic residues. In contrast, advanced oxidation processes (AOPs) can completely mineralize pollutants into CO2 and H2O or degrade them into small molecules, which are considered one of the effective methods for treating recalcitrant pollutants.
The Fenton reaction is an effective AOP, in which a series of reactive oxygen species (ROSs) (e.g., •O2−, •OH, and •OOH) are generated through the redox reaction of Fe2+ and H2O2 for the non-selective degradation of organic pollutants [7]. However, traditional homogeneous Fenton systems face several drawbacks in practical use, such as a limited pH range, substantial iron ion leaching, and the creation of secondary pollutants [8]. In contrast, environmentally friendly photocatalytic reactions typically occur under mild conditions and do not produce secondary pollutants. Photo-Fenton technology integrates Fenton and photocatalysis, using light energy to boost ROS generation via the redox reaction of Fe2+ and H2O2, thus enhancing organic pollutant degradation. However, the development of catalysts with strong visible light response and efficient charge separation is a key factor restricting the development of photo-Fenton technology. Constructing heterojunctions to enhance the utilization efficiency of photogenerated electrons is an effective approach to enhance overall catalytic efficiency of photo-Fenton system [9,10].
Metal-organic frameworks (MOFs) are characterized by large specific surface area, highly porous framework, and customizable structure [11], making them promising candidates for applications in drug delivery [12], electrochemistry [13], water treatment [14], catalysis [15], and other fields. Among them, NH2−MIL-101(Fe) is a representative heterogeneous photo-Fenton catalyst, featuring abundant Fe–O and –NH2 functional groups [16]. For instance, Guo et al. [17] constructed NH2−MIL-88B(Fe)/TiO47/PAN electrostatically spun nanofibrous membranes for the degradation of chlortetracycline (CTC) with a degradation efficiency of 94.9%. However, a significant challenge of single MOF materials is the rapid recombination of photogenerated charge carriers. To enhance photo-Fenton catalysis efficiency and broaden the light absorption range of the catalyst, a high-redox potential is required. The construction of heterojunctions by combining different materials can effectively prolong charge carrier lifetimes. Recently, the fabrication of MOF-on-MOF heterojunctions by conjugating two different MOFs has attracted increasing attention. A heterojunction of MOF-on-MOF type with an S-scheme, characterized by the presence of an internal electric field and interfacial chemical bonding, was fabricated by integrating NH2−MIL-125(Ti) and ZIF-67(Co) with CoFe Prussian blue analogs via an ion exchange process. This heterojunction exhibited high efficiency in the photocatalytic degradation of antibiotic compounds [18]. By growing another MOF with a stable structure and better photocatalytic performance on the MOF surface, ZIF-67(Co) and ZIF-8(Zn) were selectively grown on a cake-shaped MIL-125(Ti) substrate to form a ternary MOF-on-MOF heterojunction [19]. This close interfacial contact can more effectively promote charge separation and carrier transfer, thereby greatly improving the catalytic efficiency [20]. The synthesized composites have suitable redox potentials, wide light absorption ranges, and the effective avoidance of photogenerated carrier recombination. Therefore, the construction of heterojunctions with MOF-on-MOF structures has tremendous potential to improve photocatalytic performance.
In this work, solvothermal epitaxial method was employed to grow ZIF-8(Zn) as the guest on the NH2−MIL-101(Fe) host (Fig. 1a). A MOF-on-MOF S-scheme heterojunction of ZIF-8@NH2−MIL-101(Fe) was designed to provide a suitable bandgap and high redox potential. Experimental results revealed that the synthesized composite demonstrated a strong response to visible light and expected catalytic performance for TCH degradation. Furthermore, a possible photocatalytic mechanism was explored through comprehensive characterizations. The study also conducted a systematic evaluation of the degradation mechanism of TCH and the toxicity of its degradation products.
The supporting materials (Texts S1 and S2 in Supporting information) provide detailed information about the raw materials for catalysts synthesis and the instrumentation employed for characterizations. In this study, different catalysts were synthesized using the solvothermal method (Text S3 in Supporting information). The morphological characteristics of the catalyst were analyzed using scanning electron microscopy (SEM) and high-resolution transmission electron microscopy (HRTEM). NH2−MIL-101(Fe) exhibits an irregular polyhedral structure (Fig. 1b), while pure ZIF-8 has a smooth surface with a regular polyhedral structure (Fig. 1c). Through a MOF-on-MOF growth strategy, ZIF-8@NM (1.0:4.0) was formed by the epitaxial growth of ZIF-8 on the surface of NH2-MIL-101(Fe). SEM images reveal that ZIF-8@NM(1.0:4.0) possesses a corncob-like morphology (Fig. 1d). The HRTEM images further indicate that small particles are attached to and have grown on the surface, forming an overall spindle-shaped architecture reminiscent of a corncob (Figs. 1e and f). As shown in Fig. 1f, ZIF-8@NM(1.0:4.0) is composed of different crystals. ZIF-8@NM(1.0:4.0) shows lattice fringes with a d-spacing of 0.12 nm, corresponding to the (221) and (105) crystal plane of Zn-O and Fe-O, respectively, confirming the successful fabrication of the MOF-on-MOF composite materials. In addition, the energy dispersive X-ray spectroscopy (EDS) elemental distributions show the homogeneous distribution of Fe, Zn, C, N, and O across the particle surfaces (Figs. 1g–k and Fig. S1 in Supporting information).
X-ray diffraction (XRD) was used to characterize the crystal structures of as-synthesized catalyst (Fig. 2a). ZIF-8 exhibits characteristic diffraction peaks at 2θ = 7.4°, 10.4°, 12.8°, 16.6°, 22.2°, and 26.7°, while NH2−MIL-101(Fe) exhibits characteristic diffraction peaks at 2θ = 9.1°, 16.5°, 18.8°, 21.7°, 25.2°, and 28.7°, consistent with previous reports [21,22]. The XRD spectra of ZIF-8@NM composites with different ratios show distinct characteristic diffraction peaks from both single MOFs, confirming the successful formation of the heterostructures. Fourier-transform infrared (FT-IR) spectroscopy further verified the composite structure, with all materials exhibiting characteristic organic ligand vibrations in the range of 1100–1750 cm−1 (Fig. 2b) [23–25]. In addition to the characteristic peaks of organic ligands, a strong Zn–O peak at 530.7 cm−1 is also observed from ZIF-8@NM [26,27]. N2 adsorption–desorption was conducted to evaluate the specific surface areas and porosity of the materials. The adsorption–desorption isothermal curves of ZIF-8@NM(1.0:4.0), ZIF-8, and NH2−MIL-101(Fe) display type H1 hysteresis loops according to the IUPAC classification, confirming the microporous structure (Fig. 2c, Figs. S2a and b in Supporting information) [28,29]. The specific surface areas of NH2−MIL-101(Fe), ZIF-8@NM(1.0:4.0), and ZIF-8 are 70.71, 150.9, and 1224.6 m2/g, respectively. Due to the inherent microporous structure of ZIF-8, the incorporation of ZIF-8 onto NH2−MIL-101(Fe) introduce additional micropores, resulting in a larger specific surface area of the composite material (Table S1 in Supporting information) [30].
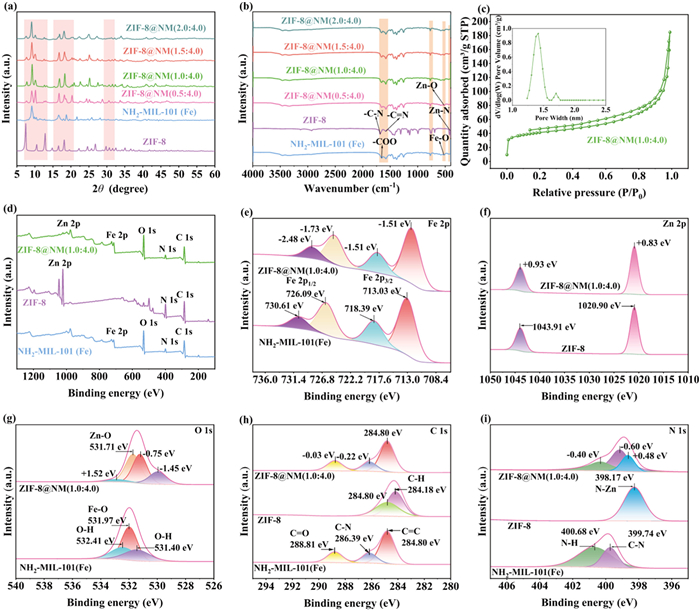
The surface electronic structure and elemental chemical states of the catalyst were systematically investigated by X-ray photoelectron spectroscopy (XPS). The full-scan energy spectrum of the catalyst reveals the presence of C, N, O, Zn, and Fe, which agrees well with EDS mapping results (Fig. 2d). As exhibited in Fig. 2e, the binding signals at 713.03 and 726.09 eV and the satellite peaks at 718.39 and 730.61 eV in NH2−MIL-101(Fe) are assigned to Fe3+ species [31,32]. The Fe 2p peaks in ZIF-8@NM(1.0:4.0) exhibit an overall blue shift, indicating modified local electronic environments of the surface Fe atoms [33]. The binding energies at 1020.90 and 1043.91 eV are attributed to Zn 2p3/2 and Zn 2p1/2 of ZIF-8 (Fig. 2f) [34]. Compared with ZIF-8, the binding energy of the Zn 2p3/2 and Zn 2p1/2 orbitals in ZIF-8@NM(1.0:4.0) show a noticeable red shift. The composite exhibit a Zn–O binding energy at 531.71 eV [35], while the Fe–O binding energy blue-shifted to 531.22 eV (Fig. 2g). Slight shifts are also observed for C–N (blue shift to 286.17 eV) and N–Zn (red shift to 398.65 eV) species (Figs. 2h and i). These results suggest an increased electron density around Fe and a decreased electron density around Zn at the heterojunction interface, affirming the existence of an internal electric field.
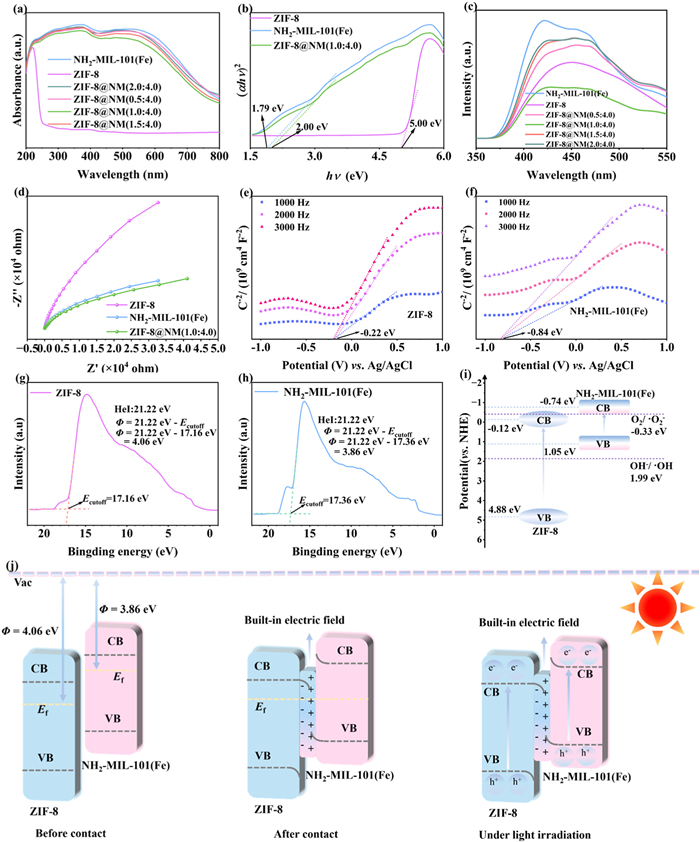
The photon capture efficiency of the as-prepared catalysts was examined by UV-vis diffuse reflectance spectroscopy (UV-vis DRS) in the 200–800 nm wavelength range. As illustrated in Fig. 3a, ZIF-8 exhibits light absorption below 400 nm, whereas NH2−MIL-101(Fe) and ZIF-8@NM with varying ratios display significant absorption across both the UV and visible regions. All composites exhibit a certain degree of red-shifting compared to the single Fe-MOF material [36]. The band gaps of ZIF-8, NH2−MIL-101(Fe), and ZIF-8@NM(1.0:4.0) were calculated using Tauc's Eq. 1 to be 5.00, 1.79, and 2.00 eV, respectively (Fig. 3b) [37]. The band gaps of other composites are shown in Figs. S3a–c (Supporting information). ZIF-8@NM(1.0:4.0) exhibits a broader band gap compared to NH2−MIL-101(Fe), primarily attributed to mid-gap states generated by surface-induced structural reconstruction of the ZIF-8 component. Photoluminescence (PL) spectra (Fig. 3c) reveal the lowest emission intensity for ZIF-8@NM(1.0:4.0), suggesting the longest lifetime of photogenerated electron–hole pairs and their suppressed recombination [38]. The charge separation and transfer abilities were measured using the electrochemical impedance spectroscopy (EIS) and transient photocurrent measurements. ZIF-8@NM(1.0:4.0) composite exhibit significantly stronger photocurrent response than the single components (Fig. S3d in Supporting information), which can be attributed to the improved separation capacity of photogenerated charge carriers [39]. Moreover, the smallest arc radius of ZIF-8@NM(1.0:4.0) indicat the superior electron transmittance (Fig. 3d) [40]. As shown in Mott–Schottky plots in Figs. 3e and f, both materials display n-type semiconductor behavior with positive slopes [41]. Meanwhile, according to (2), (3), the corresponding flat band potentials (EFB) and conduction band energies (ECB) were calculated and converted [42,43]. The ECB of ZIF-8 and NH2−MIL-101(Fe) were −0.12 and −0.74 eV, respectively. According to the theory of energy band structure, when different catalysts come into contact, the difference in the work functions (Φ) leads to electron transfer [44]. Ultraviolet photoelectron spectroscopy (UPS) was used to measure the Φ values of the two individual MOFs, and the cutoff energies (Ecutoff) were calculated to be 17.16 and 17.36 eV for ZIF-8 and NH2−MIL-101(Fe), respectively (Figs. 3g and h). Using the formula
|
|
(1) |
|
|
(2) |
|
|
(3) |
where α is the absorption coefficient, h is Planck's constant, v is the optical frequency, and
Details of the photocatalytic experiments are provided in Text S4 (Supporting information). The spontaneous degradation of TCH was negligible in the absence of both the photo-Fenton catalyst and H2O2 (Blank and Blank-1). The degradation kinetics follow pseudo-first-order kinetics
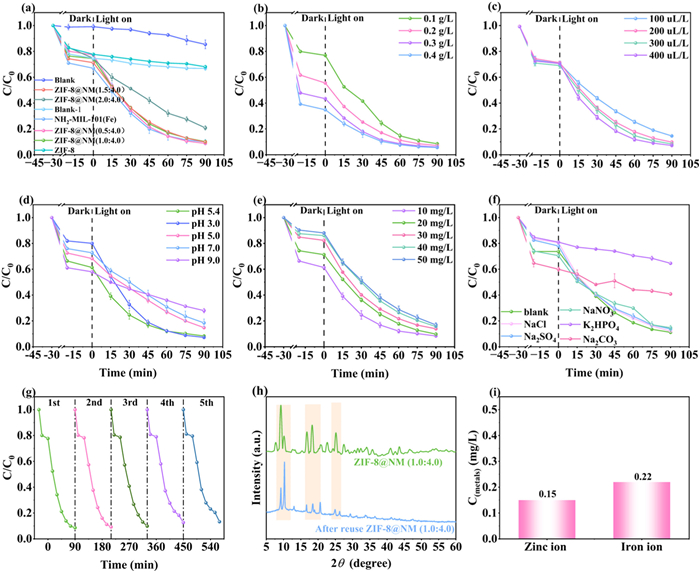
Actual wastewater discharges contain varying concentrations of TCH, so the initial concentration from TCH can also significantly affect the degradation process. At 10 mg/L TCH, the catalyst can achieve a degradation efficiency of 91.6%, whereas a fivefold concentration increase (50 mg/L) resulted in a reduced efficiency of 83.1% (Fig. 4e). Therefore, highly efficient treatment of high-concentration TCH holds practical application value. The existence of inorganic anions in water may potentially affect the catalytic efficiency. Thus, the effects of various anions (5 mmol/L Cl−, SO42−, NO3−, H2PO4−, and CO32−) on TCH degradation were investigated [28]. As displayed in Fig. 4f, Cl−, SO42−, and NO3− show weak inhibitory effects, while H2PO4− and CO32− cause more significant suppression of TCH degradation. Notably, H2PO4− can react with •OH to produce HPO4− with lower oxidizing capacity, as shown in Eq. 5 [48]. Furthermore, CO32− can also interact with reactive radicals to form •CO3−, a substance with a lower redox potential, thereby altering the pH of the reaction system, as illustrated in Eqs. 6 and 7 [49,50].
|
|
(4) |
|
|
(5) |
|
|
(6) |
|
|
(7) |
To comprehensively evaluate the repeatability and sustainability of the ZIF-8@NM(1.0:4.0) catalyst, five repeated cycle experiments were conducted. As shown in Fig. 4g, ZIF-8@NM(1.0:4.0) maintains a TCH degradation rate of 86.7% after five cycles, indicating the favorable reusability. Structural evolution of the ZIF-8@NM(1.0:4.0) catalyst after cycling was evidenced by the disappearance of the characteristic (110) diffraction peak at 2θ = 7.4° in XRD patterns (Fig. 4h), suggesting pore geometry modification under repeated catalytic conditions. However, the other major characteristic diffraction peaks show no significant changes before and after cycling, further indicating the acceptable structural stability of the catalytic system. ICP-MS measurements were carried out to investigate the Leaching risks of photo-Fenton system. As depicted in Fig. 4i, zinc (1.0 mg/L) and iron (0.3 mg/L) concentrations after reaction are consistently below thresholds mandated in national water quality standard (GB 3838–2002).
Liquid chromatography–mass spectrometry was used to analyze the potential intermediates formed during the degradation reactions. The mass-to-charge ratios of some intermediates are presented in the supplementary materials (Fig. S6a in Supporting information). The three potential pathways for TCH degradation by ZIF-8@NM(1.0:4.0) are shown in Fig. S6b (Supporting information). TCH contains several sites vulnerable to radical attack, including the double bond, phenol group, and amine group. The major reactions occurring in Pathway I are as follows. First, TCH undergoes carboxylation, deamination, and decarboxylation to generate P1 (m/z 413) [51]. Then, P1 undergoes demethylation to generate P2 (m/z 385). Subsequently, •O2− readily attacks the oxygen-containing moiety for dehydration and decarboxylation to generate the product P3 (m/z 302). Finally, P3 undergoes a gradual process involving dealkylation, dihydroxylation, and ring-opening reactions, ultimately converting into the product P4 (m/z 136) [52]. In pathway Ⅱ, TCH is dehydrated by •O2− attack on the oxygen-containing group and simultaneously demethylated to produce P5 (m/z 391) [53]. Then, P5 undergoes dehydroxylation and amidation reaction pathways, generating the product P6 (m/z 384). P6 is then demethylated under free radical attack and undergoes deamidation and hydroxylation, gradually transforming into the intermediate P7 (m/z 343). In pathway Ⅲ, •OH readily attacks the –N–CH3 group, leading to the demethylation reaction of TCH to generate P8 (m/z 400). The carbon–oxygen ring in P8 is then cleaved by oxidation via •O2⁻ attack to generate the product P9 (m/z 377) [54]. Then, P9 undergoes complex oxidative processes, such as ring-opening, dihydroxylation, and deamidation, to produce P10 (m/z 138) [55]. Through subsequent oxidative reactions, the pathway-derived products are transformed into less toxic metabolites (P4, P9) with lower molecular weights. These compounds can ultimately be mineralized into inorganic end products, including CO2 and H2O [56].
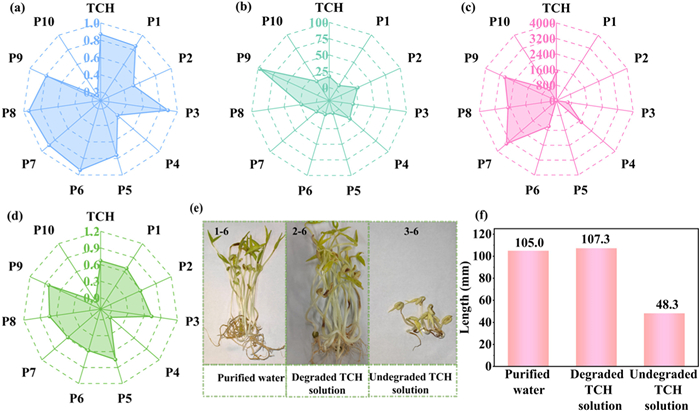
Following photo-Fenton oxidation degradation, the intermediates generated via the three proposed pathways exhibit lower toxicity than the parent TCH (Figs. 5a–d). Notably, intermediates P4 and P10 showed "developmentally nontoxicity". After oxidization by free radicals, several intermediate byproducts demonstrate attenuated toxicity profiles, with P4 and P10 becoming "non-mutagenic". Overall, the toxicity assessment confirm that the photo-Fenton catalytic process can effectively mitigate the ecological risks posed by TCH. To systematically assess the ecological safety of the degradation products, the growth of mung beans was monitored in pure water, TCH solution, and treated TCH solution. Although mung beans germinate in the original TCH solution, significant growth inhibition is observed by day 6 (Fig. 5e and Fig. S7 in Supporting information). In contrast, mung beans germinate and grow well in the pure water and degraded solutions. As shown in Fig. 5f, stem elongation exhibits remarkable differences among treatments. The growth of mung beans in pure water (105.0 mm) and the degraded TCH solution (107.3 mm) was significantly greater than that in the untreated TCH solution (48.3 mm).
Electron paramagnetic resonance (EPR) and radical trapping experiments were performed to investigate the reactive oxygen species generated during the reaction process. In this experiment, methanol (MeOH) was selected as the trapping agent to h+, l-histidine (l-His) for •OH, and sodium oxalate (Na2C2O4) for •O2−, respectively. The addition of these free radical trapping agents inhibits the degradation efficiency of TCH to varying degrees. To further investigate the dominant reactive species in the system, ammonium oxalate (AO), tert‑butanol (TBA), and p-benzoquinone (p-BQ) were selected as quenchers for h+, •OH, and •O2−, respectively. As shown in Figs. S8a and b (Supporting information), the inhibitory effects of the different quenchers on the reaction were found to be largely comparable. In addition, 1, 3-dimethyl-5-pyrazolone and 2, 2, 6, 6-tetramethoxypyridine oxide (TEMPO) were employed as selective trapping agents, and the presence of the •O2−, •OH and h+ reactive species during the reaction process was analyzed by EPR (Figs. 6a–c). No signals corresponding to •OH or •O2− were detected at the beginning of the reaction. However, both radical species were observed within 5 min under standard reaction conditions, and prolonging the irradiation time beyond 10 min led to enhanced signal intensities, indicating that •OH and •O2− radicals were continuously generated throughout the photo-Fenton reaction process. Due to its intrinsic paramagnetism, TEMPO, when utilized as an h+ trapping agent, exhibited a spontaneous EPR signal in dark conditions (Fig. 6c). With the extension of light irradiation time during the photo-Fenton reaction, h+ generated on the catalyst surface combined with the single electrons of TEMPO, causing the amount of the trapping agent to decrease. Consequently, the longer the light time was, the weaker the EPR signal became [57]. Consistent with the EPR analysis, the use of radical scavengers in the trapping experiments confirm the presence of reactive species. These results verify that •OH and •O2− served as the primary oxidative species responsible for pollutant degradation across all reaction stages.
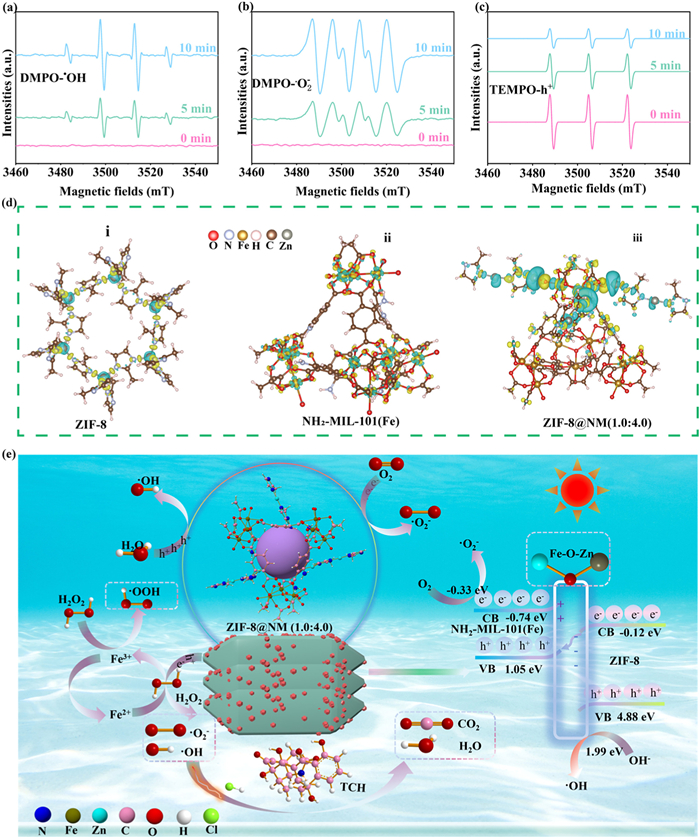
To investigate the catalytic capabilities of ZIF-8@NM(1.0:4.0) more precisely, charge density differences were computed using density functional theory (DFT). Detailed calculation parameters are provided in Text S5 (Supporting information), with an isosurface value set at 0.005 e/Å3. As shown in Fig. 6d, the electron accumulation regions are shown in yellow, while the dissipation regions are shown in blue. The results suggest the occurrence of dynamic charge transfer between the Fe–O and Zn–N sites. As exhibited in Fig. 6d-iii, the dissipation of electrons around Zn and the accumulation of electrons around Fe can be observed in ZIF-8@NM(1.0:4.0). The dynamics of charge transfer are probably originated from the formation of Fe–O–Zn bonds, which facilitates the establishment of an S-scheme heterojunction, as evidenced by multiple characterization analyses.
A possible reaction mechanism was proposed based on experiments and DFT calculations (Fig. 6e). The
In summary, a heterojunction material composed of ZIF-8 was effectively fabricated at the interface of the NH2−MIL-101(Fe) subsatrate via a straightforward solvothermal epitaxial growth method. The resulting MOF-on-MOF photocatalyst with an S-scheme heterojunction structure exhibits a degradation efficiency reaching 91.4% within 90 min under visible light irradiation. Notably, the catalyst maintained acceptable catalytic degradation activity across a wide pH range (3–9), demonstrating excellent environmental adaptability. The level of toxicity in the intermediate products formed were considerably reduced compared to the initial pollutant. In addition, the primary active substances interacting with TCH during the reaction were detected to be •O2− and •OH. The enhanced catalytic activity is attributed to the tightly connected interface and the regulated electronic structure of Fe–O–Zn bonds. The rational construction of the S-scheme heterojunction effectively suppressed the recombination of photogenerated charge carriers through the formation of a stable internal electric field. This study offers a practical approach for designing S-scheme heterojunction catalysts to enhance TCH degradation, offering new insights into wastewater treatment via the photo-Fenton process under real sunlight conditions.
The authors declare that they have no known competing financial interests or personal relationships that could have appeared to influence the work reported in this paper.
Yu Wang: Writing – original draft, Validation, Software, Resources, Methodology, Investigation. Changjiang Lu: Investigation, Formal analysis, Data curation. Danhua Jiao: Software, Resources, Formal analysis, Data curation. Fei Wang: Software, Methodology, Investigation, Data curation. Xiaojian Gong: Supervision, Software, Resources, Data curation. Tianhua Yu: Writing – review & editing, Resources, Project administration, Conceptualization. Anping Wang: Writing – review & editing, Supervision, Project administration, Funding acquisition, Data curation, Conceptualization. Chong-Chen Wang: Writing – review & editing, Conceptualization.
This work is supported by the project of Guizhou Provincial Graduate Student Research Fund (No. 2024YJSKYJJ162), the Guizhou Provincial Department of Science and Technology Projects (Nos. Qiankehe Jichu-ZK [2024] 055, Qiankehe Zhicheng [2023] 078, and Qiankehe Pingtai-KXJZ [2024] 029), and the National Natural Science Foundation of China (No. 22466011).
Supplementary material associated with this article can be found, in the online version, at doi:
X. Chen, R.T. Guo, W.-g. Pan, et al., Appl. Catal. B: Environ. 318 (2022) 121839. doi: 10.1016/j.apcatb.2022.121839
Y. Wu, X. Li, H. Zhao, et al., Chem. Eng. J. 426 (2021) 131255. doi: 10.1016/j.cej.2021.131255
J. Cai, S. Liu, Y.B. Man, et al., Chem. Eng. J. 507 (2025) 160725. doi: 10.1016/j.cej.2025.160725
H. Hu, H. Lin, X. Chen, et al., Chem. Eng. J. 476 (2023) 146682. doi: 10.1016/j.cej.2023.146682
L. Jin, Y. Huang, H. Liu, et al., J. Hazard. Mater. 463 (2024) 132904. doi: 10.1016/j.jhazmat.2023.132904
Y. Mo, Y. Wang, L. Wang, et al., J. Hazard. Mater. 495 (2025) 138800. doi: 10.1016/j.jhazmat.2025.138800
L. Liu, M. Chen, X. Wei, et al., Sep. Purif. Technol. 353 (2025) 128537. doi: 10.1016/j.seppur.2024.128537
X. Wu, Q. Zhao, F. Guo, et al., Carbon 183 (2021) 628–640. doi: 10.1016/j.carbon.2021.07.006
Z. Cao, Y. Zhao, Z. Zhou, Q, et al., Appl. Surf. Sci. 590 (2022) 153081. doi: 10.1016/j.apsusc.2022.153081
D. Xing, Z. Cui, Y. Liu, Z, et al., Appl. Catal. B: Environ. 290 (2021) 120029. doi: 10.1016/j.apcatb.2021.120029
Z. Ling, Y. Gu, B. He, et al., Sep. Purif. Technol. 349 (2024) 127841. doi: 10.1016/j.seppur.2024.127841
S. Ghosh, J. Krishnan, S.S. Hossain, A. Dhakshinamoorthy, S. Biswas, ACS Appl. Mater. Interfaces 15 (2023) 26843–26851. doi: 10.1021/acsami.3c04278
Y. Wang, Z. Liu, Z. Zhao, et al., Chem. Eng. J. 499 (2024) 156279. doi: 10.1016/j.cej.2024.156279
F. Ahmadijokani, A. Ghaffarkhah, H. Molavi, et al., Adv. Funct. Mater. 34 (2024) 2305527. doi: 10.1002/adfm.202305527
K.A. Adegoke, N.W. Maxakato, Mater. Today Energy 21 (2021) 100816. doi: 10.1016/j.mtener.2021.100816
A. Rajan, C. Yazhini, M. Dhileepan, B. Neppolian, Chemosphere 352 (2024) 141473. doi: 10.1016/j.chemosphere.2024.141473
R. Guo, W. Qin, B. Wang, et al., Sep. Purif. Technol. 351 (2024) 128059. doi: 10.1016/j.seppur.2024.128059
L. Yuan, C. Zhang, Y. Zou, et al., Adv. Funct. Mater. 33 (2023) 2214627. doi: 10.1002/adfm.202214627
C. Liu, Q. Sun, L. Lin, et al., Nat. Commun. 11 (2020) 4971. doi: 10.1038/s41467-020-18776-z
T. Gao, H. Zhang, X. Zhao, et al., Appl. Surf. Sci. 651 (2024) 159227. doi: 10.1016/j.apsusc.2023.159227
L. Wu, H. Fu, Q. Wei, et al., Environ. Sci. Pollut. Res. 28 (2021) 5218–5230. doi: 10.1007/s11356-020-10812-1
K. Vinothkumar, R.G. Balakrishna, Appl. Catal. B: Environ. 340 (2024) 123199. doi: 10.1016/j.apcatb.2023.123199
J. Wang, W. Wang, Y. Deng, et al., Sep. Purif. Technol. 340 (2024) 126840. doi: 10.1016/j.seppur.2024.126840
N. Zhang, M. Liu, Y. Wang, et al., Mater. Today Energy 38 (2023) 101419. doi: 10.1016/j.mtener.2023.101419
Y. Bao, H. Ru, Y. Wang, et al., Adv. Funct. Mater. 34 (2024) 2314611. doi: 10.1002/adfm.202314611
H. Tong, R. He, G. Chen, et al., J. Colloid Interface Sci. 671 (2024) 732–741. doi: 10.1016/j.jcis.2024.05.211
P. Cai, N. Zhang, Y. Wang, et al., Sep. Purif. Technol. 362 (2025) 131872. doi: 10.1016/j.seppur.2025.131872
X. Zheng, Z. Yang, G. Zeng, et al., Chem. Eng. J. 505 (2025) 159865. doi: 10.1016/j.cej.2025.159865
H. Yang, Y. Wan, Q. Cheng, H. Zhou, Z. Pan, Dalton Trans. 51 (2022) 15080–15088. doi: 10.1039/D2DT01680J
M. Hu, D. Zhao, X. Yan, et al., Appl. Catal. B: Environ. 362 (2025) 124753. doi: 10.1016/j.apcatb.2024.124753
A. Singh, A. Bhatnagar, A.K. Gupta, Sep. Purif. Technol. 363 (2025) 132176. doi: 10.1016/j.seppur.2025.132176
A. Zhang, F. Shan, Z. Zhang, et al., Sep. Purif. Technol. 344 (2024) 127212. doi: 10.1016/j.seppur.2024.127212
J. Zou, Q.Q. Tang, B. Wu, et al., Appl. Catal. B: Environ. 366 (2025) 4963124.
X. Li, E. Shang, J. Li, J. Tian, J. Li, Chem. Eng. J. 508 (2025) 160930. doi: 10.1016/j.cej.2025.160930
C. Adena, T. Imae, Chem. Eng. J. 506 (2025) 160037. doi: 10.1016/j.cej.2025.160037
T. Huec, A. López-Francés, I. Lázaro, et al., ACS Appl. Nano Mater. 18 (2024) 20201–20212.
D. Sun, D. Chu, M. Xu, C. Xing, L. Ling, J. Hazard. Mater. 496 (2025) 139422. doi: 10.1016/j.jhazmat.2025.139422
J. Yang, X. Hao, J. Liu, Z. Nan, Z. Jin, Sep. Purif. Technol. 354 (2025) 129348. doi: 10.1016/j.seppur.2024.129348
J. Sun, H. Wu, C. Fu, et al., Appl. Catal. B: Environ. 351 (2024) 123976. doi: 10.1016/j.apcatb.2024.123976
Y. Zhang, X. Hao, M. Lu, et al., Nano Energy 136 (2025) 110762. doi: 10.1016/j.nanoen.2025.110762
P. Chen, Z. Zhu, Z. Liu, et al., Chem. Eng. J. 506 (2025) 159689. doi: 10.1016/j.cej.2025.159689
R. Yang, Q. Li, Z. Ma, et al., Chem. Eng. J. 506 (2025) 160043. doi: 10.1016/j.cej.2025.160043
Y. Zhou, X. Cui, Y. Zheng, et al., Chem. Eng. J. 507 (2025) 160549. doi: 10.1016/j.cej.2025.160549
J. Ma, A. Li, Q. Liu, et al., Appl. Catal. B: Environ. 367 (2025) 125101. doi: 10.1016/j.apcatb.2025.125101
F. Wang, Y. Gao, Y. Chai, et al., Appl. Catal. B: Environ. 364 (2025) 124848. doi: 10.1016/j.apcatb.2024.124848
Y. Chai, F. Wang, Y. Gao, et al., Environ. Res. 282 (2025) 122099. doi: 10.1016/j.envres.2025.122099
M.Y. Sun, L. Zhang, Y. Li, Chai, et al., Chin. Chem. Lett. 36 (2025) 110035. doi: 10.1016/j.cclet.2024.110035
J. Wang, J. Yao, L. Yin, et al., Chem. Eng. J. 497 (2024) 154836. doi: 10.1016/j.cej.2024.154836
X. Bai, X. Liu, R. Zong, Appl. Catal. B: Environ. 366 (2025) 125062. doi: 10.1016/j.apcatb.2025.125062
Z. Xu, R. Teng, L. Xu, et al., Adv. Funct. Mater. 34 (2024) 2401248. doi: 10.1002/adfm.202401248
L. Sun, X. He, B. Liu, et al., Sep. Purif. Technol. 353 (2025) 128515. doi: 10.1016/j.seppur.2024.128515
X. Liu, S. Chen, X. Tantai, et al., Sep. Purif. Technol. 363 (2025) 132001. doi: 10.1016/j.seppur.2025.132001
S.H. Wang, M. Du, H.L. Guo, et al., J. Mater. Chem. A 13 (2025) 5860–5869. doi: 10.1039/D4TA08391A
J. Fu, X. Liu, G. Huang, Z. Wang, Chem. Eng. J. 505 (2025) 159260. doi: 10.1016/j.cej.2025.159260
P. Kaur, D. Aggarwal, S. Singhal, Adv. Compos. Hybrid Mater. 8 (2025) 156.
Y. Pei, A. Lei, M. Wang, et al., J. Hazard. Mater. 488 (2025) 137286. doi: 10.1016/j.jhazmat.2025.137286
X. Hua, H. Chen, Z. Wang, et al., Sep. Purif. Technol. 347 (2024) 127632. doi: 10.1016/j.seppur.2024.127632
N. Li, Y. Niu, W. An, et al., Appl. Catal. B: Environ. 369 (2025) 125141. doi: 10.1016/j.apcatb.2025.125141
Y. Zhang, F. Zhou, X. Ding, et al., Chem. Eng. J. 508 (2025) 160891. doi: 10.1016/j.cej.2025.160891
C. Lu, Y. Wang, Z. Yang, et al., J. Environ. Chem. Eng. 13 (2025) 118902. doi: 10.1016/j.jece.2025.118902

Figure 1 (a) Preparation flowchart of the catalysts. (b-d) SEM images of NH2−MIL-101 (Fe), ZIF-8 and ZIF-8@NM(1.0:4.0). (e, f) HRTEM image of ZIF-8@NM(1.0:4.0). (g-k) EDS elemental scans of ZIF-8@NM(1.0:4.0).

Figure 2 (a) XRD spectra of the catalysts. (b) FT-IR spectra of the catalysts. (c) N2 adsorption–desorption isotherms of ZIF-8@NM(1.0:4.0). (d) XPS full spectrum of the catalyst. (e) Fe 2p, (f) Zn 2p, (g) O 1s, (h) C 1s, (i) N 1s for the ZIF-8@NM(1.0:4.0).

Figure 3 (a) UV–vis diffuse reflectance spectra, (b) band gaps, and (c) photoluminescence spectra of the catalysts. (d) Electrochemical impedance spectroscopy Nyquist plot for different catalysts. (e) Mott–Schottky diagrams of ZIF-8. (f) Mott–Schottky diagrams of NH2−MIL-101(Fe). (g) UPS spectrum of ZIF-8. (h) UPS spectrum of NH2-MIL-101(Fe). (i) Energy band structure of ZIF-8 and NH2−MIL-101(Fe). (j) Schematic diagram of the work function.

Figure 4 (a) Performance of various catalysts in TCH degradation. (b) Plot of ZIF-8@NM(1.0:4.0) dosing. (c) Effects of H2O2 concentration and (d) initial pH on TCH degradation. (e) Impact of TCH initial concentration on catalytic degradation. (f) Effects of different anions on TCH degradation. (g) Cycling stability test of the catalyst for TCH degradation. (h) Comparison of the XRD patterns of the ZIF-8@NM(1.0:4.0) catalyst before and after the cycling tests. (i) Metal ion leaching concentration.

Figure 5 (a) Developmental toxicity, (b) daphnia magna (LC50) (48 h), (c) oral rat LD50, (d) mutagenicity of the different intermediates. (e) Growth of mung bean sprouts subjected to different irrigation solutions. (f) Effect of different irrigation solutions on the length of mung bean sprouts.

 扫一扫看文章

扫一扫关注我们
 DownLoad:
 下载:
下载:

 下载:
下载: