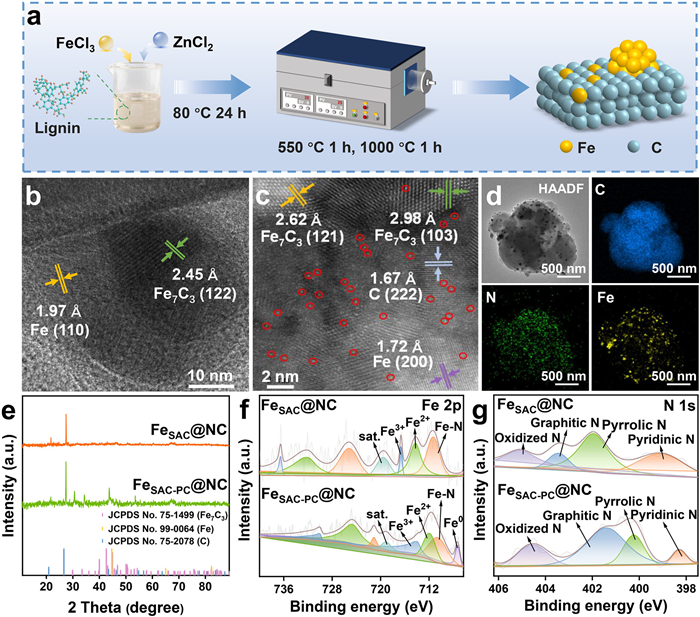
Figure 1.
(a) Schematic diagram of the preparation of FeSAC-PC@NC. (b) HR-TEM image, (c) HAADF-STEM image and (d) EDS images of FeSAC-PC@NC. (e) The XRD pattern of samples. High resolution XPS spectra of (f) Fe 2p and (g) N 1s.

Synergistic Fe single-atom and nanoparticle dual-site catalysis in electrocatalytic system for enhanced H2O2 adsorption and activation
Chunhe Cao , Wenwen Zheng , Suhang Meng , Qiuyu Rong , Yi Li


With the acceleration of industrialization, antibiotic pollution has intensified and new antibiotics continue to emerge, posing a serious threat to the global water environment [1,2]. The electro-Fenton (EF) process generates hydrogen peroxide (H2O2) in situ by reducing oxygen (O2) [3], followed by the production of various reactive oxygen species (ROS) [4,5], such as hydroxyl radicals (•OH) [6], enabling efficient degradation of antibiotic pollutants [7]. The EF technology, as a type of advanced oxidation process (AOPs), has attracted widespread attention in the field of wastewater treatment in recent years due to its advantages such as high oxidation efficiency, no secondary pollution, and low generation of toxic intermediate byproducts [8]. These characteristics make it more in line with the current concept of "green development". However, despite its promising application potential, the EF process still faces several key challenges, such as the low efficiency of H2O2 generation and activation, poor selectivity of ROS, and relatively high overall energy consumption [9]. These limitations significantly restrict the practical implementation and widespread application of the EF technology in the treatment of antibiotic-containing wastewater. Therefore, how to achieve efficient generation and activation of H2O2, and thereby optimize the overall performance and cost-effectiveness of the EF system, has become an important research direction in this field [10].
To promote the efficient in situ generation of H2O2, researchers have explored various materials as supports for electrocatalysts. Among them, biochar, as a novel carbon-rich material, has the advantages of large specific surface area, low cost, abundant mesoporous structures, self-doped heteroatoms, and fewer conjugated π structures, which contributes to the production of H2O2 [11-13]. It demonstrates the potential for efficient in situ generation of H2O2 via the 2e- pathway for O2 reduction [14,15]. Nevertheless, carbon-based materials still face certain limitations in activation of H2O2.
Metallic nanoparticles (PCs) possess good stability, high activation capability, and abundant metal-metal active sites, which can effectively promote the generation of Fe2+/Fe3+ redox cycling through the modulation of metal-metal interactions, thereby enhancing H2O2 activation [16-18]. However, current PCs catalysts still suffer from insufficient control over metal site exposure and low atomic utilization, which can lead to high costs and poor catalytic efficiency, hindering the effective activation of H2O2. In contrast, single-atom catalysts (SACs) offer well-defined active sites, higher atomic utilization, and tunable coordination environments, making them promising candidates for efficient H2O2 activation [19-21]. Nevertheless, SACs face challenges such as inhomogeneous active site distribution and susceptibility of the metal centers to being occupied, which limit their catalytic performance [22,23]. Therefore, it has been proposed that when SACs and PCs coexist, the synergistic effect between metal entities of different scales has the potential to overcome the individual limitations of SACs and PCs, significantly enhancing the reaction activity, and thereby effectively improving the catalytic efficiency [24,25]. It is thus clear that the construction of cooperative active sites between SACs and PCs holds great promise for the precise regulation of the electronic structure and coordination environment of SACs, accelerating the Fe2+/Fe3+ redox cycle, and ultimately achieving efficient in situ activation of H2O2.
In this study, based on the synergistic interaction between Fe SACs and Fe0/Fe7C3 PCs, we successfully constructed a Fe single-atom-nanoparticle composite catalyst (FeSAC-PC@NC) by employing a simple impregnation-calcination method. And it was applied to the EF system, achieving highly efficient removal of antibiotic pollutants. The incorporation of Fe0/Fe7C3 PCs can precisely regulate the electronic structure of Fe SAC sites, thereby significantly improving their adsorption capacity for H2O2 and enhancing electron transfer efficiency, which further promotes the efficient activation of H2O2. Moreover, in practical degradation tests, the catalyst achieved a removal efficiency of over 95% for sulfamethoxazole (SMX) within 60 min, and maintained an efficiency above 90% after four cycles, showcasing excellent catalytic activity and structural stability, and indicating great potential for real-world applications.
All chemical reagents used in the experiment are shown in Text S1 (Supporting information). All experimental methods are shown in Texts S2-S9 (Supporting information).
The Fe single-atom catalyst (FeSAC@NC) and its FeSAC-PC@NC counterpart were successfully synthesized by using a simple impregnation-pyrolysis method, with N-doped biochar serving as the support (Fig. 1a). Scanning electron microscopy (SEM) analysis reveals that FeSAC-PC@NC has a porous 3D structure, indicating a large specific surface area that is beneficial for enhancing catalytic activity (Fig. S1 of Supporting information). High resolution transmission electron microscope (HR-TEM) reveals that no obvious lattice structure is observed on the surface of FeSAC@NC particles, and weak carbon shell lattice fringes can be seen at the particle edges, which preliminarily confirms that Fe species in FeSAC@NC do not form PCs (Fig. S2a in Supporting information). In contrast, some obvious lattice structures can be observed on the surface of FeSAC-PC@NC (Fig. 1b), with lattice spacings of 1.97 Å and 2.45 Å, corresponding to the (110) plane of Fe and the (122) plane of Fe7C3, respectively, suggesting that Fe species in FeSAC-PC@NC exist in the form of nanoparticles. Further high-angle annular dark-field-scanning TEM (HAADF-STEM) images show that Fe SACs are uniformly dispersed on the carbon surface of FeSAC@NC at the material edges, and distinct lattice fringes with a spacing of 3.36 Å can be observed corresponding to the (111) plane of carbon, accurately confirming the presence of Fe in the form of SACs in FeSAC@NC (Fig. S2b in Supporting information). In Fig. 1c, Fe SACs and distinct lattice fringes are clearly visible on the surface of FeSAC-PC@NC with lattice spacings of 2.62, 2.98, 1.67, and 1.72 Å, corresponding to the (121) and (103) planes of Fe7C3, the (222) plane of C, and the (200) plane of Fe, respectively. This indicates that Fe in FeSAC-PC@NC exists both as Fe SACs and as Fe0/Fe7C3 PCs, further confirming the successful preparation of both FeSAC@NC and FeSAC-PC@NC materials. The energy-dispersive X-ray spectroscopy (EDS) mapping (Fig. 1d) demonstrates that C and N elements are uniformly distributed in the FeSAC-PC@NC material, while Fe is embedded in the carbon-nitrogen matrix in the form of particulates and atoms, which is consistent with the TEM and HAADF-STEM results. X-ray diffraction (XRD) analysis further confirms the successful synthesis of the FeSAC-PC@NC material with a synergistic combination of Fe SACs and Fe0/Fe7C3 PCs. As shown in Fig. 1e, no characteristic diffraction peaks of Fe are observed in FeSAC@NC. In contrast, FeSAC-PC@NC exhibits diffraction peaks at 29.88°, 33.48°, and 44.67°, corresponding to the (103) and (121) planes of Fe7C3 (PDF #75–1499) and the (110) plane of Fe (PDF #99–0064), respectively, indicating the formation of Fe0/Fe7C3 PCs in FeSAC-PC@NC. Additionally, a peak at 26.61° is observed in both materials, which corresponds to the (111) plane of graphite carbon (PDF #75–2078). This peak has a sharp shape, and the intensity is higher in FeSAC-PC@NC than that in FeSAC@NC, suggesting that the former contains a higher degree of graphitized carbon, which is beneficial for enhancing electron transport efficiency [26]. As exhibited in Fig. S3 and Table S1 (Supporting information), the isotherms of both catalysts exhibited type IV isotherms [27], which are consistent with mesoporous structures [28]. With the introduction of Fe0/Fe7C3 PCs, the specific surface area increases by approximately 1.5 times. The optimized catalyst exposes more active sites, thereby significantly enhancing its catalytic activity.
X-ray photoelectron spectrometry (XPS) was conducted to investigate the chemical states of the elements on the catalyst surface. The survey spectra reveal the presence of C, N, and Fe elements (Fig. S4a in Supporting information). In the Fe 2p spectrum, characteristic peaks corresponding to Fe0 (707.2 eV), Fe-N (710.5 eV), Fe2+ 2p3/2 (711.9 eV), and Fe3+ 2p3/2 (713.9 eV) are observed, further confirming the coexistence of Fe SACs and Fe0/Fe7C3 PCs. The incorporation of Fe0 facilitates the redox cycle of Fe2+/Fe3+ (Eq. 1), thereby promoting the efficient progression of the EF reaction.
|
|
(1) |
Additionally, the characteristic peaks in FeSAC-PC@NC are shifted toward lower binding energies, indicating an increase in electron cloud density around the Fe active sites (Fig. 1f). Fig. 1g displays the high-resolution XPS of N 1s, which can be divided into five peaks corresponding to pyridinic N (398.3 eV), pyrrolic N (400.1 eV), graphitic N (401.4 eV), N-O (404.5 eV) [29]. After the introduction of Fe0/Fe7C3 PCs, the content of graphitic N increases from 10.38% to 52.20%, which is beneficial for the highly selective generation of singlet oxygen (1O2) (Fig. S4b in Supporting information) [30].
Based on the above characterizations, the catalyst with synergistic coordination of Fe SACs and Fe0/Fe7C3 PCs has been successfully fabricated. The introduction of nanoparticles precisely regulates the electronic structure of Fe active sites, optimizing their coordination environment and thereby enhancing catalytic activity. To further evaluate the electrochemical degradation performance of the FeSAC-PC@NC catalyst, we conducted degradation experiments using SMX as the target pollutant. As shown in Fig. 2a, the degradation efficiency of SMX exceeds 95% within 60 min in the FeSAC-PC@NC system, whereas the removal rate in the FeSAC@NC system is only 45%. The first-order kinetic fitting result indicates that the rate constant for FeSAC-PC@NC is 0.049 min-1, which is 3.8 times higher than that of FeSAC@NC (0.013 min-1), demonstrating the superior degradation activity of FeSAC-PC@NC toward pollutants. The catalyst itself showed no adsorption removal of the pollutant (Fig. S5 in Supporting information), indicating that the activation of H2O2 to ROS plays a crucial role in the rapid removal of SMX.
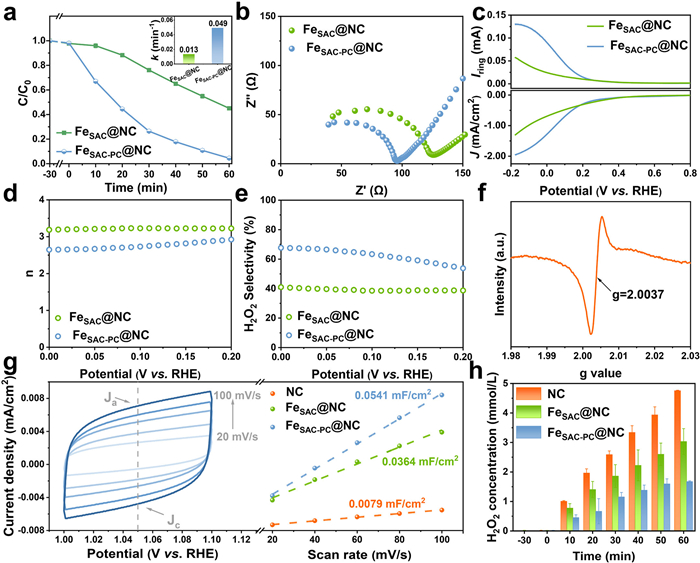
In order to gain a deeper understanding of the reaction mechanism, we conducted a series of electrochemical tests. The electrochemical impedance spectroscopy (EIS) (Fig. 2b) demonstrate that FeSAC-PC@NC exhibits smaller charge transfer resistance and the faster charge transfer rate, and thus exhibits the faster catalytic activity [31]. In addition, rotating ring-disk electrode (RRDE) is widely recognized as having a significant advantage in evaluating the oxygen reduction reaction (ORR) performance of materials [32]. The ORR polarization curves of the FeSAC-PC@NC were obtained using the RRDE in an aqueous solution containing 50.0 mmol/L Na2SO4 at pH 3.0, as depicted in Fig. 2c. After the introduction of Fe0/Fe7C3 PCs, the ring current of the sample significantly increases. The analysis of the electron transfer number (n, Fig. 2d) and H2O2 selectivity (Fig. 2e) reveals that FeSAC-PC@NC exhibits a n value closer to 2 and higher H2O2 selectivity compared to FeSAC@NC, indicating a significant improvement in the efficiency of H2O2 production [33]. The LSV curves of FeSAC-PC@NC at different rotation rates (Fig. S6 in Supporting information) show that the disk current increases steadily with the increase of rotation rate, indicating enhanced mass transport and electrochemical activity. The n value (Fig. S7a in Supporting information) and H2O2 selectivity (Fig. S7b in Supporting information) exhibit minimal variation, demonstrating the stable ORR performance of FeSAC-PC@NC under diverse rotational conditions. The EPR analysis (Fig. 2f) of biochar (NC) reveals the presence of abundant carbon defects on the catalyst surface. It has been reported that intrinsic carbon defects in carbon materials exhibit excellent selectivity for the electrochemical synthesis of H2O2 [34,35]. Therefore, it is inferred that the carbon defects on the catalyst surface in this system serve as effective active sites for H2O2 generation. In addition, as shown in Fig. 2g and Fig. S8 (Supporting information), the CV curves of the sample measured at various scan rates (20, 40, 60, 80, and 100 mV/s) exhibit a rectangular shape, indicating that the electrochemical behavior originated from the double-layer capacitance (Cdl) [36]. The calculated Cdl value for FeSAC-PC@NC is 0.0541 mF/cm2, which is higher than those of FeSAC@NC and NC. This indicates that FeSAC-PC@NC possesses a larger effective electrochemical surface area (ECSA) [37], which provides more active sites and promotes the activation of H2O2. Furthermore, the concentration of H2O2 (Fig. 2h) confirmed the strong capability of carbon defects in H2O2 generation, while also demonstrating that the incorporation of PCs significantly enhances the efficient activation of H2O2. These results suggest that the synergistic interaction between Fe0/Fe7C3 PCs and Fe SACs effectively enhances electron transfer efficiency, enabling the efficient generation and activation of H2O2.
In order to identify the dominant ROS in the system, we used t‑butyl alcohol (TBA), p-benzoquinone (p-BQ), l-histidine (l-his), and catalase (Cat.) to quench •OH, superoxide free radical (O2•-), 1O2, and H2O2 in the FeSAC-PC@NC system [38], respectively. As shown in Figs. 3a and b, after quenching 1O2 and •OH, SMX removal efficiency drops to 19.1% and 25.6%, respectively, with kinetic rate constants of 0.0033 and 0.0050 min-1, suggesting that 1O2 and •OH are the main ROS driving SMX degradation. The electron paramagnetic resonance (EPR) measurements (Figs. 3c-e) confirm the presence of •OH, O2•-, and 1O2 in both FeSAC@NC and FeSAC-PC@NC systems. FeSAC@NC exhibits a stronger •OH signal peak at 10 min, while FeSAC-PC@NC shows a stronger 1O2 signal peak [39]. Based on these findings, it is inferred that the introduction of Fe0/Fe7C3 PCs enables the construction of a dual-site synergistic structure in SACs and PCs, which effectively regulates the activation pathway of H2O2, making it more favorable for the generation of 1O2. Fluorescence tests further support these trends by using terephthalic acid (TA) and singlet oxygen green fluorescent probe (SOSG). As shown in Fig. 3f, the fluorescence response of •OH in FeSAC@NC system first increases and then decreases, while in FeSAC-PC@NC system, it rapidly drops to zero after applying the voltage. This indicates that •OH is continuously generated in FeSAC@NC system, but it is likely rapidly consumed or almost no longer produced in FeSAC-PC@NC system, which is consistent with the 3e- ORR process observed for FeSAC@NC in Fig. 2d. In contrast, the fluorescence response of 1O2 shows the opposite trend (Fig. 3g). This suggests that 1O2 is constantly consumed in FeSAC@NC system but continuously produced in FeSAC-PC@NC system. This indicates that the synergistic effect between SACs and PCs enables the regulation of H2O2 activation pathway, making it more favorable for the selective generation of 1O2, which is consistent with the EPR test results. From above tests, it can be observed that •OH in FeSAC-PC@NC system rapidly disappears after the voltage is applied. However, the quenching experiments (Fig. 3a) shows that when •OH is quenched, the removal efficiency of SMX significantly decreases, suggesting that •OH may act as an important intermediate in the generation of 1O2. To verify this hypothesis, we quench H2O2, O2•-, and •OH in FeSAC-PC@NC system, then detect the concentration of 1O2 using EPR and SOSG. As shown in Fig. 3h and Fig. S9 (Supporting information), the suppression of the EPR signal of 1O2 is most pronounced in the presence of p-BQ and TBA, confirming that O2•- and •OH serve as key intermediates in the H2O2-mediated generation of 1O2 and play a crucial role in its formation.
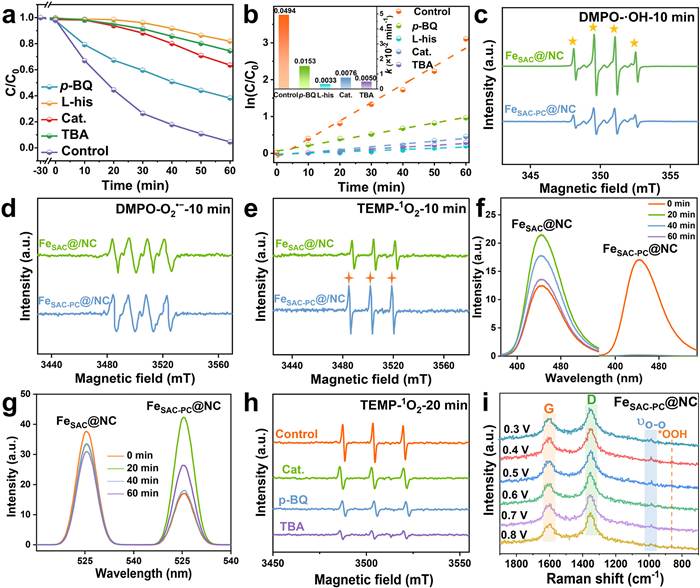
In the H2O2-mediated electrocatalytic process, *OOH is a key intermediate in the generation of •OH from H2O2 [40,41]. Therefore, to verify the main source of •OH in FeSAC-PC@NC system, we monitor the reaction process using in situ Raman spectroscopy. In Fig. 3i, the stretching vibration signals of the *OOH intermediate at 858 cm-1 and the O-O stretching vibration peak of *OOH at 985 cm-1 are clearly observed [42]. As the applied potential gradually decreases, the Raman signals of these characteristic peaks gradually increase, reaching the highest intensity at 0.4 V. This stage may correspond to the transformation process of *OOH, indicating that *OOH acts as a reactive intermediate in the formation of •OH in FeSAC-PC@NC system.
Therefore, it is inferred that the electrocatalytic removal of SMX in FeSAC-PC@NC system occurs via 3e- ORR pathway mediated by O2 and H2O2. Specifically, O2 first adsorbs onto surface active sites (*), and is then reduced to form the *O2•- intermediate (Eq. 2). In the presence of H2O or other proton sources, O2•- is protonated to generate *OOH (Eq. 3) [43], which is subsequently reduced and protonated to yield H2O2 (Eq. 4). Subsequently, H2O2 may be transformed into •OH through the *OOH intermediate (Eq. 5) [44,45]. The electron-donating effect of Fe nanoparticles facilitates the redox cycle of Fe (Eq. 1), resulting in the abundant generation of •OH. The reaction between •OOH and •OH then leads to the formation of 1O2 (Eq. 6) [46,47]. Afterwards, 1O2, as a key ROS involved in SMX degradation, oxidizes SMX into intermediates and ultimately mineralizes into CO2 and H2O (Eq. 7).
|
|
(2) |
|
|
(3) |
|
|
(4) |
|
|
(5) |
|
|
(6) |
|
|
(7) |
DFT calculations elucidate the synergistic interaction between SACs and PCs in activation of H2O2 at the atomic level. Fig. 4a presents the molecular structure model of Fe SACs serving as H2O2 adsorption sites in FeSAC@NC system. Structural optimizations are performed using both Fe SACs and Fe PCs as active sites in FeSAC-PC@NC system (Fig. 4b), and the corresponding total energies are calculated. The results show that the total energy of Fe SACs (−980.40 eV) is lower than that of Fe PCs (−978.25 eV), indicating that Fe SACs possess a more stable structure. Therefore, Fe SACs are selected as the adsorption sites in both systems for further calculations.
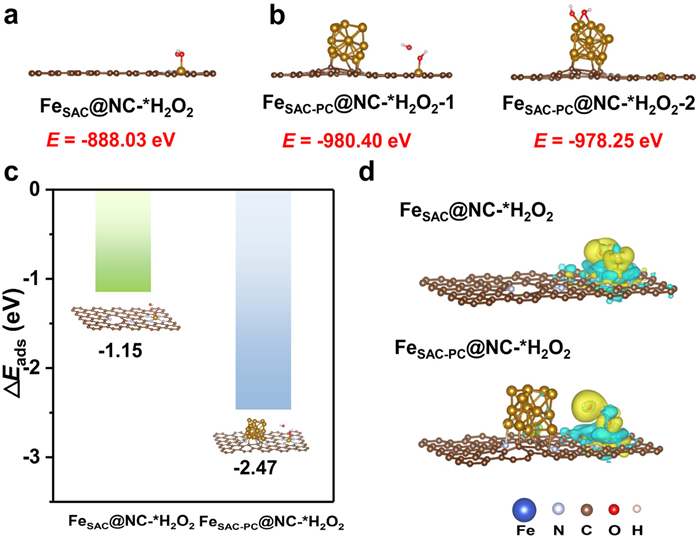
As shown in Fig. 4c, the adsorption energy of H2O2 on FeSAC-PC@NC (−2.47 eV) is significantly lower than that on FeSAC@NC (−1.15 eV), suggesting that the introduction of Fe nanoparticles strengthens the adsorption between Fe SACs and H2O2, thus promoting its activation. Differential charge density analysis (Fig. 4d) further demonstrates that the synergistic interaction between Fe PC and Fe SACs induces an asymmetric redistribution of electrons around the Fe SACs, resulting in an increased electron density at the Fe sites. This electron enrichment subsequently enhances the adsorption capacity of H2O2 at the active sites, which is in agreement with the XPS results. In summary, the synergy between Fe SACs and Fe PCs not only improves the adsorption capacity of H2O2, but also promotes its efficient activation, enabling large-scale generation of •OH radicals and facilitating the highly selective production of 1O2.
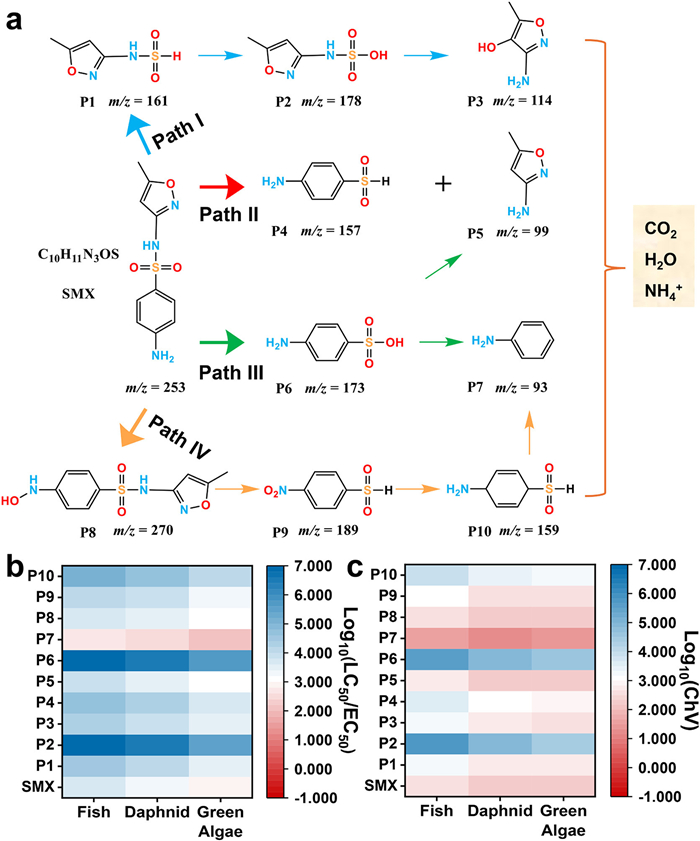
Moreover, to assess the ecological risks associated with this system, the intermediate products generated during the degradation of SMX are identified using high-performance liquid chromatography coupled with mass spectrometry (HPLC-MS). Based on these findings (Fig. 5a and Table S2 in Supporting information), four possible degradation pathways are proposed (Text S10 in Supporting information), all consistent with the main oxidation route of SMX [48,49]. As the reaction progresses, SMX and its intermediates are ultimately mineralized into harmless products such as H2O, CO2, and inorganic salts. Subsequently, the ecological structure-activity relationships (ECOSAR) program is employed to predict both acute and chronic toxicity based on indicator species, including fish, daphnids, and green algae (Figs. 5b and c) [50-52]. The results show that in the EF system, most of the intermediates exhibit lower toxicity than SMX.
In addition to electrocatalytic activity, the universality and cycling stability are also important indicators for evaluating catalyst performance. As shown in Fig. 6a, FeSAC-PC@NC achieves a removal efficiency of over 90% for SMX solutions with varying concentrations (30–90 mg/L). Furthermore, its removal efficiencies for sulfadimidine (SDM), sulfisoxazole (SIZ) and tetracycline hydrochloride (TC) all exceed 93% (Fig. 6b), demonstrating its excellent universality. In terms of cycle stability, the removal efficiency of SMX remains above 90% after four consecutive cycles (Fig. 6c). Moreover, as shown in Fig. S10 (Supporting information), no obvious structural degradation is observed in the FeSAC-PC@NC catalyst after the reaction, indicating that it possesses good reusability.
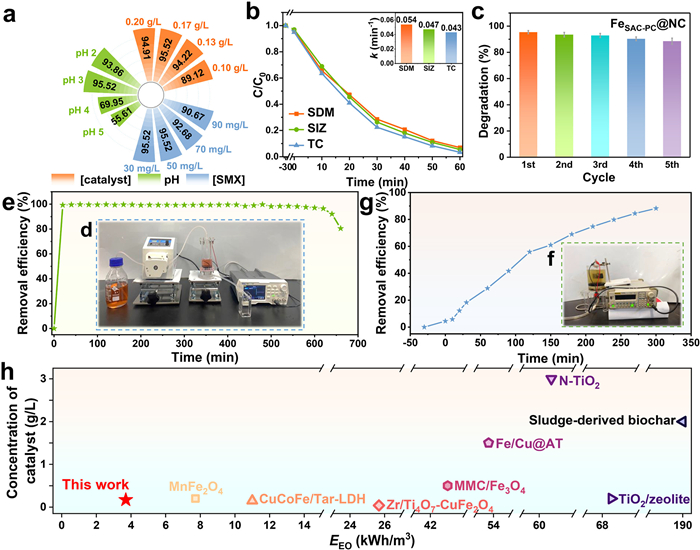
To further explore the potential application value of FeSAC-PC@NC, we immobilized FeSAC-PC@NC on polyvinylidene difluoride (PVDF) membranes by vacuum filtration and built a continuous-flow experiment for wastewater treatment (Fig. 6d). This approach successfully solved the problem that powder catalysts are difficult to recycle in practical applications. As shown in Fig. 6e, FeSAC-PC@NC membrane reaction unit maintained above 92% removal of Methyl Orange after 640 min of continuous operation. This demonstrates that it can be used consistently over a long period of time. Meanwhile, we also evaluated the degradation effect of FeSAC-PC@NC system in scaled-up experiment (Fig. 6f). As shown in Fig. 6g, the scaled-up experiment achieves an SMX removal rate of 88% within 300 min, demonstrating the feasibility of FeSAC-PC@NC for large-scale applications. Moreover, operational parameters such as applied voltage and current intensity play a critical role in determing energy consumption and cost efficiency. The energy efficiency of oxidation (EEO) for SMX degradation in this efficient filtration system is 3.7 kWh/m3, much lower than that of other reported catalytic oxidation technologies for wastewater treatment as illustrated in Fig. 6h and Table 3 (Supporting information), highlighting the practical application of FeSAC-PC@NC system.
In summary, Fe SACs and Fe0/Fe7C3 PCs were successfully constructed on a lignin-derived nitrogen-doped biochar support and applied in an EF system for efficient degradation of organic pollutants. The synergistic effect between these two distinct metallic entities: Fe SACs and Fe0/Fe7C3 PCs, not only enhances electron transfer and promotes the Fe2+/Fe3+ redox cycle, but also collaboratively modulates the electronic structure of the active sites, leading to an increased electron density. This electron enrichment subsequently enhances the adsorption capacity of H2O2 at the active sites and thereby improving its activation efficiency. Radical scavenging experiments further demonstrate that the synergistic interaction between Fe SACs and Fe0/Fe7C3 PCs leads to an optimized H2O2 activation pathway, enabling highly selective generation of 1O2 in the EF system. Moreover, under optimal conditions (catalyst dosage: 0.17 g/L, pollution concentration: 50 mg/L, pH 3, voltage 4 V), the removal efficiency of various pollutions reach over 93% within 60 min. Toxicity evaluation and extended experiments indicated that this EF system exhibits low ecotoxicity and excellent continuous degradation performance, making it a promising candidate for continuous and scalable wastewater treatment with an energy efficiency of EEO as low as 3.7 kWh/m3 and controllable operational costs. This study demonstrates that the synergistic strategy between Fe SACs and Fe0/Fe7C3 PCs can precisely regulate the electronic structure of active sites, providing a strategic direction and technical pathway for improving H2O2 activation efficiency in EF systems. The findings hold significant theoretical value and application potential.
Chunhe Cao: Writing – original draft, Investigation, Formal analysis, Conceptualization. Wenwen Zheng: Writing – original draft, Methodology, Investigation. Suhang Meng: Methodology, Data curation. Qiuyu Rong: Methodology. Yi Li: Writing – review & editing, Project administration, Methodology, Funding acquisition, Data curation, Conceptualization.
The authors declare that they have no known competing financial interests or personal relationships that could have appeared to influence the work reported in this paper.
This work was supported by the Natural Science Foundation of China as general projects (Nos. 52570088 and 22376157), the National Key Research and Development Program of China (No. 2024YFC3908501) and Tianjin Commission of Science and Technology as key technologies R&D projects (Nos. 23YFZCSN00130 and 25ZYCGCG00370).
Supplementary material associated with this article can be found, in the online version, at doi:
M.R. Wang, B.L. Bodirsky, R. Rijneveld, et al., Nat. Commun. 15 (2024) 880. doi: 10.1038/s41467-024-44947-3
Z.Y. Zhao, Y.N. Mi, S.L. Wang, X.D. Du, Q.R. Zhang, Water Res. 280 (2025) 123510. doi: 10.1016/j.watres.2025.123510
M. Hassan, H. Olvera-Vargas, X.P. Zhu, B. Zhang, Y.L. He, J. Power Sources 424 (2019) 220–244. doi: 10.1016/j.jpowsour.2019.03.112
S.L. Wang, M.R. Razanajatovo, X.D. Du, et al., Chin. Chem. Lett. 35 (2024) 109140. doi: 10.1016/j.cclet.2023.109140
S. Wang, S.M. Guo, X.D. Du, et al., Chem. Eng. J. 495 (2024) 153604. doi: 10.1016/j.cej.2024.153604
J.Y. Yu, Y. Cheng, A.H. Cai, et al., Chin. Chem. Lett. 36 (2025) 110549. doi: 10.1016/j.cclet.2024.110549
Y. Jiang, J.B. Ran, K. Mao, et al., Ecotoxicol. Environ. Saf. 236 (2022) 113464. doi: 10.1016/j.ecoenv.2022.113464
H.Y. Sheng, A.N. Janes, R.D. Ross, et al., Energy Environ. Sci. 13 (2020) 4189–4203. doi: 10.1039/D0EE01925A
F. Miao, M.M. Gao, X. Yu, et al., Electrochem. Commun. 113 (2020) 106687. doi: 10.1016/j.elecom.2020.106687
X.L. Zhang, C.Y. Wu, Z.H. Wang, et al., Environ. Res. 263 (2024) 120020. doi: 10.1016/j.envres.2024.120020
Z.H. Chen, D. Yan, X.S. Wang, et al., ACS Catal. 15 (2025) 13568–13580. doi: 10.1021/acscatal.5c02889
Z.P. Lou, M.T. Liu, D.Y. Tang, et al., Appl. Catal. B: Environ. 315 (2022) 121523. doi: 10.1016/j.apcatb.2022.121523
H.F. Chan, Q. Du, C.L. Yue, et al., Appl. Catal. B: Environ. 382 (2026) 125953. doi: 10.1016/j.apcatb.2025.125953
M. Tian, Y.Z. Zhu, D.L. Zhang, et al., Nano Energ. 64 (2019) 103940. doi: 10.1016/j.nanoen.2019.103940
S. Kabir, K. Artyushkova, A. Serov, P. Atanassov, ACS Appl. Mater. Interfaces 10 (2018) 11623–11632. doi: 10.1021/acsami.7b18651
J.L. Li, W.W. Zheng, S.H. Meng, et al., Adv. Funct. Mater. 35 (2025) 2417538. doi: 10.1002/adfm.202417538
H.P. Rong, S.F. Ji, J.T. Zhang, D.S. Wang, Y.D. Li, Nat. Commun. 11 (2020) 5884. doi: 10.1038/s41467-020-19571-6
Y. Wang, X.B. Zheng, D.S. Wang, Nano Res. 15 (2022) 1730–1752. doi: 10.1007/s12274-021-3794-0
S.F. Ji, B. Jiang, H.G. Hao, et al., Nat. Catal. 4 (2021) 407–417. doi: 10.1038/s41929-021-00609-x
J.R. Yang, W.H. Li, D.S. Wang, Chem. Catal. 1 (2021) 24–26.
Z.C. Zhuang, Y. Li, Y.H. Li, et al., Energy Environ. Sci. 14 (2021) 1016–1028. doi: 10.1039/D0EE03701J
H.Y. Jing, Z.Y. Zhao, C.Y. Zhang, et al., Nano Res. 14 (2021) 4025–4032. doi: 10.1007/s12274-021-3331-1
D. Zhou, L.L. Zhang, X.Y. Liu, et al., Nano Res. 15 (2022) 519–527. doi: 10.1007/s12274-021-3511-z
L.C. Liu, D.M. Meira, R. Arenal, et al., ACS Catal. 9 (2019) 10626–10639. doi: 10.1021/acscatal.9b04214
C. Mu, Z.H. Liu, Q.F. Yao, Q. He, J.P. Xie, SmartMat 6 (2025) e1317. doi: 10.1002/smm2.1317
X. Guo, H. Zhang, Y.L. Wang, et al., Angew. Chem. Int. Ed. 64 (2025) e202511266. doi: 10.1002/anie.202511266
Z.R. Zhou, Y.N. Li, M.M. Li, Y. Li, S.H. Zhan, Chin. Chem. Lett. 31 (2020) 2698–2704. doi: 10.1016/j.cclet.2020.07.003
J.L. Li, Y.P. Liu, S.H. Meng, et al., ACS ES&T Water 4 (2024) 5868–5879.
H.Y. Gang, H.Y. Deng, L. Yan, et al., J. Colloid Interface Sci. 638 (2023) 252–262. doi: 10.1016/j.jcis.2023.01.093
Y.J. Ji, F.Y. Xu, K. Fang, et al., Environ. Technol. Innov. 38 (2025) 104079. doi: 10.1016/j.eti.2025.104079
S.H. Meng, J.L. Li, S.Y. Wang, et al., Adv. Mater. 37 (2025) 2420080. doi: 10.1002/adma.202420080
C. Xia, S. Back, S. Ringe, et al., Nat. Catal. 3 (2020) 125–134. doi: 10.1038/s41929-019-0402-8
Y.P. Liu, P.F. Wang, L.B. Xie, et al., Angew. Chem. Int. Ed. 63 (2024) e202319470. doi: 10.1002/anie.202319470
X.Y. Lu, D. Wang, K.H. Wu, X.L. Guo, W. Qi, J. Colloid Interface Sci. 573 (2020) 376–383. doi: 10.1016/j.jcis.2020.04.030
W. Wang, Y.X. Zheng, Y.C. Hu, Y.C. Liu, S.L. Chen, J. Phys. Chem. Lett. 13 (2022) 8914–8920. doi: 10.1021/acs.jpclett.2c02684
C.C.L. McCrory, S. Jung, J.C. Peters, T.F. Jaramillo, J. Am. Chem. Soc. 135 (2013) 16977–16987. doi: 10.1021/ja407115p
Y. Tong, J.C. Wu, P.Z. Chen, et al., J. Am. Chem. Soc. 140 (2018) 11165–11169. doi: 10.1021/jacs.8b06108
F. Ye, Y. Liu, Q.R. Lv, et al., Chin. Chem. Lett. 37 (2026) 111136. doi: 10.1016/j.cclet.2025.111136
X.M. Chen, Y.Y. Wu, Y. Tang, et al., Chin. Chem. Lett. 35 (2024) 109245. doi: 10.1016/j.cclet.2023.109245
X. Huang, M. Song, J. Zhang, et al., Nano Res. 15 (2022) 3927–3932. doi: 10.1007/s12274-021-4057-9
L.L. Wang, X. Lan, W.Y. Peng, Z.H. Wang, J. Hazard. Mater. 408 (2021) 124436. doi: 10.1016/j.jhazmat.2020.124436
P. Chen, E.I. Solomon, Proc. Natl. Acad. Sci. U. S. A. 101 (2004) 13105–13110. doi: 10.1073/pnas.0402114101
N. Mahne, B. Schafzahl, C. Leypold, et al., Nat. Energy 2 (2017) 17036. doi: 10.1038/nenergy.2017.36
F. Xiao, Z.N. Wang, J.Q. Fan, et al., Angew. Chem. Int. Ed. 60 (2021) 10375–10383. doi: 10.1002/anie.202101804
X.M. Xu, Y.M. Zhang, Y. Chen, et al., Proc. Natl. Acad. Sci. U. S. A. 119 (2022) e2205562119. doi: 10.1073/pnas.2205562119
Z.C. Yang, J.S. Qian, A.Q. Yu, B.C. Pan, Proc. Natl. Acad. Sci. U. S. A. 116 (2019) 6659–6664. doi: 10.1073/pnas.1819382116
A.U. Khan, M. Kasha, Proc. Natl. Acad. Sci. U. S. A. 91 (1994) 12365–12367. doi: 10.1073/pnas.91.26.12365
X.F. Feng, R.X. Long, C.C. Liu, Y. Lu, X.B. Liu, Chem. Eng. J. 471 (2023) 144447. doi: 10.1016/j.cej.2023.144447
J.L. Zheng, Q.T. Lin, Y.X. Liu, et al., Chem. Eng. J. 452 (2023) 139233. doi: 10.1016/j.cej.2022.139233
A.V. Mohod, M. Momotko, N.S. Shah, et al., Water Resour. Ind. 30 (2023) 100220. doi: 10.1016/j.wri.2023.100220
S. Li, X.R. Liu, Y.J. Zheng, et al., Chin. Chem. Lett. 35 (2024) 108971. doi: 10.1016/j.cclet.2023.108971
S.Y. Hou, H.L. Hu, Q. Fu, et al., Sep. Purif. Technol. 333 (2024) 125980. doi: 10.1016/j.seppur.2023.125980

Figure 1 (a) Schematic diagram of the preparation of FeSAC-PC@NC. (b) HR-TEM image, (c) HAADF-STEM image and (d) EDS images of FeSAC-PC@NC. (e) The XRD pattern of samples. High resolution XPS spectra of (f) Fe 2p and (g) N 1s.

Figure 2 (a) SMX removal in different systems. (b) Electrochemical impedance curves of samples. (c) LSV curves at 1600 rpm. (d) Electron transfer number (n) and (e) H2O2 selectivity of samples. (f) EPR spectrum of NC. (g) CV curves of FeSAC-PC@NC at different scan rates, and ECSA measurements of samples. (h) H2O2 concentrations of samples.

Figure 3 (a) Degradation and (b) first-order reaction kinetics of SMX removal in FeSAC-PC@NC system. EPR spectra of (c) DMPO-•OH, (d) DMPO-O2•- and (e) TEMP-1O2 in FeSAC@NC and FeSAC-PC@NC system. Fluorescence response of (f) TA upon treatment and (g) SOSG upon treatment in FeSAC@NC and FeSAC-PC@NC system. (h) EPR spectra of TEMP-1O2 in FeSAC-PC@NC system with quencher. (i) The electrochemical in-situ Raman spectra of FeSAC-PC@NC in Na2SO4 solution with pH 3 saturated with O2.

Figure 4 Adsorption of H2O2 on the Fe site of (a) FeSAC@NC and (b) FeSAC-PC@NC surface. (c) The adsorption energy of FeSAC@NC and FeSAC-PC@NC system and (d) the charge density difference. The yellow and blue isosurfaces depict charge accumulation and depletion in the space, respectively.

Figure 5 (a) Possible degradation pathways of SMX. (b) Acute toxicity and (c) chronic toxicity of SMX and the degradation intermediates to three aquatic organisms by ECOSAR program.

Figure 6 (a) Effect of different catalyst dosage, SMX concentration and initial pH on removal efficiency of SMX. (b) Removal efficiencies of SDM, SIZ and TC. (c) The stability test after 5 cycles. (d) The electrocatalytic continuous reaction device and (e) the degradation of Methyl Orange. (f) Scaled-up experimental setup and (g) SMX removal efficiency. (h) Comparison of EEO of several catalytic materials for pollutant removal.

 扫一扫看文章


扫一扫关注我们
 DownLoad:
 下载:
 下载: