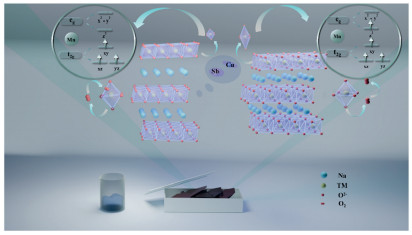
Scheme 1.
Schematic representation of the difference between phase and electronic structures.

Cu/Sb induced minimal lattice distortion for the development of high-performance sodium-ion battery cathode materials
Weijie Yi , Huijun Li , Mingyang Gao , Zirun Chai , Xiaomin Wang


Sodium-ion batteries represent promising candidates for next-generation energy storage systems, owing to the abundant availability of sodium resources and their cost-effectiveness [1,2]. Among the various components of sodium-ion batteries, the cathode material plays a crucial role in determining their performance, and has attracted significant attention from researchers [3-5]. Cathode materials are generally classified into three categories: layered transition metal oxides, polyanionic compounds, and Prussian blue analogues [6]. Among these, layered transition metal oxides are considered the most promising due to their high theoretical capacity and straightforward synthesis, which have garnered significant research interest [7-10]. Ni/Mn layered transition metal oxide materials draw attention due to the substitution of Ni for Mn, which leverages the multivalent nature of Ni (Ni2+/Ni4+) to achieve a higher theoretical specific capacity [11-13]. The phenomenon avoids the Jahn-Teller distortion (The Jahn-Teller effect leads to axial stretching or compression of the crystal structure) caused by high concentration of Mn [14,15]. However, the irreversibility of phase transitions in Ni/Mn-based materials still needs to be addressed [8,16-18]. O3-type Ni/Mn-based layered oxide materials are considered to have wider applicability due to their higher initial capacity compared to P2-type layered oxides [19]. However, as Na+ continues to be released during charging, the O3-type oxides undergo an incomplete reversible phase transition process (O3hex-O’3mon-P3hex-P’3mon-P3’’hex), leading to a rapid decline in capacity [20-22]. Transition metal (TM) interlayer site doping is an effective solution strategy towards problem above. Cu doping is an effective method for enhancing cycling stability [23,24]. Wang et al. found that the successful doping of Cu efficaciously mitigated the Jahn-Teller effect (any nonlinear molecular system in a simple merged electronic state will be unstable and will undergo distortion, which will create a system of lower symmetry and lower energy, thus eliminating the simplicity) (1.5–4.5 V, 168.6 mAh/g at 100 mA/g) [25]. Zhang et al. found that Cu doping cathode achieves the synergistic optimization of the interface and bulk phase (2.0–4.1 V, 114 mAh/g at 0.1 C) [26,27]. Cai et al. found that benefiting from the synergetic effect of Cu-doping and O3 biphasic structure (2.0–4.3 V, 103.76 mAh/g at 24 mAh/g) [28]. Komaba et al. found that the Cu doping provides higher moist- stability (1.5–4.3 V, 176 mAh/g at 0.1 C) [29]. However, the capacity performance of current research on copper-doped layered oxides remains unsatisfactory. To address this, we introduce antimony (Sb) to enhance the capacity and cycling stability of electrode materials. Leng et al. found that the enough space after Sb substitution allows the effective accommodation of Na+ intercalation and destruction (2.0–4.3 V, 147.8 mAh/g at 1 C). Zheng et al. found that the Sb doping can alter the coordination environment and chemical bonds of the TM ions in the structure, resulting in a more stable structure with wider Na+ transport channels (2.0–4.3 V, 212.3 mAh/g at 0.2 C) [30,31]. This improvement is attributed to the 5p completely empty orbital of Sb3+, which facilitates stronger electron attraction and promotes the formation of non-bonded oxygen [31-33]. Therefore, it is crucial to investigate the optimal structure–activity relationship of enhance the capacity and the reversibility of phase transitions [34-36].
Herein, the Cu/Sb co-doped layered oxide material NaNi0.37Mn0.49Cu0.13Sb0.01O2(NNMCS) for sodium-ion battery was successfully prepared using the traditional solid-phase method. We have systematically investigated the effect of Cu/Sb co-doping on both the microcrystalline structure and electrochemical properties of the materials. The results indicate that Cu/Sb co-doping significantly enhances the cycling stability and capacity of the electrode materials. The improvement in electrochemical performance is attributed to the combined effect of Cu/Sb, which regulates the coordination environment of the transition metal sites, leading to reduced lattice changes during cycling and thereby improving structural stability and reversibility. Cu/Sb doping increases Mn4+ concentration through the charge compensation mechanism at transition metal sites, mitigating the negative structural effects of the dual simplicial state eg orbitals in the high-spin Mn3+ state. Meanwhile, the presence of Sb reduces the lattice oxygen ratio, which significantly contributes to the capacity of the electrode material. This work provides valuable insights into the coupling mechanism between capacity and structural stability in sodium-ion batteries.
We prepare electrode materials using conventional processes. O3-Type layered oxide Cu/Sb co-doped NaNi0.37Mn0.49Cu0.13Sb0.01O2 (NNMCS), Cu doped NaNi0.37Mn0.5Cu0.13O2 (NNMC), Sb doped NaNi0.5Mn0.49Sb0.01O2 (NNMS), pristine NaNi0.5Mn0.5O2 (NNM) layered oxides were synthesized by high-energy ball-milling-assisted solid-state reaction. Take the preparation of 0.05 mol of the target products as an example. A stoichiometric amount of the raw materials NiO (aladdin, 99%), MnO2 (aladdin, 99%), CuO (aladdin, 99%), Sb2O3 (aladdin, 99%), and 5 wt% excess Na2CO3 (aladdin, ≥99%) (for compensation of Na loss owing to volatility at high temperature) were put into a 100 mL zirconia ball-milling jar, and 50 zirconia balls with a diameter of 5 mm (ball-to-powder weight ratio of about 2:1) and 70 mL of absolute ethanol were also added into the jar. The ball-milling was carried out in a planetary ball mill (JX-12 G) at a rate of 350 rpm for 6 h. After ball-milling, the mixed precursors were dried at 80 ℃ for 12 h and then calcined in air at 950 ℃ for 15 h with a heating rate of 2 ℃/min. The prepared materials were stored in dryer to avoid deterioration due to air moisture.
To understand the microstructure of the material, we use advanced characterisation instruments to study its internal structure. The crystallographic characteristics was measured by XRD (Rigaku Rint-2000) with Cu Kα radiation (λ = 1.5418 Å) in the 2θ range 5°−90° at the scanning rate of 2°/min. The micro-morphology and elemental distribution of materials were inspected through scanning electron microscopy (SEM, TESCAN Czech), energy dispersive X-ray spectroscopy (EDS) and transmission electron microscope (TEM, JEM2010). X-ray photoelectron spectrometry (Thermofisher ESCALAB QXi X) with the excitation source of Al Kα (1486.6 eV) was used to study the charge compensation mechanism of materials during cycling. Raman spectra were tested using a Renishaw in Va with a 532 nm laser. X-ray Absorption Fine Structure was tested using Table XAFS-500 (Anhui Specreation Instrument Technology Co., Ltd.).
The powder samples were then prepared as electrode materials and assembled into cells. Sodium metal was used as anode electrode and the prepared cathode electrode materials (NNMCS, NNMC, NNMS and NNM) were assembled in CR2025 cell. The cathode material consists of a mixture of 70 wt% powdered active material, 20 wt% conductive carbon black (super-P) and 10 wt% polyvinylidene fluoride (PVDF), the mixed powder was dissolved in n-methyl-2-pyrrolidone (NMP). Finally, the slurry was coated on aluminum foil and dried in the oven at 100 ℃ for 12 h. The load of the cathode plate was controlled at 1.4–1.6 mg/cm2. The half cell was assembled in an argon filled MIKROUNA glove box, the electrolyte was 1 mol/L NaClO4 containing 5% FEC in PC = 100 vol% and 5% EC, the diaphragm was glass fiber-D. The full cell was assembled using a CR2025 cell shell, in which hard carbon was used as the anode electrode, NaClO4 was used as the electrolyte, and the anode pole piece loading was 1.0 mg/cm2. LAND battery testing system was used to the electrochemical performance in the range of 2.0–4.3 V voltage (1 C = 170 mAh/g). VersaStudio battery testing system was used to the multi-sweep cyclic voltammetry (CV) at different sweep speeds of 0.2–1.0 mV/s. VersaStudio battery testing system was used to the impedance of the battery in the range of 100,000–0.01 Hz. The galvanostatic intermittent titration technique (GITT) test uses a charge/discharge step of 2 h and a relaxation step of 30 min.
Scheme 1 clearly illustrated the microstructural differences. The prepared materials were characterized by XRD to determine their crystal structure. The XRD patterns (Fig. 1a), match well with the O3 layered oxide (R-3m space group, PDF #54–0887). The crystal plane peaks for (003) and (104) are shown in Fig. S1 (Supporting information). The increased Na spacing in the NMNCS compared to the NNM provides a wider channel for Na+ migration, which facilitates rapid Na+ de-intercalation during charging/discharging. This is supported by the shift of the (003) and (104) peaks to lower angles. The condition positively affects the diffusion kinetics of the electrode material. Fig. 1b shows the GSAS fitting curve for the NNMCS. The lower values of wR and GOF indicate that the lattice parameters are determined with high accuracy. The fitting curves are based on the schematic structure of the prepared O3-type material, as shown in Fig. 1d. The fitting curves for the remaining samples are presented in Fig. S2 (Supporting information). Fig. 1c shows the lattice parameters for the different samples, highlighting the variation in the a and c values due to the introduction of doping elements [34]. The largest c value of the NNMCS may be attributed to the higher electronegativity of Sb doping, the strong bonding energy of the Sb–O bond, and the enhanced structural stability resulting from the strong covalency between Cu 3d and O 2p orbitals [37,38]. Additionally, the introduction of the two cations may increase the electrostatic repulsion between the laminates, which could be an important factor contributing to the change in layer spacing. Fig. 1e shows the Raman spectra of various samples. It has been shown that layered materials with the R-3m space group exhibit two Raman active modes: A1g and Eg [39,40]. The vibrational peak at 509 cm-1 is associated with Na-O symmetric bending vibrations. The peak at 599 cm-1 is correspond to the symmetric stretching vibrations of the O-Mn-O octahedron [41,42]. The peak at 365 cm-1 can be interpreted as the asymmetric vibration peak which associating with Na-O bond. Figs. S3a and b (Supporting information) represent the local magnification of the Eg and A1g peaks, respectively. The A1g peak of the NNMCS shows a slight shift due to the introduction of dopant elements, indicating a subtle deformation of the octahedral structure in the TM layer after doping.
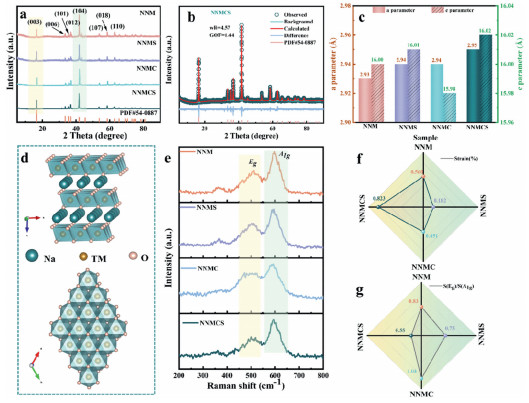
The Raman fitting curves for the samples are shown in Fig. S5 (Supporting information). To enhance the reliability of the calculation results, the peak areas were used as the fitting parameters to calculate the ratio of S(Eg)/S(A1g). The calculated values are presented in the radar plot in Fig. 1g, which clearly demonstrates a significant decrease in the ratio of S(Eg)/S(A1g) following the introduction of Cu/Sb. This suggests a reduction in the distance between the TM layers, consistent with the previously discussed widening of the Na spacing in the NMNCS. The finding also points to the material's excellent rate properties. Interestingly, the NNMC exhibits significant broadening of the Eg peak, which may be attributed to elemental disorder within the octahedral structure or surface adsorption of oxygen [39,43]. To further investigate the microscopic differences in the materials, the XRD profiles obtained from the tests were fitted using Jade software. The R values for each sample were found to be <10%, indicating reliable lattice parameter measurements. Fig. S4 (Supporting information) presents the fitted curves for NNMCS, NNMC, NNMS, and NNM. The microstrain values are illustrated in the radar chart in Fig. 1f. The observed variations in strain values across different samples can be attributed to the Cu/Sb doping. Additionally, the material exhibits microcracks due to the calcination temperature and cooling rate. In this study, the materials are beneficial for inhibiting crack propagation during electrochemical reactions due to their higher initial strain. Since both divalent Cu and trivalent Sb elements are in a positive valence state, their introduction into transition metal sites leads to competition between the metals. The high electronegativity of Sb and the low electronegativity of Mn cause them to be closer together, while Cu and Ni, which have similar electronegativity, also tend to be proximity. This results in increased electrostatic repulsion between the transition metal sites. Therefore, it can be inferred that the increased stress observed in the two-element doped material in this study is due to the greater distance between the transition metals, a result of introducing two elements with positive valence states. Specifically, the initial strain of NNMCS is greater than that of NNM, leading to higher residual stresses (the phenomenon of self-equilibrating internal stresses that persist within an object to the elimination of external forces or inhomogeneous temperature fields has been observed) within the material. This phenomenon may be due to the higher residual stress, which pre-produces finer cracks and consumes the initial stress. As a result, the larger cracks, which were already present, lose their driving force for further expansion. Thus, the process enhances the cyclic stability of the material by preventing the propagation of primary cracks [44-47]. The materials characterization using XPS analysis and SEM images to determine their surface chemical state and morphology. Ni 2p, Mn 2p, Sb 3d, and Cu 2p of NNMCS samples are shown in Fig. 2, while XPS is used to test the rest of the NNMC, NNMS, and NNM samples (Figs. S7-S9 in Supporting information). The presence of Ni, Mn, Cu, Sb, and O have been confirmed in Figs. 2a-d, which demonstrating the successful introduction of Cu, Sb in NNMCS. Fig. 2a clearly displays the Ni 2p peaks, with binding energies of ~854.7 eV and ~856.6 eV designated as Ni2+ and Ni3+, respectively, in the 2p3/2 peaks. Similarly, the binding energies of ~871.9 eV and ~873.8 eV in the 2p1/2 peaks are designated as Ni2+ and Ni3+, respectively [48,49]. Fig. 2b displays the Mn 2p peak, which is split into Mn 2p3/2 and Mn 2p1/2 peaks. The peaks at approximately ~641.7, ~643.2, ~652.9, and ~654.4 eV correspond to Mn3+, Mn4+, Mn3+, and Mn4+, respectively, indicating the coexistence of Mn3+ and Mn4+ on the sample surface [50]. In Fig. 2d, the Cu 2p peaks are shown, with ~933.1 and ~953.3 eV corresponding to Cu2 p3/2 and Cu 2p1/2, respectively [51,52]; Sb 3d5/2 appears as peaks at approximately ~529.3, ~530.8, and ~534.7 eV, Sb 3d3/2 appears as peaks at approximately ~536.0 eV [30,53-55]. Cu/Sb doping leads to an increase in Mn4+ concentration, which results from the charge compensation mechanism at the transition metal sites and alleviates the negative structural effects of the dual-simplicity eg orbitals in the high-spin state of Mn3+. The reduction in the Jahn-Teller effect plays a significant role in enhancing the reversibility of the phase transition. In addition, because Ni3+ reacts with water to form oxygen and Ni2+, Cu/Sb doping modifies the local coordination environment compared to NNM (Fig. S9 in Supporting information), resulting in an increased proportion of Ni2+. This improves water resistance, extends electrode lifespan, and helps mitigate the increase in battery impedance caused by gas generation [30,38,56-58]. Additionally, Fig. S6b (Supporting information) displays the O 1s peak, with lattice oxygen appearing at approximately ~529.1 eV, surface adsorption oxygen at approximately ~531.1 eV, and electrode oxide at approximately ~535.7 eV [59]. Fig. S6a (Supporting information) presents the full-spectrum XPS results of NNMCS, the reversibility of the lattice oxygen reaction is improved by the adsorption of more surface oxygen (Fig. S6b in Supporting information). Both NNMS (Fig. S9 in Supporting information) and NNMCS exhibit lower lattice oxygen ratios compared to NNM (Fig. S9 in Supporting information), suggesting that Sb promotes the lattice oxygen reaction and contributes additional capacity to the electrode materials. This effect may arise from the complete cavitation of Sb 5p and its stronger electron affinity, or from the tendency of Sb₂O₃ and Na to form Na-Sb compounds, both of which phenomena favor the formation of non-bonded oxygen [32]. Figs. 2e and f display SEM maps of NNMCS at different resolutions, respectively [31]. Figs. 2g-l show the localized EDS mapping of the material, while the remaining figures (NNMC, NNMS, NNM samples) are presented in Figs. S10-S12 (Supporting information). The figure demonstrates the approximate hexagonal layered structure of each sample, indicating excellent crystallinity. The EDS characterization of its microscopic region confirms the uniform distribution, providing evidence of successful introduction of dopant elements. The TEM characterization results of NNMCS are shown in Figs. 2m-o, respectively. The lattice stripe spacing was calculated, and the O3 layered (003) lattice spacing is as expected.
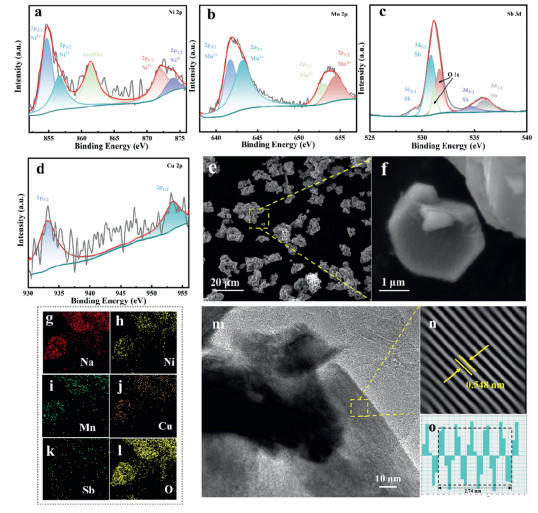
Fig. 3a presents the CV curves of NNMCS, providing detailed electrochemical information on the charge/discharge process. The voltage range of 2.0–3.0 V is corresponded to the Mn3+/Mn4+ redox pair, while the voltage range of 3.3–3.6 V is related to the Cu2+/Cu3+ redox reaction [52]. The oxidation peak above 4.0 V is attributed to the lattice oxygen reaction, while the reduction peak above 4.0 V in the second cycle is due to the incomplete reversibility of the sample's reaction. The CV curves for the remaining samples are presented in Fig. S22 (Supporting information). Among these, the NNMS sample exhibits a significant peak current at the oxidation peak above 4.0 V, which further supports the involvement of Sb in enhancing lattice oxygen activity [60,61]. To determine the electrochemical reaction process of the material, the voltage-time curve of NNMCS (Fig. 3b), was analyzed. The voltage drop between 2.5 V and 3.0 V at the beginning of the charging process is associated with the formation of the electrolyte interface. The voltage-time curves for the remaining samples are presented in Fig. S13 (Supporting information). Upon examination of these curves, it is evident that the fluctuations in the other samples are more pronounced compared to NNMCS. This observation may indirectly suggest that NNMCS exhibits a higher particle transport rate during the formation of the electrolyte interface [5,62-66]. Fig. 3c displays the charge/discharge curves of NNMCS within the voltage range of 2.0–4.3 V at a rate of 0.1 C. The curves suggest that the electrochemical process follows an O3-dominated phase transition mechanism [29]. Notably, the discharge capacity in the first cycle reaches an impressive 188 mAh/g. The first cycle charging curve shows a longer charging plateau above 4.0 V, which corresponds to the capacity released from the lattice oxygen reaction [67]. NNMCS, NNMC, and NNMS exhibit smoother charging curves below 4.0 V than NNM. Furthermore, the voltage plateau in the medium-voltage region reflects the lattice distortion associated with the phase transition from O3 to P3 [67]. The figure indicates that the introduction of two metal elements effectively smooths the medium-voltage plateau, which signifies improved reaction kinetics [60]. It is worth mentioning that the NNMS material exhibits a longer high-voltage charging plateau, indicating that Sb promotes the oxygen reaction. The introduction of Cu into the material increases the redox potential and strengthens orbital hybridization, resulting in improved stability compared to the non-doped material, which enhances the cyclic stability. Fig. S14 (Supporting information) illustrates the charge-discharge curves of different samples at 1 C. The figure clearly demonstrates that the charge/discharge curves of the NNMCS samples exhibit a greater degree of overlap, further confirming the superior structural stability of NNMCS during high-current cycling. The lattice oxygen activity has been promoted, as evidenced by the charge/discharge and CV curves, which are consistent with the conclusions drawn from the XPS analysis [68]. As shown in Fig. 3c, the capacity loss observed during the first charge/discharge cycle of the experimental sample NNMCS is 9.45 mAh/g, whereas the sample NNM exhibits a significantly higher capacity loss of 31.38 mAh/g. This disparity can be attributed to an enhancement in the lattice oxygen reversibility of the NNMCS sample, which subsequently results in a reduced capacity loss during the discharge process. Fig. 3d illustrates the dQ/dV curves over 50 cycles. A clear comparison reveals that the curves for NNMCS exhibit a high degree of overlap, indicating a more stable electrochemical reaction and an enhanced electron transport rate. Furthermore, the dQ/dV curves of the experimental group samples (NNMCS) exhibit a high degree of overlap above 4 V, with minimal fluctuations. In contrast, the dQ/dV curves of the control group samples (NNM) display more pronounced fluctuations. Additionally, during the electrochemical reduction process, the curves of the NNMCS samples show greater overlap, further supporting the reversibility of lattice oxygen.
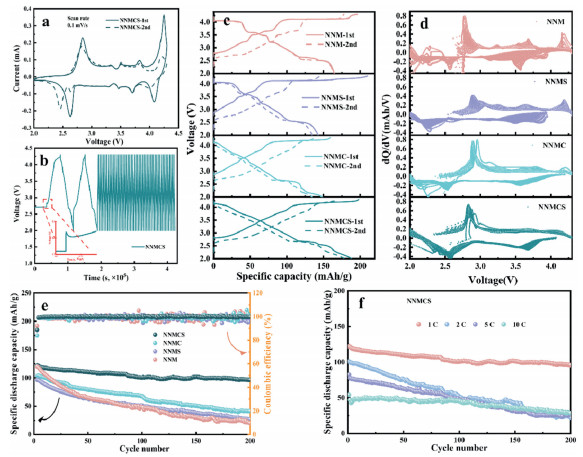
Fig. 3e demonstrates that NNMCS exhibits superior cyclic stability, with a capacity retention of 78% at 1 C after 200 cycles. The charge/discharge curves of different samples with different number of cycles at 1 C are shown in Fig. S14 (Supporting information). The efficiency curves further confirm the stable performance of NNMCS throughout the electrochemical process. This outstanding performance can be attributed to two factors: first, the modulation of the local electrochemical environment by the dopant elements, and second, the expansion of sodium ion transport channels. These conclusions are supported by the data presented in the article. Fig. 3f displays the cyclic performance of NNMCS at different current densities, highlighting its superior performance compared to other materials at 1 C.
The kinetic properties of the electrode material were investigated. The cyclic voltammetry (CV) curves of NNMCS are shown in Fig. S15a (Supporting information), with those of the other three samples presented in Fig. S16 (Supporting information). The figure reveals a gradual increase in peak current with increasing scan rate. NNMCS exhibits higher peak currents than the other samples at the same voltage and scan rate. The oxidation peak consistently shifts towards the positive direction, while the reduction peak shifts towards the negative direction, suggesting that the potential change is primarily due to ohmic polarization (also known as resistive polarization, it is a phenomenon that occurs in electrochemical systems due to the resistance of the electrolyte to the flow of current). This phenomenon occurs because the uneven distribution of drop voltage and current density, caused by ohmic polarization, leads to a change in the current response. As the scan rate increases, this effect becomes more pronounced, resulting in a more significant distortion of the CV curve shape [62]. Fig. S15b (Supporting information) shows that the slope of the linear fit line indicates the dominant electrochemical reaction process. The oxidation peaks exhibit slope values close to 1, indicating that pseudocapacitance (Pseudocapacitance, also known as Faraday quasi-capacitance, is the underpotential deposition of an electroactive substance on the surface of an electrode or in a two-dimensional or quasi-two-dimensional space in the bulk phase, where highly reversible chemical adsorption, desorption, or oxidation and reduction reactions take place, resulting in capacitance related to the electrode's charging potential) plays a dominant role in the electrochemical reaction, with a larger slope compared to the other samples (Fig. S17 in Supporting information). This behavior suggests a faster electrochemical reaction, which correlates with improved rate performance [69,70]. The pseudocapacitance contributions of each sample were calculated (Fig. S15c in Supporting information). NNMCS exhibits a significantly higher pseudocapacitance contribution compared to the other materials, which is consistent with its faster electron transfer rate. The pseudocapacitance contribution increases gradually with the scan rate, which can be attributed to the combination of shifts in peak positions and the increase in peak currents observed in the multi-scan CV curves. These findings provide further evidence of the faster electrochemical reaction rate of NNMCS. Fig. S15d (Supporting information) illustrates the rate performance of different samples. NNMCS maintains a high reversible capacity of 120 mAh/g across a range of current densities. Additionally, it retains 91% of its capacity after continuous cycling at 0.2 C, demonstrating superior stability.
The fitted impedance curves for the various samples are shown in Fig. S15e (Supporting information), while the corresponding equivalent circuit diagrams are provided in Fig. S19 (Supporting information). The smaller radius of the semicircle in the high-frequency region for NNMCS indicates its lower intrinsic electrochemical resistance. Additionally, the reaction in this region does not lead to significant concentration polarization at high frequencies, and the surface state remains relatively stable. NNMCS also demonstrates a fast diffusion rate during the diffusion-controlled process, as evidenced by the steeper slope observed in the low-frequency region [18]. Additionally, in Fig. S15f (Supporting information), NNMCS exhibits a significantly higher rate of electrochemical reaction, as evidenced by the smaller radius of the semicircular pattern in the high-frequency region of the post-cycling impedance plots compared to the pre-cycling plots. The high-frequency value corresponds to the sample's eigenfrequency, and the inverse of the eigenfrequency represents the time constant. The time constant of NNMCS outperforms that of the other samples, indicating its superior kinetic performance [71]. To further investigate the diffusion kinetics among different samples, we conducted GITT tests and calculated the Na+ diffusion coefficients (Fig. S18 in Supporting information). It is evident that all NNMCS samples exhibit higher Na+ diffusion coefficients during both charging and discharging, a finding consistent with the previous discussion.
To investigate the structural changes occurring during charging and discharging, ex situ XRD measurements were conducted on NNMCS at various potentials (Fig. S20a in Supporting information). During charging to 4.0 V, the (003) peak consistently shifts to a smaller angle, indicating the expansion of the Na layer spacing due to the de-intercalation of interlayer Na+. The process follows an O3hex-O’3mon-P3hex process. Additionally, the (104) peak weakens and splits upon charging to 3.0 V, indicating the formation of the O’3mon phase, which coexists with the O3hex and O’3mon phases. The (003) peak undergoes a significant shift when charged to 4.3 V, indicating an increase in the spacing of the Na+ layers. Upon discharging to 4.0 V, the material recovers to the P3 phase with excellent recovery of the peak position, remaining highly crystalline. This suggests a high degree of reversibility in the phase transition process. The X-ray diffraction (XRD) patterns obtained during discharge to 4.0 V exhibit a high degree of similarity with those recorded during charge to 4.0 V. This observation may also suggest the reversibility of lattice oxygen. Specifically, the electrochemical processes occurring above 4.0 V predominantly involve lattice oxygen reactions. Moreover, the restoration of the phase structure throughout the charging and discharging cycles provides robust evidence supporting the reversibility of lattice oxygen. Fig. S20b (Supporting information) illustrates the structural changes of the electrode materials. The O3-P3 phase transition is generally associated with the voltage range of 2.0–4.0 V, while the P3-P3” transition occurs within the voltage range of 4.0–4.3 V [60,67].
Additionally, the rate of change in the lattice parameters is calculated using XRD Rietveld analysis fitting (Fig. S20d in Supporting information). Detailed lattice parameter data are shown in Table S1 (Supporting information). The current study focuses primarily on the variation of the c-values, we also discuss the variation in the remaining lattice parameters, which have often been overlooked in previous studies. The figure clearly shows a significant reduction in these parameters, suggesting that the NNMCS structure experiences less damage during the cyclic process. Therefore, it can be concluded that Cu/Sb doping effectively enhances the reversibility of the phase transition and improves the Na+ transport rate. This improvement is attributed to the modification of the local electrochemical environment by the dopant elements. Moreover, the smaller changes in density and strain indicate that the presence of appropriate residual strain within the material plays a crucial role. Additionally, the small rate of change in volume contributes to superior cycling stability and enhanced rate performance. As shown in Fig. S20d, the volume change rate of the experimental NNMCS sample after cycling is 0.16%, which is significantly lower than that of the control NNM sample, at 1.58%. This observation further supports the reversibility of the lattice oxygen reaction. The lattice oxygen reaction process generates number of vacancies and an excess of vacancies can adversely affect structural stability. However, the high reversibility of the lattice oxygen reaction helps to fill some of these vacancies, stabilizing the lattice structure. Therefore, the small volume change rate serves as an indication of the reversibility of the lattice oxygen. Subsequently, by comparing the properties of NNMCS with those reported in the literature (where voltage and current densities are selected for specific values within the voltage range), as shown in Fig. S20c (Supporting information), this work demonstrates a high initial capacity, confirming that the dopant elements introduced here contribute effectively [1,58,72-83]. The details of the performance are presented in Fig. S21 (Supporting information).
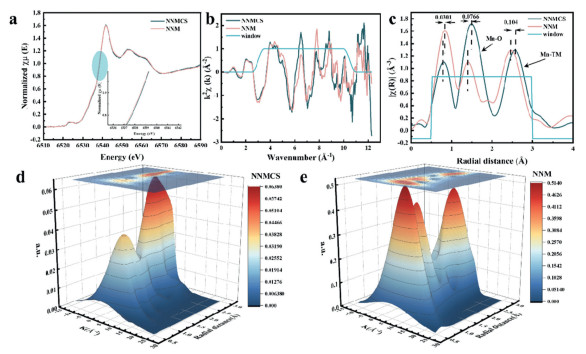
To further investigate the local chemical environment of the structure, X-ray absorption fine structure (XAFS) measurements were performed on the samples. The normalized XAFS curves of the samples are shown in Fig. 4a. The slight shift of the normalized NNMCS curve towards higher energies indicates an increase in the average valence state of Mn, a conclusion that is consistent with the results obtained from XPS analysis. The K-space data presented in Fig. 4b confirms the high quality of the data obtained. The R-space data in Fig. 4c, derived from the Fourier transform of the K-space data, reveals a clear elongation of both the Mn-O and Mn-TM distances in NNMCS compared to NNM. Some weak peaks in long range (longer than 3.5 Å) arise from the further atoms scattering, and the other peaks in short range (shorter than 0.5 Å) originate from the incomplete Fourier transform due to the restricted k space in a real sample. However, it is important to note that this observation reflects a change in the distance between Mn and TM rather than a definitive change in bond length. The elongation of the Mn-TM distance can be attributed to the introduction of dopant elements, which disrupt the local coordination environment. Additionally, the increased intensity of the peaks may be indicative of the formation of locally ordered structures. This locally ordered structure could contribute to the observed increase in the Mn-TM distance. The elongation of the Mn-O distance in NNMCS is likely due to the increased electron cloud density at the transition metal sites, resulting from the introduction of highly covalent Cu and highly electronegative Sb. This change enhances the electron shielding effect, which in turn increases the Mn-O distance. The increased distance between the transition metal sites indirectly promotes flexibility during transition metal migration, resulting in electrode materials with a smaller rate of lattice parameter change during cycling and ultimately enhancing phase transition reversibility. Furthermore, the increased interatomic distance leads to an expansion of the lattice parameter, which induces tensile strain in the lattice. This strain may promote the activity of the lattice oxygen, ultimately contributing to an additional reversible capacity, a conclusion consistent with the earlier discussion of lattice oxygen behavior. Wavelet transform plots in Figs. 4d and e further support these findings. They show that the Mn-O peak in NNMCS does not shift along the high-K direction, indicating a minimal lattice shrinkage. This is one of the factors contributing to the lower rate of change in lattice parameters observed after cycling [84-93].
We have supplemented our tests with full cell performance data (Fig. S23 in Supporting information). Fig. S23a illustrates the structure and reaction process of the full cell. Fig. S23b shows that NNMCS exhibits better specific capacity retention than NNM (89.3% vs. 86.7%). Additionally, Fig. S23b demonstrates that the initial capacity of NNMCS is higher than that of NNM (126.5 mAh/g vs. 104.6 mAh/g), with a smoother charge/discharge profile.
Cu/Sb co-doped materials, were synthesized via the solid-phase method. The NNMCS demonstrates excellent cycling stability with a capacity retention of 78.6% after 200 cycles at 1 C within a 2.0–4.3 V voltage window, and a high initial specific capacity of 188 mAh/g at 0.1 C. The rate performance reveals a reversible capacity of 120.7 mAh/g at 0.2 C. We have investigated the microscopic coordination environments of the materials and lattice parameter variations using tools such as XRD, XRD Rietveld, XPS, and XAFS. The results show that Cu/Sb doping influences the chemical coordination environment by increasing the distance between transition metals and decreasing the lattice oxygen ratio, ultimately leading to a minimal rate of change in the lattice parameter and a higher initial capacity. These findings reveal an electrode material with great cycling stability and high capacity, contributing to a deeper understanding of the coupling mechanism between capacity and structural stability in sodium-ion battery cathode materials.
All the authors declare that they have no known competing financial interests or personal relationships that could have appeared to influence the work reported in this paper.
Weijie Yi: Writing – review & editing, Writing – original draft, Supervision, Software, Methodology, Investigation, Conceptualization. Huijun Li: Software, Data curation. Mingyang Gao: Software. Zirun Chai: Software, Investigation. Xiaomin Wang: Supervision, Funding acquisition.
The authors appreciate the support from National Natural Science Foundation of China (Nos. 52072256, 52301282), Key R&D Program of Shanxi Province (Nos. 202102030201006, 202202070301016), Central Guide Local Science and Technology Development Funding Program (No. YDZJSX2021B005), Science and Technology Innovation Base Construction Project of Shanxi Province (No. YDZJSX2022B003), Shanxi Province Science Foundation for Youths (Nos. 20210302124308, 202303021212044, 202303021212047), Shanxi Province Teaching Reform Project (No. 2021YJJG046).
Supplementary material associated with this article can be found, in the online version, at doi:
D. Zhou, D. Ning, J. Wang, et al., J. Energy Chem. 77 (2023) 479–486. doi: 10.1016/j.jechem.2022.11.031
R. Yin, Z. Guo, R. Liu, et al., Chin. Chem. Lett. 36 (2025) 109643. doi: 10.1016/j.cclet.2024.109643
D. Yuan, X. Hu, J. Qian, et al., Electrochim. Acta 116 (2014) 300–305. doi: 10.1016/j.electacta.2013.10.211
B. Mortemard de Boisse, D. Carlier, M. Guignard, et al., Inorg. Chem. 53 (2014) 11197–11205. doi: 10.1021/ic5017802
C. Xu, K. Zhang, D. Zhang, et al., Nano Energy 68 (2020) 104318. doi: 10.1016/j.nanoen.2019.104318
X. Dong, X. Wang, Z. Lu, et al., Chin. Chem. Lett. 35 (2024) 108605. doi: 10.1016/j.cclet.2023.108605
W. Zuo, Y. Yang, Acc. Mater. Res. 3 (2022) 709–720. doi: 10.1021/accountsmr.2c00058
F. Zan, Y. Yao, S.V. Savilov, et al., Funct. Mater. Lett. 13 (2020) 2051016. doi: 10.1142/s1793604720510169
W. Li, Z. Zhao, J. Zhao, et al., J. Mater. Sci. Technol. 194 (2024) 236–246. doi: 10.1016/j.jmst.2023.12.077
R. Niu, J. Ding, J. Chen, et al., J. Colloid Interf. Sci. 678 (2024) 741–749.
S. Zhao, Q. Shi, W. Feng, et al., Chin. Chem. Lett. 35 (2024) 108606. doi: 10.1016/j.cclet.2023.108606
Z. Yao, Y. Kang, M. Hou, et al., Adv. Funct. Mater. 32 (2022) 2111919. doi: 10.1002/adfm.202111919
X. Yang, F. Su, M. Hou, et al., Dalton Trans. 50 (2021) 7041–7047. doi: 10.1039/d1dt00807b
J. Zhou, J. Liu, Y. Li, et al., J. Colloid Interf. Sci. 638 (2023) 758–767. doi: 10.1016/j.jcis.2023.02.001
Y. Zhou, M. Sun, M. Cao, et al., J. Colloid Interf. Sci. 657 (2024) 472–481. doi: 10.1016/j.jcis.2023.12.008
P.F. Wang, Y. You, Y.X. Yin, et al., Adv. Energy Mater. 8 (2018) 1701912. doi: 10.1002/aenm.201701912
C. Delmas, J.J. Braconnier, C. Fouassier, et al., Solid State Ionics 3-4 (1981) 165–169. doi: 10.1016/0167-2738(81)90076-X
A.R.C. Bredar, A.L. Chown, A.R. Burton, et al., ACS Appl. Energy Mater. 3 (2020) 66–98. doi: 10.1021/acsaem.9b01965
G. Yang, S. Yang, J. Yu, et al., Chin. Chem. Lett. 35 (2024) 109722. doi: 10.1016/j.cclet.2024.109722
S. Zhao, X. Yu, Y. Zhao, Chin. Chem. Lett. 35 (2024) 109933. doi: 10.1016/j.cclet.2024.109933
P.F. Wang, Y. You, Y.X. Yin, et al., Angew. Chem. Int. Ed. 55 (2016) 7445–7449. doi: 10.1002/anie.201602202
S. Komaba, N. Yabuuchi, T. Nakayama, et al., Inorg. Chem. 51 (2012) 6211–6220. doi: 10.1021/ic300357d
X. Peng, H. Zhang, C. Yang, et al., J. Colloid Interf. Sci. 659 (2024) 422–431. doi: 10.1016/j.jcis.2023.12.170
H.L. Dou, Z.X. Zhao, S.B. Yang, et al., New Carbon Mater. 38 (2023) 599–618. doi: 10.1016/S1872-5805(23)60762-0
X. Zhou, X. Huang, Y. Cui, et al., ACS Appl. Mater. Interfaces 16 (2024) 36354–36362. doi: 10.1021/acsami.4c05516
J.L. Wang, L.R. Wu, H.X. Zhang, et al., Chemistry 29 (2023) e202301014. doi: 10.1002/chem.202301014
Q. Shen, X. Zhao, Y. Liu, et al., Adv. Sci. 7 (2020) 2002199. doi: 10.1002/advs.202002199
Z. Zhang, Y. Liu, Z. Liu, et al., J. Power Sourc. 567 (2023) 232930. doi: 10.1016/j.jpowsour.2023.232930
Y. Yoda, K. Kubota, K. Kuroki, et al., Small 16 (2020) e2006483. doi: 10.1002/smll.202006483
M. Leng, C. Xia, Z. Zhou, et al., Electrochim. Acta 441 (2023) 141867. doi: 10.1016/j.electacta.2023.141867
T. Yuan, S. Li, Y. Sun, et al., ACS Nano 16 (2022) 18058–18070. doi: 10.1021/acsnano.2c04702
Z. Liu, T. Song, U. Paik, J. Mater. Chem. A 6 (2018) 8159–8193. doi: 10.1039/c8ta01782d
H. Li, X. Cheng, J. Zhao, et al., J. Alloy. Compd. 1010 (2025) 178237. doi: 10.1016/j.jallcom.2024.178237
X.G. Yuan, Y.J. Guo, L. Gan, et al., Adv. Funct. Mater. 32 (2022) 2111466. doi: 10.1002/adfm.202111466
Y. Zhang, G. Liu, C. Su, et al., J. Power Sourc. 536 (2022) 231511. doi: 10.1016/j.jpowsour.2022.231511
J. Chen, Z. Zhao, R. Niu, et al., J. Power Sourc. 621 (2024) 235240. doi: 10.1016/j.jpowsour.2024.235240
T. Yuan, S. Li, Y. Sun, et al., ACS Nano 16 (2022) 18058–18070. doi: 10.1021/acsnano.2c04702
Y. Jin, Y. Peng, Y. Li, et al., Chem. Engin. J. 495 (2024) 152788. doi: 10.1016/j.cej.2024.152788
C. Venkateswara Rao, J. Soler, R. Katiyar, et al., J. Phys. Chem. C 118 (2014) 14133–14141. doi: 10.1021/jp501777v
P. Kalyani, N. Kalaiselvi, Sci. Technol. Adv. Mater. 6 (2005) 689–703. doi: 10.1016/j.stam.2005.06.001
T. Gao, H. Fjellvåg, P. Norby, Anal. Chim. Acta 648 (2009) 235–239. doi: 10.1016/j.aca.2009.06.059
L. Malavasi, P. Galinetto, M.C. Mozzati, et al., Phys. Chem. Chem. Phys. 4 (2002) 3876–3880. doi: 10.1039/b203520k
X.B. Zhong, C. He, F. Gao, et al., J. Energy Chem. 53 (2021) 323–328. doi: 10.1109/ecce47101.2021.9595568
R.J. Jacob, K.J. Hill, Y. Yang, et al., Combustion Flame 205 (2019) 33–40. doi: 10.1016/j.combustflame.2019.03.024
K. Wu, Y. Song, X. Zhang, et al., Adv. Sci. 9 (2022) 2104867. doi: 10.1002/advs.202104867
R. Xue, X. Li, H. Zhao, et al., Engin. Fract. Mech. 269 (2022) 108518. doi: 10.1016/j.engfracmech.2022.108518
V.H. Dao, H.S. Yun, P. Jaeyeong, et al., Engin. Fracture Mech. 296 (2024) 109820. doi: 10.1016/j.engfracmech.2023.109820
T.T. Wei, X. Liu, S.J. Yang, et al., J. Energy Chem. 80 (2023) 603–613. doi: 10.1016/j.jechem.2023.02.016
X. Hu, S. Liang, J. Lin, et al., Adv. Energy Mater. 15 (2025) 2404965. doi: 10.1002/aenm.202404965
Y. Zhang, G. Liu, C. Su, et al., J. Power Sourc. 536 (2022) 231511. doi: 10.1016/j.jpowsour.2022.231511
L. Yang, S.H. Luo, Y. Wang, et al., Chem. Engin. J. 404 (2021) 126578. doi: 10.1016/j.cej.2020.126578
Y.M. Zheng, X.B. Huang, X.M. Meng, et al., ACS Appl. Mater. Interfac. 13 (2021) 45528–45537. doi: 10.1021/acsami.1c12684
L. Guo, S. Vafakhah, M. Ding, et al., Mater. Today Energy 16 (2020) 100403. doi: 10.1016/j.mtener.2020.100403
H. Hu, H. Chen, S. Xu, et al., ACS Appl. Energy Mater. 7 (2024) 7397–7408. doi: 10.1021/acsaem.4c01617
Q. Mao, Y. Jia, W. Zhu, et al., J. Solid State Electrochem. 27 (2023) 1433–1441. doi: 10.1007/s10008-023-05483-0
H.J. Kim, N. Voronina, K. Köster, et al., Energy Storage Mater. 66 (2024) 103224. doi: 10.1016/j.ensm.2024.103224
M. Li, H. Zhuo, M. Song, et al., Nano Energy 123 (2024) 109375. doi: 10.1016/j.nanoen.2024.109375
T. Li, M. Lu, Y. Zhang, et al., J. Alloy. Compd. 978 (2024) 173459. doi: 10.1016/j.jallcom.2024.173459
J. Liu, B. Pei, Q. Su, et al., J. Power Sourc. 580 (2023) 233435. doi: 10.1016/j.jpowsour.2023.233435
H. Zhu, Z. Yao, H. Zhu, et al., Adv. Sci. 9 (2022) 2200498. doi: 10.1002/advs.202200498
S.B. Wei, Y.J. He, Y. Tang, et al., Rare. Metals 43 (2024) 5701–5711. doi: 10.1007/s12598-024-02819-1
W. Xu, M. Deng, D. Snihirova, et al., J. Magn. Alloy. 12 (2024) 1854–1866. doi: 10.1016/j.jma.2024.02.011
T. Zhang, H. Ji, X. Hou, et al., Nano Energy 100 (2022) 107482. doi: 10.1016/j.nanoen.2022.107482
F. Li, M. Hou, L. Zhao, et al., Energy Storage Mater. 65 (2024) 103181. doi: 10.1016/j.ensm.2024.103181
F. Li, K. Ren, M. Hou, et al., ACS Energy Lett. 10 (2024) 195–204.
Y. Zhou, X. Yang, M. Hou, et al., J. Colloid Interf. Sci. 667 (2024) 64–72. doi: 10.1055/a-2250-6941
D.D. Yuan, Y.X. Wang, Y.L. Cao, et al., ACS Appl. Mater. Interfaces 7 (2015) 8585–8591. doi: 10.1021/acsami.5b00594
C. Cheng, H. Hu, C. Yuan, et al., Energy Storage Mater. 52 (2022) 10–18. doi: 10.1016/j.ensm.2022.07.030
M. Huang, X. Wang, J. Meng, et al., Nano Energy, 77 (2020) 105069. doi: 10.1016/j.nanoen.2020.105069
X. Pu, D. Zhao, C. Fu, et al., Angew. Chem. Int. Ed. 60 (2021) 21310–21318. doi: 10.1002/anie.202104167
R.U. Atangulov, I.V. Murygin, Solid State Ionics, 67 (1993) 9–15. doi: 10.1016/0167-2738(93)90302-J
J. Xu, H. Liu, Y.S. Meng, Electrochem. Commun. 60 (2015) 13–16. doi: 10.1016/j.elecom.2015.07.023
J. Feng, S.H. Luo, Y. Dou, et al., J. Electroanal. Chem. 914 (2022) 116301. doi: 10.1016/j.jelechem.2022.116301
C. Zhou, L. Yang, C. Zhou, et al., J. Energy Chem. 60 (2021) 341–350. doi: 10.1016/j.jechem.2021.01.038
T.Y. Yu, J.Y. Hwang, I.T. Bae, et al., J. Power Sources 422 (2019) 1–8. doi: 10.1155/2019/3901572
T.Y. Yu, J. Kim, G. Oh, et al., Energy Storage Mater. 61 (2023) 102908. doi: 10.1016/j.ensm.2023.102908
Q. Zhang, Z. Wang, X. Li, et al., Chem. Engin. J. 431 (2022) 133456. doi: 10.1016/j.cej.2021.133456
Y. Huang, Y. Zhang, G. Yuan, et al., Appl. Surf. Sci. 653 (2024) 159395. doi: 10.1016/j.apsusc.2024.159395
X. Li, D. Wu, Y.N. Zhou, et al., Electrochem. Commun. 49 (2014) 51–54. doi: 10.1016/j.elecom.2014.10.003
J. Zheng, Z. Wang, S. Zhang, et al., Solid State Ion. 399 (2023) 116305. doi: 10.1016/j.ssi.2023.116305
N.V. Nghia, P.W. Ou, I.M. Hung, Ceram. Int. 41 (2015) 10199–10207. doi: 10.1016/j.ceramint.2015.04.126
H. Xu, J. Zong, S. Chen, et al., Ceram. Int. 42 (2016) 12521–12524. doi: 10.1016/j.ceramint.2016.04.141
L. Tan, Q. Wu, Z. Liu, et al., J. Colloid Interf. Sci. 622 (2022) 1037–1044. doi: 10.1016/j.jcis.2022.04.112
C. Chen, C. Zhao, H. Liu, et al., ACS Nano 17 (2023) 11406–11413. doi: 10.1021/acsnano.3c00913
B. Li, K. Kumar, I. Roy, et al., Nat. Mater. 21 (2022) 1165–1174. doi: 10.1038/s41563-022-01278-2
X. Li, Q. Gu, B. Qiu, et al., Mater. Today 61 (2022) 91–103. doi: 10.1016/j.mattod.2022.09.013
Y. Li, M.J. Zuba, S. Bai, et al., Energy Storage Mater. 35 (2021) 99–107. doi: 10.1016/j.ensm.2020.11.013
P. Liu, W. He, Q. Xie, et al., J. Phys. Chem. Lett. 10 (2019) 2202–2207. doi: 10.1021/acs.jpclett.9b00419
K.W. Nam, S.M. Bak, E. Hu, et al., Adv. Funct. Mater. 23 (2012) 1047–1063.
H. Ren, W. Zhao, H. Yi, et al., Adv. Funct. Mater. 33 (2023) 2302622. doi: 10.1002/adfm.202302622
N. Yabuuchi, Chem. Rec. 19 (2019) 690–707. doi: 10.1002/tcr.201800089
H. Yang, D. Wang, Y. Liu, et al., Energy Environ. Sci. 17 (2024) 1756–1780. doi: 10.1039/d3ee02934d
H. Zhu, Z. Yao, H. Zhu, et al., Adv. Sci. 9 (2022) e2200498. doi: 10.1002/advs.202200498

Scheme 1 Schematic representation of the difference between phase and electronic structures.

Figure 1 (a) X-ray diffraction patterns of different samples. (b) GSAS fitted curves of NNMCS. (c) lattice parameter histogram. (d) O3 layered oxide crystal structure schematic. (e) Raman curves of different samples. (f) Strain radar chart. (g) S(Eg)/S(A1g) radar chart.

Figure 2 XPS of NNMCS: (a) Ni 2p; (b) Mn 2p; (c) Sb 3d; (d) Cu 2p. (e) SEM of NNMCS. (f) SEM of NNMCS. (g-l) EDS of NNMCS. (m) TEM of NNMCS. (n) Lattice fringe. (o) Calculation diagram of lattice fringe distance.

Figure 3 (a) CV curves for two cycles. (b) Voltage-time curve of NNMCS. (c) Charging and discharging curves of two cycles. (d) dQ/dV curves of 50 cycles. (e) Curves of 200 cycles of different samples at 1 C between 2.0–4.3 V. (f) Different current density of curves of NNMCS.

 扫一扫看文章


扫一扫关注我们
 DownLoad:
 下载:
下载:

 下载:
下载: