Received Date:
24 October 2023 Accepted Date:
27 November 2023 Revised Date:
15 November 2023 Available Online:
15 October 2024
Abstract:
Since the appearance of Rochelle salt, ferroelectrics have received extensive attention from researchers due to they are playing an important role in sensors, memories, mechanical actuation, and so on. In recent years, with the rapid development of molecular ferroelectrics, high-performance molecular ferroelectrics have become effective complement to inorganic ferroelectrics. However, compared with inorganic ferroelectrics, the family of molecular ferroelectrics is relatively scarce, and exploring high-performance ferroelectric materials through new synthesis strategies has become the trend of molecular ferroelectrics. Here, we successfully transformed non-polar material 1 (2-H2PCA)2(H2O)CdCl6 (2-H2PCA = 2-picolylamine cation) into polar material 2 (2-H2PCA)2CdCl6 by single-crystal to single-crystal transformation (SCSCT). Meanwhile, 2 exhibits clear ferroelectricity with a high-temperature Tc of 378 K, a Ps of 1.18 µC/cm2 at 300 K. This work not only realizes the purpose of synthesizing ferroelectrics by forming polar structures by SCSCT, but also realizes the reversibility of SCSCT, which provides ideas for the construction and exploration of new molecular ferroelectrics.
Since the ferroelectricity of Rochelle salt was reported, ferroelectrics have received extensive attention from researchers due to their property to switch the direction of spontaneous polarization under external electric fields [1,2]. In the development of the past century, a large number of ferroelectrics have been found in materials such as inorganic ceramics, organic crystals, and organic-inorganic hybrid crystals [3–10]. High-performance ferroelectrics play an important role in sensors, memories, mechanical actuation, and so on [11–15]. In recent years, molecular-based ferroelectrics have developed rapidly due to their advantages of structural diversity and/or tunability, low toxicity and light weight [12,16–20]. High-performance molecular-based ferroelectrics are also expected to be an effective complement to inorganic ferroelectrics [21–26]. For example, the molecular-based ferroelectric [Me3NCH2Cl]CdCl3 crystal shows a high piezoelectric coefficient of 220 pC/N, which is comparable to inorganic ferroelectrics such as Pb(Zr, Ti)O3 (265 pC/N), BaTiO3 (190 pC/N) [24]. However, compared with inorganic ferroelectrics, the family of molecular-based ferroelectrics is relatively scarce, and the discovery of new molecular-based ferroelectrics has become an urgent requirement [16].
Thanks to the structural tunability of molecular ferroelectrics, modifications on spherical molecules, the introduction of homochirality, and H/F substitution have been validated as effective chemical design approaches [27–31]. In the field of piezoelectric, a high piezoelectric response is achieved through the strategy of ring enlargement [32]. Furthermore, the photomodulation of spontaneous polarization has been achieved in ferroelectric liquid crystals and organic ferroelectric compounds by photochemical processes, such as cis−trans, and open/closed-ring isomerization [33–38]. Exploring high-performance ferroelectric materials through new synthesis strategies has become the trend of molecular ferroelectrics.
Single-crystal to single-crystal transformation material is a material that undergoes structural changes when one or more components are lost, and is accompanied by changes in physical/chemical properties [39–42]. Single-crystal to single-crystal transformation (SCSCT) as a method of chemical regulation has an important influence in symmetry breaking, photochromism, spin-crossover, multifunctional materials and other fields. [39,43–48]. Although SCSCT materials have been extensively explored, they struggle to maintain their crystalline state after losing their components. [49,50] Therefore, achieving performance while maintaining the reversibility of SCSCT remains a challenge [46,48]. Here, we successfully transformed non-polar material 1 (2-H2PCA)2(H2O)CdCl6 (2-H2PCA = 2-picolylamine cation) into polar material 2 (2-H2PCA)2CdCl6 by SCSCT, and has achieved the reversibility of SCSCT (Fig. 1). Meanwhile, 2 exhibits clear ferroelectricity with a high-temperature Tc of 378 K, a Ps of 1.18 µC/cm2 at 300 K. Among them, the reversibility of SCSCT is verified by the crystal structure and PXRD measurements. This work not only realizes the purpose of synthesizing ferroelectrics by forming polar structures by SCSCT, but also realizes the reversibility of SCSCT, which provides ideas for the construction and exploration of new molecular ferroelectrics.
Figure 1
Figure 1.
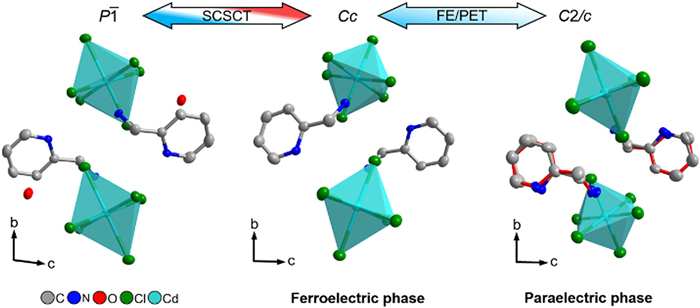
The single-crystal to single-crystal transitions (SCSCT) process from 1 to 2 and the ferroelectric/paraelectric transition (FE/PET) process of 2. The disordered components are connected by red bonds. Hydrogen atoms are omitted for clarity.
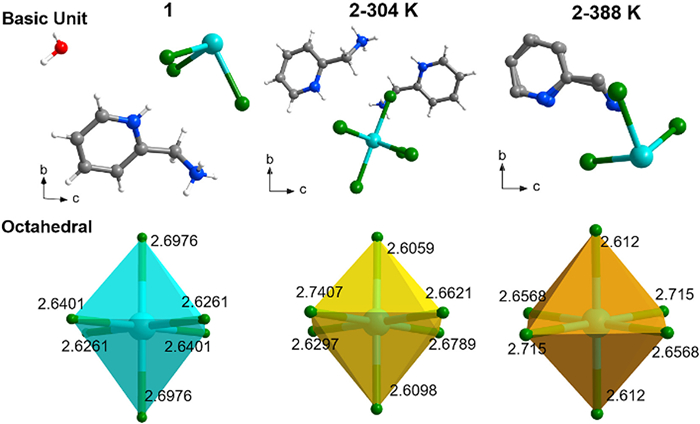
Single-crystal structures revealed that 1 crystallizes in the triclinic system with a non-polar space group of P–1 at 304 K (Table S1 in Supporting information). It constructs a zero-dimensional perovskite structure. The basic unit contains three discrete components, i.e., octahedral [CdCl6]4− anion, 2-H2PCA and an uncoordinated water molecule (Figs. 1 and 2, Fig. S1 in Supporting information). The anion group [CdCl6]4⁻ and cationic 2-H2PCA are combined by N−H···Cl hydrogen bonds which formed by N atoms and Cl atoms. The N−H···Cl bond distances are 3.127–3.264 Å (Fig. S2 and Table S2 in Supporting information). Correspondingly, the uncoordinated water molecule has one hydrogen bond, that is, acting as a donor with one Cl atom (O−H···Cl = 3.264 Å). 1 was placed in a dry environment of 373 K for 24 h dehydration to obtain a water-free structure 2. In contrast to the non-polar space group of 1, 2 crystallizes in the polar monoclinic space group Cc at 298 K, with cell parameters of a = 7.5967(4) Å, b = 14.4668(9) Å, c = 18.6314(11) Å, β = 98.558(6), and Z = 4. Similar to that of 1, the structure of 2 also exists in an ordered state and maintains a zero-dimensional structure (Fig. 2 and Fig. S1). One [CdCl6]4− anions and two 2-H2PCA cations are alternately arranged within the minimum asymmetric unit, and free H2O disappears. However, irregular octahedral [CdCl6]4− anions of 2 are more distorted when compared with that of 1 (Fig. 2). Meanwhile, the 2-H2PCA is anchored in the space by weak hydrogen bonds between the 2-H2PCA and −Cl groups with N−H···Cl distances of 3.098−3.186 Å (Fig. S2 and Table S2).
Figure 2
Figure 2.
Asymmetric units of 1 and 2 and Cd−Cl bond lengths at different states of [CdCl6]4− octahedral.
With the temperature rising up to 388 K, 2 undergoes a drastic structure change by crystallizing in the non-polar monoclinic space group C2/c. From 388 K to 298 K, the cell parameters undergo slight changes (Tables S1). As shown in Fig. 2, the [CdCl6]4− anions are changed slightly owing to their structural rigidity (Fig. S2). In contrast, the 2-H2PCA cations are seen to undergo a striking geometry change from an ordered state to a slight disordered state by thermo-driven. In detail, they are disordered over two orientations with equal probability. Furthermore, the 2-H2PCA cations are arranged antiparallel in the lattice and the dipole moments of the cations cancel each other out to yield a zero total polarization. It is very common that in crystals with bulky aromatic or aliphatic cation, the molecular reorientations have relatively low activation energy, leading to dynamical disorder, which can be used in the design of molecule-based ferroelectrics.
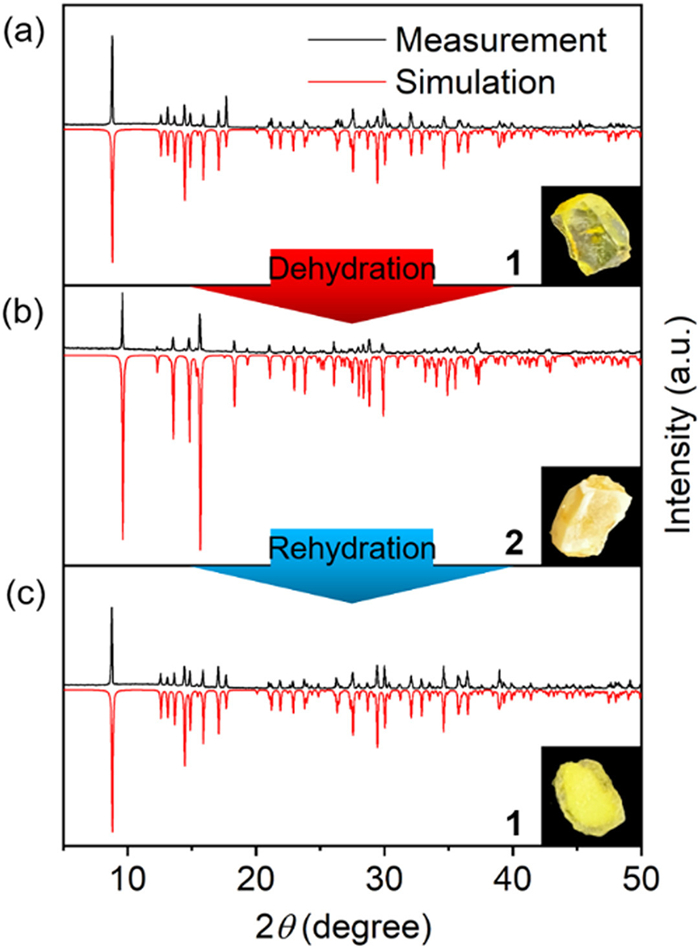
The reversibility of SCSCT was verified by X-ray single crystal diffraction experiments and powder X-ray diffraction (PXRD) measurements (Fig. 3). The results of PXRD test of compound 1 verify its purity (Fig. 3a). Then, it was moved to the oven for drying treatment. This oven is set to remain at 373 K for 24 h, then slowly reduce to room temperature. After the heating-cooling process, the PXRD pattern is completely different from the initial state at 298 K, which indicates transformation to its anhydrous form 2 (Fig. 3b and Fig. S3 in Supporting information). The crystals of 2 were placed in a humid environment for 48 h for rehydration (Fig. S3). The crystal edge was observed to restore the morphology of compound 1 when placed for 24 h (Fig. S3). The crystals which obtained by 48 h of humidification were PXRD tested, and the measurement results were consistent with the simulation values (Fig. 3c). These results verify that 2 goes back to 1 after a rehydration process. PXRD measurements demonstrate the reversibility of SCSCT.
Figure 3
Figure 3.
(a) PXRD diagram of 1. (b) PXRD diagram of 2 which dehydrated from 1. (c) PXRD diagram of 1 which rehydrated from 2. The crystal reversible SCSCT morphology are placed in the lower right corner.
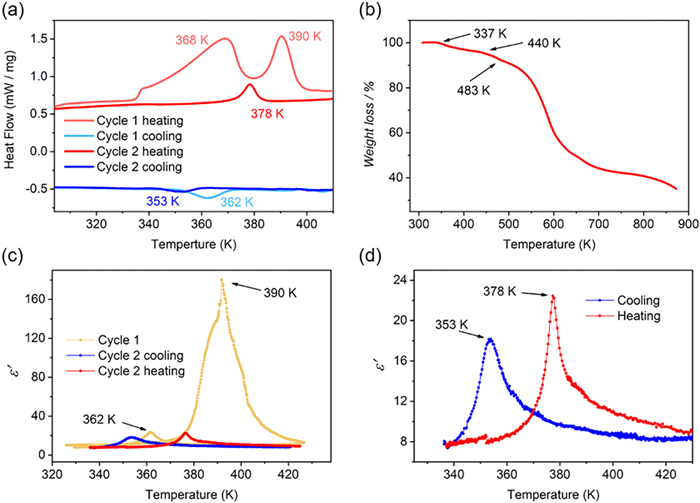
During differential scanning calorimetry (DSC) testing, two rounds of heating and cooling processes were conducted within the range of 293−423 K (Fig. 4a). In the first cycle of testing, two endothermic peaks appeared at 368 K and 390 K during heating, and only one exothermic peak appeared at 362 K during cooling. This phenomenon indicates that two structural phase transitions were occurred at heating process, one of which is irreversible (dehydration). The second cycle of test shows a pair of endothermic exothermic peaks at 378 K and 353 K in heating and cooling modes, respectively. The sharp peak and 25 K thermal hysteresis effect are consistent with the characteristics of first-order phase transition. At around 378 K, the absorption peak in the cycle 2 is significantly smaller than that in the cycle 1, indicating that the absorption peak of cycle 1 may be affected by the irreversible phase transition. The entropy change (ΔS) of cycle 2 is estimated to be about 4.77 J mol−1 K-1, Using the Boltzmann equation, ΔS = R·lnN, the N value is estimated to be ca. 1.775. It indicates that the phase transition mechanism of compound 1 may be a slight order-disorder transition (calculations of ΔS and N are displayed in Supporting information). Three cycles of DSC measurement were conducted on compound 1 to verify the accuracy of Tc. The results show that there are no significant changes in the peak positions of the second and third rounds of testing, both of them are around 378 K (Fig. S4 in Supporting information). Thermal gravimetric analysis (TGA) showed that 1 gradually dehydrate at 337 K (Fig. 4b), and the cycle 1 curve also showed an endothermic peak near 337 K in DSC testing. Two sets of phenomena mutually verify that dehydration begins at 337 K. The TG curve did not form a clear stepped shape, but there was a slope change at 440 K and 483 K. We speculate that at 440 K, the component of 1 begins to decompose and the structure is destroyed. In addition, at 483 K, the rate of mass change of the compound slowed down, possibly due to the complete decomposition of some components.
Figure 4
Figure 4.
(a) Two cycles of DSC measurement of 1. (b) TGA curve of 1. (c) Two rounds of dielectric constant measurement at 1 MHz. (d) The second cycle of dielectric constant test diagram.
To further verify the single crystal to single crystal transition process of compound 1 and whether 1 has undergone a structural phase transition, we performed two rounds of powder dielectric constant measurement in the temperature range of 330 K to 430 K (Figs. 4c and d). During the first cycle of heating, the temperature-dependent real part (ε′) gradually increased from 10.05 at 340 K to 180.3 at 392 K, a change of about 20 times. However, during cooling process ε′ only grew from 10 at 410 K to 23.2 at 361 K. The large difference of dielectric constant during heating and cooling which coincides with the first cycle of DSC testing. A continuous increase of ε′ in the range of 340–392 K during heating can be observed, and mutation occur at 378 K. This phenomenon is attributed to the gradual disappearance of free water molecules in the structure, accompanied by structural phase transformation. During the second cycle of testing, the free water molecules in the structure disappeared and compound 1 was transformed into 2 (Fig. 4d and Fig. S5 in Supporting information). The dielectric constant measurement and the DSC measurement verify each other. Structural phase transition occurs after converting 1 to 2 through SCSCT, and the sharp peak and large dielectric constant change indicate that 2 may have undergone a ferroelectric-paraelectric transition.
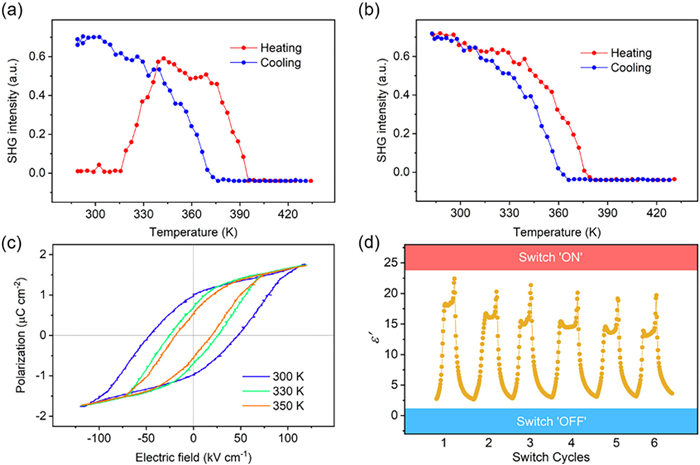
In the process of phase transition, the SHG measurement provides support for the symmetry breaking. SHG measurement was performed on the polycrystalline samples of 1. Similar to the DSC measurement, we performed two heating-cooling processes on 1 to determine SCSCT behavior and FE/PE phase transition (Figs. 5a and b, Fig. S6 in Supporting information). With the increases of temperature, the SHG signal gradually increases from unresponsive at room temperature. SHG signal remained around 0.6 × KDP over 350 K-380 K, and then rapidly decreased to an unresponsive state at 380 K (Fig. 5a). However, during the cooling process, unresponsive state of 430 K returned to 0.7 × KDP of 280 K. The results of the first cycle of tests illustrate that 1 (central symmetric space group P1) is transformed into the 2 (polar structure Cc) during the heating process. After the first cycle of heating is completed, 1 is transformed into 2 by SCSCT. Two rounds of measurement results prove that 2 undergoes a transition from a noncentrosymmetric to a centrosymmetric structure, more exactly, a polar structure (Cc) in the ferroelectric phase and a non-polar structure (C2/c) in the paraelectric phase. The ferroelectricity of 2 was finally confirmed by measured the direct P–E (polarization–electric field) hysteresis loops along the [100] direction with the Sawyer Tower circuit (Fig. 5c). The typically well-shaped ferroelectric hysteresis loops were recorded at various temperatures in the heating run. At 300 K, the measured spontaneous polarization (Ps) is about 1.18 µC/cm2, larger than those of recently reported ferroelectric10Rs–tert-butanesulfinamide (Rs-tBuSA), Ss–tert-butanesulfinamide (Ss-tBuSA) (0.31 and 0.30 µC/cm2) and Rochelle salt (0.25 µC/cm2). Structural stability is an important property of materials with SCSCT response. The transition between high (switch "ON") and low (switch "OFF") dielectric states triggered by temperature has been used to investigate the stability and dielectric switching characteristics of 2 (Fig. 5d). As a result, it has undergone sex cycles of dielectric transition in the vicinity of Tc, transitioning from "OFF" to "ON", and there was no significant attenuation in the real part of the dielectric constant. These results show that crystal 2 has a sensitive dielectric switch and excellent fatigue resistance, indicating 2 obtained a stable structure after undergoing SCSCT.
Figure 5
Figure 5.
(a) The first cycle of SHG curves of 1 at variable temperatures. (b) The second cycle of SHG curves of 2 at variable temperatures. (c) The polarization−voltage hysteresis loops of 2. (d) The dielectric switch property of 2.
In conclusion, we have successfully constructed a ferroelectric (2-H2PCA)2CdCl6 by the single-crystal-to-single-crystal transformation. The chemo-driven reversible structure transformations between 2 and its hydrated form 1. The thermo-driven ferroelectricity in 2 is mainly ascribed to the crystal lattice dynamics, i.e., the order-disorder transition of the 2-H2PCA. Discovery of these compounds made it possible to construct polar structures by SCSCT to obtain ferroelectric properties. The reversibility of SCSCT was also verified. Furthermore, this work will stimulate wide research interest in molecular-based ferroelectricity. Considering the structural flexibility of the molecular-based perovskites, the present research will open up a new avenue for finding multifunctional hybrid ferroelectrics.
Declaration of competing interest
The authors declare that they have no known competing financial interests or personal relationships that could have appeared to influence the work reported in this paper.
Acknowledgments
This work was supported by the National Natural Science Foundation of China (Nos. 22175079, 22205087 and 22275075), Natural Science Foundation of Jiangxi Province (Nos. 20225BCJ23006 and 20224ACB204002) and Science and Technology Project of Jiangxi Provincial Department of Education (No. GJJ210880).
Supplementary materials
Supplementary material associated with this article can be found, in the online version, at doi:10.1016/j.cclet.2023.109355.
Figure 1
The single-crystal to single-crystal transitions (SCSCT) process from 1 to 2 and the ferroelectric/paraelectric transition (FE/PET) process of 2. The disordered components are connected by red bonds. Hydrogen atoms are omitted for clarity.
Figure 3
(a) PXRD diagram of 1. (b) PXRD diagram of 2 which dehydrated from 1. (c) PXRD diagram of 1 which rehydrated from 2. The crystal reversible SCSCT morphology are placed in the lower right corner.
Figure 4
(a) Two cycles of DSC measurement of 1. (b) TGA curve of 1. (c) Two rounds of dielectric constant measurement at 1 MHz. (d) The second cycle of dielectric constant test diagram.
Figure 5
(a) The first cycle of SHG curves of 1 at variable temperatures. (b) The second cycle of SHG curves of 2 at variable temperatures. (c) The polarization−voltage hysteresis loops of 2. (d) The dielectric switch property of 2.

 DownLoad:

 下载:
下载:


 下载:
下载:
