Scheme 1.
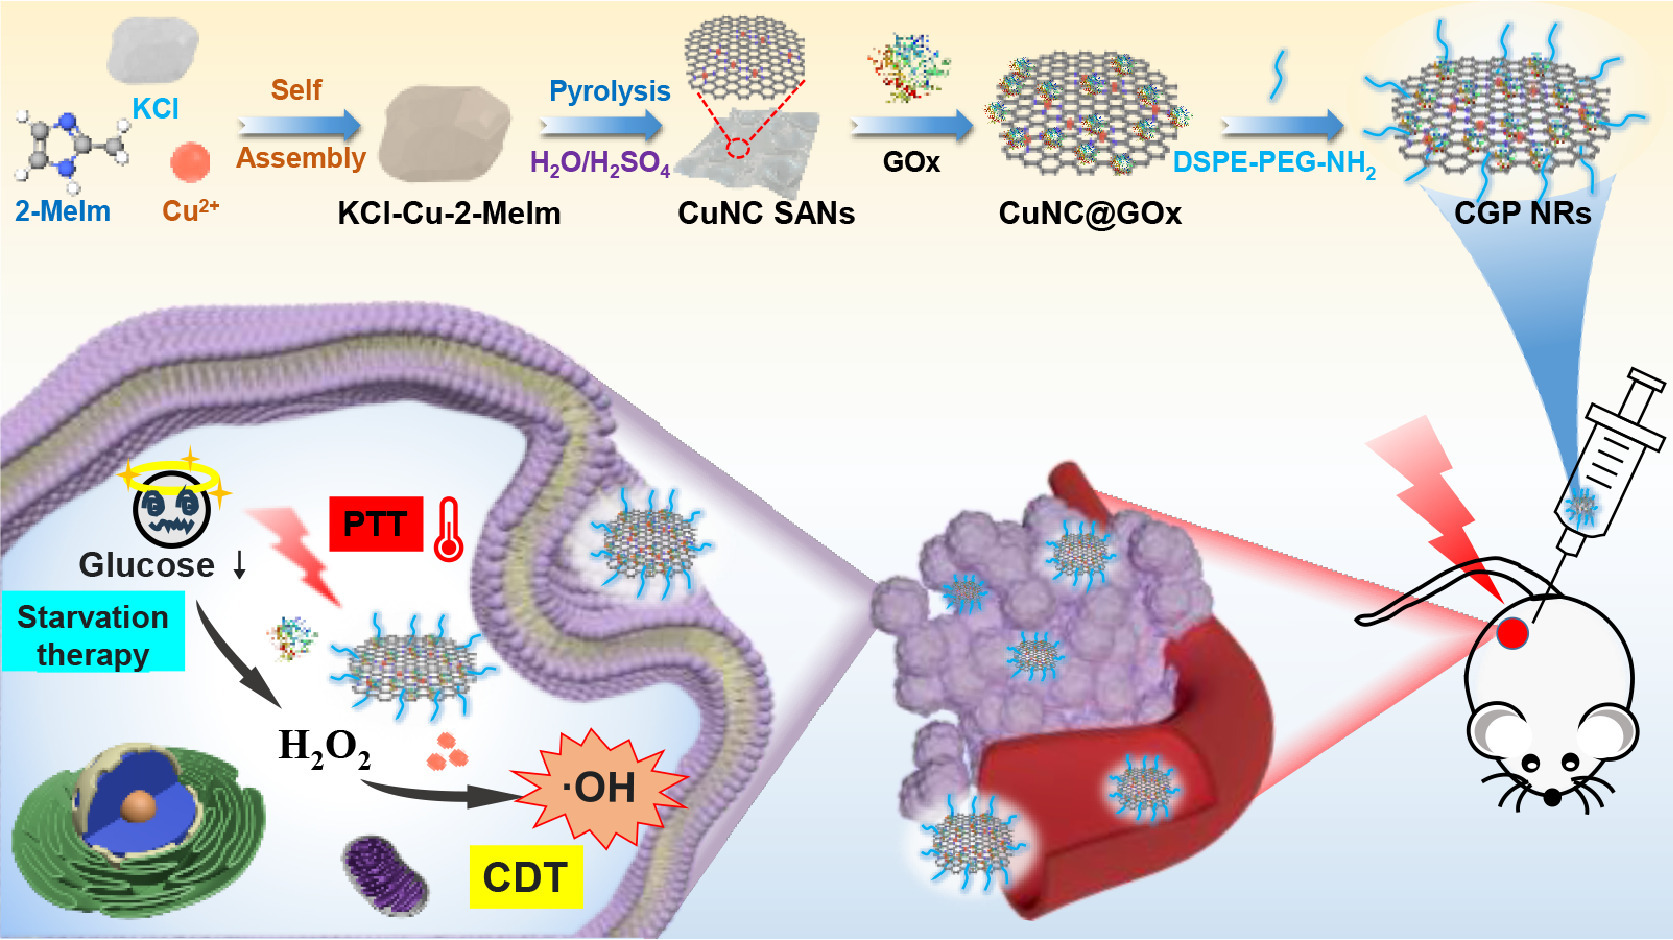
Illustration of the construction steps of CGP NRs and augmented CDT/PTT/starvation therapy.
H2O2 self-supplying cascade catalysis based on single-atom Cu nanozyme for augmented cancer therapy
Xiaoli Cai , Qihui Zheng , Yu Wu , Xin Cheng , Chengzhou Zhu

Cancer constructs a serious threat to human life, and many strategies have been developed for safe and effective cancer treatment [1,2]. Among them, enzyme catalytic therapy based on reactive oxygen species (ROS) has aroused great research interest, due to low toxicity, tumor microenvironment (TME)-responsive features and non-invasiveness [3–5]. Nevertheless, the fragile nature of natural enzymes greatly limits their practical application in cancer catalytic therapy, including poor stability and easily inactivated in vivo [6–8].
Nanozyme, a type of nanomaterial with intrinsic enzyme-like characteristics and brilliant stabilities, has great potential instead of enzymes for cancer treatment [9,10]. They possess many unique advantages over natural enzymes, including easy preparation, excellent stability, and cost reduction [11,12]. For cancer therapy, nanozymes are reported to penetrate and remain at the tumor site selectively based on the unique vascular structure of the tumor [13–15]. Under the condition of TME (mildly acidic [16], hypoxia [17], inflammation [18], over-expressional H2O2 [19]), nanozymes can mimic the activity of peroxidase (POD) and catalyze the excess H2O2 in the tumor to produce poisonous hydroxyl radical (•OH) to cause cells apoptosis, realizing chemodynamic therapy (CDT) [20–22]. Due to the specific response toward TME, nanozyme-based CDT is a promising cancer catalytic therapy strategy [23–25]. To date, various nanozymes have been explored to generate strong •OH for tumor-specific therapy by CDT [26–28]. However, to achieve higher tumor elimination, CDT needs to increase the amount of •OH generated to amplify cell apoptosis [29–31]. To solve this problem, various strategies to improve the catalytic activity of nanomaterials have been proposed to initiate a highly efficient catalytic reaction [32,33]. Unfortunately, the nonuniform chemical composition and low density of active sites of nanozymes severely compromise the efficiency of catalytic reactions [34,35]. Recently, the emergence of single-atom nanozymes (SANs) has caused a sensation in biomedical fields [36–38]. Due to abundant atomically dispersed active sites and the optimized coordination structure, SANs exhibit superior catalytic activity and selectivity than traditional nanozymes [39,40]. The excellent POD-like activity of SANs promotes the generation of •OH by efficient catalytic reaction, which enhances the efficiency of CDT [41–43]. However, the limited intratumoral H2O2 concentration also fails to produce a desirable and sufficient amount of •OH for inducing satisfactory CDT [44]. Therefore, it is extremely important to explore a strategy that integrates SANs with cellular H2O2 supplements to amplify endogenous •OH generation and achieve high-efficiency CDT.
In this work, we synthesized single-atom Cu nanozymes (CuNC SANs) with high POD-like activity by the salt template method, which aims to trigger efficient catalytic reactions for high-efficiency cancer CDT (Scheme 1). To overcome the limitations of insufficient H2O2 levels on the efficiency of CDT, glucose oxidase (GOx) is immobilized in CuNC SANs to construct an H2O2 self-supplying hybrid cascade system. To enhance their biological performance and stability, polyethylene glycol (DSPE-PEG-NH2) is further modified and TME-responsive CuNC@GOx-PEG nanoreactors (CGP NRs) are developed. After CGP NRs are enriched at the tumor site, the immobilized GOx of cascade systems reacts with intracellular glucose to produce H2O2 in situ, elevating the concentration of H2O2 and increasing ROS yield at the tumor area, thus amplifying the effect of CDT. The consumption of glucose in tumors also cuts off the energy supply and consequently inhibits the proliferation of tumors, achieving cancer starvation therapy. Furthermore, the distinct photothermal properties of CuNC SANs not only accelerate the cascade reaction but also can be used for cancer photothermal therapy (PTT). Overall, this work designs an efficient photothermal synergistic multi-enzymatic cascade therapeutic scheme to achieve H2O2 self-supply CDT/PTT/starvation therapy for cancer.
According to a salt-template strategy, single-atom Cu nanozymes (CuNC SANs) are synthesized, which possess high-concentration Cu sites on carbon nanosheets. The wrinkle morphology of CuNC SANs is demonstrated by scanning electron microscopic (SEM) (Fig. 1a), and their ultrathin nanosheet structures are further validated by transmission electron microscopy (TEM) (Fig. 1b). The aberration-corrected high-angle annular dark-field scanning TEM (HAADF-STEM) image shows a large amount of white bright dots, indicating the existence of isolated atomic Cu sites (Fig. 1c). To improve the potential for biomedical applications, the small-size CuNC SANs are obtained using an ultrasonic processor, which is verified by SEM and TEM images (Figs. S1a and b in Supporting information). Moreover, the crystal structure of CuNC SANs prepared in this work is investigated using XRD analysis (Fig. S2 in Supporting information). The XRD spectrum of CuNC SANs gives only two distinct peaks 22.9° and 43.2°, which is in agreement with (002) and (100) reflections of graphitic carbon, revealing that CuNC SANs have graphitization domains without the existence of crystalline Cu species. The valence state and local coordination environment of CuNC SANs are revealed by the X-ray absorption near-edge structure (XANES) and extended X-ray absorption fine structure (EXAFS). As shown in Fig. 1g, the analysis of XANES spectra of CuNC SANs and Cu foil indicates that the valence state of Cu is between Cu0 and Cu2+. For further clarification, X-ray photoelectron spectroscopy (XPS) is performed to discriminate the electronic structure. As shown in Fig. S3b (Supporting information), the high-resolution XPS result of Cu 2p shows Cu+ and Cu2+ peaks. Moreover, the coexistence of Cu and N is also verified by XPS spectra of CuNC SANs (Fig. S3a in Supporting information). In addition, no characteristic peak for Cu-Cu bonding is detected in the EXAFS spectrum of CuNC SANs, indicating the atomic distribution of Cu (Fig. 1h). The fitting results show the coordination number of Cu is ~4 (Fig. S4 and Table S1 in Supporting information).
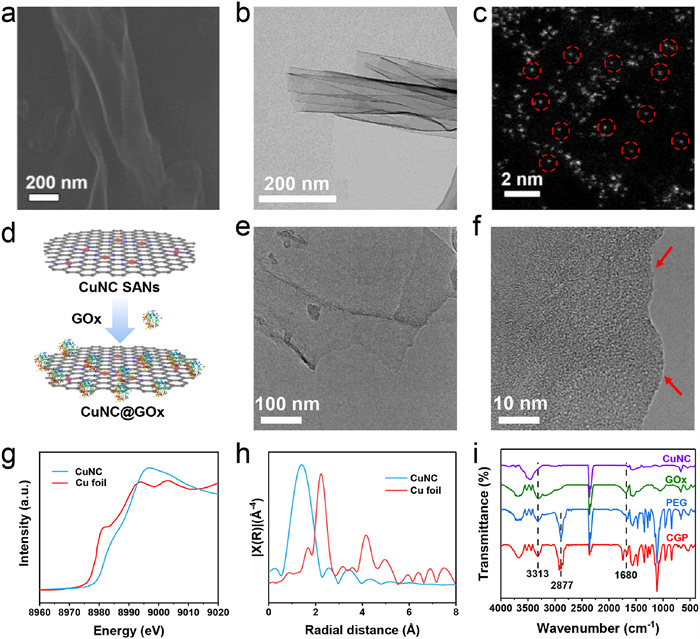
To obtain CuNC@GOx hybrid cascade systems, GOx is loaded to CuNC SANs by electrostatic interaction (Fig. 1d). As shown in Fig. S5 (Supporting information), the zeta potential value of CuNC SANs decreased from 3.727 mV to 1.866 mV, indicating the successful loading of GOx. Figs. 1e and f show TEM images of the prepared composites, in which hazy and sticking edges are observed in comparison with TEM images of CuNC SANs. The successful fabrication of CuNC@GOx is also demonstrated by UV–vis absorption spectra (Fig. S6 in Supporting information). Compared with CuNC SANs, a typical absorption peak of GOx near 260 nm appeared in the spectra of CuNC@GOx, proving the immobilization of GOx. The amount of GOx loaded into CuNC SANs is calculated to be 59.02% by BCA protein assay (Fig. S7 in Supporting information). This high-loading content of GOx shows the potential to trigger high-efficiency cascade catalytic reactions. To improve the stability and biocompatibility of CuNC@GOx, polyethylene glycol (DSPE-PEG-NH2) is modified and the final products of CGP NRs are obtained. The Fourier transform infrared spectra (FTIR) of CGP show a peak at 2877 cm-1, which represents the vibrations of -CH2- from PEG (Fig. 1i). Moreover, compared with the spectra of CuNC SANs, additional peaks (1680 and 3313 cm-1) appear in the FTIR spectrum of CGP that correspond to -NH-CO- vibration and -NH2- vibration respectively, indicating the immobilization of GOx in CuNC SANs.
To investigate the POD-like activity of CuNC SANs, the typical 3,3′,5,5′-tetramethylbenzidine (TMB) oxidation experiment is conducted. Due to the catalytic action of POD-like enzymes, colorless TMB can be converted into blue oxidized TMB (oxTMB) and exhibits a characteristic absorption at 652 nm. As depicted in Fig. 2a, no significant signal changes are observed in the spectra of TMB or TMB+H2O2. However, a clear absorption peak at 652 nm is observed after the addition of CuNC SANs, proving the favorable POD-like activity of CuNC SANs. The absorbance of oxTMB increases gradually with the increase of H2O2 concentration (Fig. 2b), demonstrating H2O2-dependent oxidation reactions. The POD-like activity of CuNC SANs is further investigated by the H2O2 and TMB chromogenic system-based kinetic assay. For both H2O2 (Fig. 2c) and TMB (Fig. S8 in Supporting information), the kinetic analysis results show that CuNC SANs-based catalyzed reactions obey Michaelis-Menten kinetics. Meanwhile, the detailed kinetics parameters are compared with those of other reported work (Table S2 in Supporting information), which proves the high catalytic ability of CuNC SANs. In addition, based on the Vmax for substrate TMB, the comparison of the POD-like and OXD-like activities of CuNC SANs is performed. As shown in Fig. S9 (Supporting information), CuNC SANs exhibit superior POD-like catalytic activity.
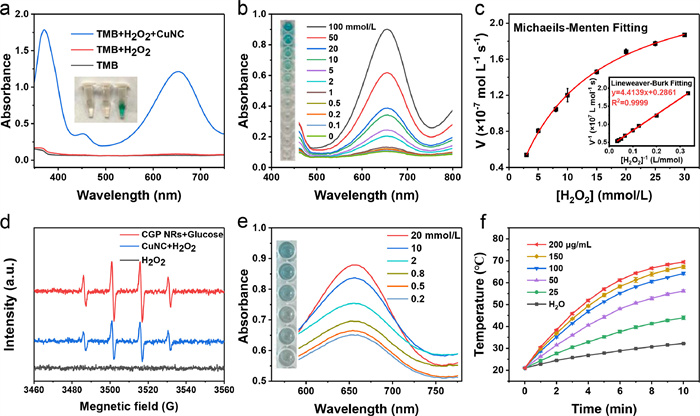
To distinguish the reactive species generated by CuNC SANs, the catalytic products are also analyzed by electron spin resonance (ESR) spectroscopy. The short-lived radical is captured by 5,5-dimethyl-1-pyrroline N-oxide (DMPO). As demonstrated in Fig. 2d, there are no obvious signals presented after adding H2O2. However, characteristic absorption 1:2:2:1 hydroxyl radical signals appear after the addition of CuNC SANs, confirming large amounts of toxic •OH generation. Therefore, the POD-like activity of CuNC SANs indeed has the potential to kill cancer cells by CDT.
To increase the amount of •OH generated and amplify CDT efficiency, GOx is introduced to construct a cascade system. Fig. S10 (Supporting information) demonstrates the mechanism of the cascade catalytic process. Briefly, the GOx consumes glucose to yield gluconic acid and H2O2, and then H2O2 is further catalyzed by CuNC SANs and produces massive •OH. TMB can be oxidized into oxTMB by •OH. Therefore, TMB is used as the substrate to investigate the designed cascade reaction. As shown in Fig. S11 (Supporting information), there is no significant absorption of oxTMB (652 nm) in the presence of glucose alone. As expected, the group of CGP+glucose results in significant signals at 652 nm, which can be attributed to the production of •OH by glucose-trigger cascade reaction. The production of •OH by CGP NRs-mediated cascade reaction is also confirmed by the ESR spectra (Fig. 2d). Moreover, when the group of CGP+glucose is treated with laser irradiation, the absorption intensity of oxTMB is significantly increased (Fig. S11), indicating that laser irradiation can promote the cascade catalytic reaction, thus increasing •OH generation and enhancing CDT treatment effects. Fig. 2e further explores the effect of glucose on the catalytic performance of CGP NRs. It has been found that the •OH production catalyzed by the CGP NRs is glucose concentration-dependent, confirming the potential of starvation therapy. In addition, Fig. S12 (Supporting information) explores the effect of pH on the cascade reaction. Compared with neutral conditions, the CGP NRs show a stronger absorption of oxTMB in acidic conditions, demonstrating the weakly acidic condition of TME facilitates their production of •OH.
UV–vis spectra are tested to assess the photothermal potential of CuNC SANs. As shown in Fig. S13 (Supporting information), the curve of CuNC SANs exhibits a broad absorption range from visible to near-infrared (NIR) window, indicating their possibility to possess excellent photothermal performance. When CuNC SANs are exposed to NIR laser irradiation (808 nm), their temperature increases monotonically with the concentration (Fig. 2f), implying the CuNC SANs own concentration-dependent photothermal performance. Subsequent investigations, Fig. S14 (Supporting information) also confirm the power dependence of the photothermal performance of CuNC SANs. Based on the temperature change of the heating and cooling cycles (Figs. S15a and b in Supporting information), the photothermal conversion efficiency (η) of CuNC SANs is calculated to be 69.04% [45,46]. Additionally, there are no significant changes in the spectra of CuNC SANs with continuous laser irradiation even after 30 min (Fig. S16 in Supporting information), indicating their excellent photothermal stability. Overall, these findings suggest that CuNC SANs possess excellent photothermal properties, making them promising candidates in cancer photothermal therapy.
To further elucidate the catalytic cascade reaction mechanism of CGP NRs at the cellular level, experiments are performed using 4T1 cells as models. As Fig. 3a demonstrates, GOx can catalyze glucose to generate gluconic acid and H2O2, realizing starvation therapy and lowering the environmental pH. The sufficient supply of H2O2 and lower pH can further activate the POD activity of CuNC SANs, producing a large amount of •OH to efficiently amplify the oxidative damage of cancer cells. To examine the cellular intake, FITC is employed to label CGP NRs. The intracellular distribution is visualized using confocal laser scanning microscopy (CLSM). As depicted in Fig. 3b, in comparison to untreated 4T1 cells, a distinct green fluorescent signal appears in the cytoplasm of cells co-incubated with CGP NRs for 0.5 h, indicating that CGP NRs are successfully endocytosed into the cells. Furthermore, the fluorescent signal is stronger after 2 h of co-incubation, proving the uptake levels increase over time.
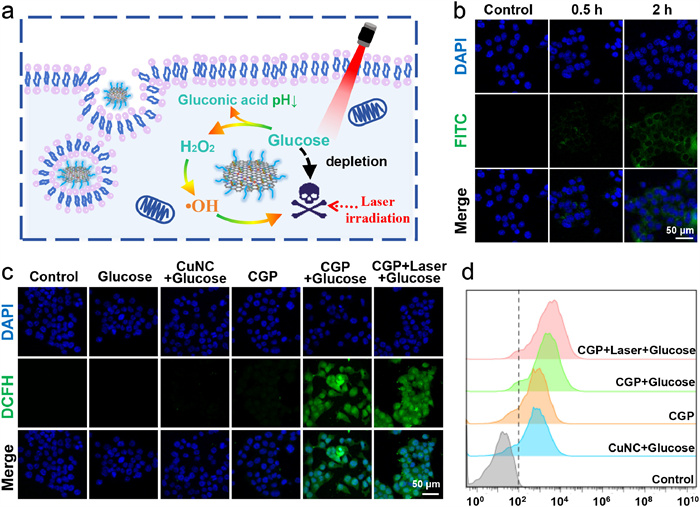
To investigate the cellular ROS production by the CGP NRs cascade system, 2′,7′-dichlorofluorescein diacetate (DCFH-DA) is utilized as the probe. After the generation of ROS, DCFH-DA can be decomposed and show strong green fluorescence. ROS can trigger apoptosis by damaging DNA molecules through oxidative stress, realizing CDT. To some extent, ROS levels can reflect CDT efficiency [47]. As seen in Fig. 3c, 4T1 cells incubated with glucose alone cannot trigger ROS generation. Meanwhile, no significant green fluorescent is observed in 4T1 cells treated with CuNC SANs or CGP NRs in a glucose-free cell culture medium, which can be attributed to the limited H2O2 sources for massive ROS production. However, strong green fluorescence is observed after co-incubation of the CGP NRs with cells in the presence of glucose, proving that CGP NRs can produce abundant ROS by glucose-triggered cascade catalytic reactions. Interestingly, the addition of laser irradiation did not adversely affect the generation of ROS and strong green fluorescence signals are detected. Intracellular ROS production after different treatment is also measured by flow cytometric assay, which demonstrates that the DCF fluorescence in 4T1 cells increases in the group of CGP+Laser+glucose (Fig. 3d). The CLSM and flow cytometry results confirm the massive intracellular ROS production after treating CGP and glucose under the laser irradiation. Additionally, as illustrated in Fig. S17 (Supporting information), at pH 7.4, 4T1 cells treated with glucose and CGP NRs exhibit rare green fluorescence, indicating a small amount of intracellular ROS production. However, the green fluorescence signals under pH 6.0 are particularly pronounced, implying massive ROS generation under weakly acidic conditions via the glucose-initiated cascade reaction.
To investigate the cell cytotoxicity of CuNC SANs, a MTT assay is conducted. 4T1 cells are cultivated with different doses of CuNC SANs for 24 h, and the result is depicted (Fig. S18 in Supporting information). Even under the high concentration of 100 µg/mL, cells maintain relatively high viability, demonstrating the excellent biocompatibility of CuNC SANs. Then, the cytotoxicity effect of CGP NRs on 4T1 cells is investigated. As shown in Fig. 4a, compared with pH 7.4, cell viability significantly decreases in a concentration-dependent manner after treatment with CGP NRs at pH 6.0, resulting from plentiful ROS generation by CGP NRs-mediated cascade reaction under weakly acidic conditions. Additionally, as depicted in Fig. 4b, cell viability gradually recovers with the escalating concentration of the free radical scavenger l-ascorbic acid, indicating that the free radicals generated by the CGP cascade systems are the main inducers of cell apoptosis. Fig. 4c also investigates the effect of laser irradiation on cell viability after incubating with different doses of CGP NRs. Compared with the condition without laser irradiation, the cell viability significantly decreases under laser irradiation. This result confirms that laser irradiation can enhance catalytic reactions and accelerate tumor cell apoptosis.
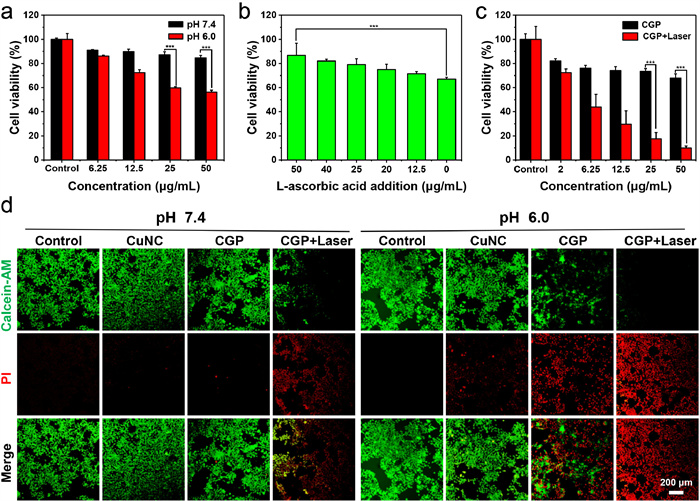
Subsequently, a calcein-AM/PI double-staining assay kit is used for visual analysis of cell activity. Simultaneous staining of 4T1 cells with calcein-AM and PI resulted in green fluorescence being observed in living cells and red fluorescence in dead cells. When 4T1 cells are incubated with CuNC or CGP alone at pH 7.4, rare red fluorescence signals are observed (Fig. 4d), indicating that damage may be absent under neutral conditions. In contrast, at pH 6.0, significantly increased red signals appear in 4T1 cells treated with CGP, suggesting the acidic conditions promote the ROS production of the CGP cascade system for inducing cell apoptosis. Moreover, pushed by laser irradiation, almost no surviving cells are observed in the group of CGP+Laser at pH 6.0, proving cancer cells can be efficiently destroyed by the designed CGP cascade system under CDT/PTT/starvation triple therapy. The CLSM results are further confirmed by the MTT assay of 4T1 cells with the same treatments (Fig. S19 in Supporting information).
To demonstrate the practicality of CGP NRs in antitumor applications, we conduct investigations using 4T1 tumor-bearing mice. All the animal experiments were approved by an ethical committee of Medical College, Wuhan University of Science and Technology (2024136). The experimental procedure is outlined in Fig. 5a, where tumor-bearing mice are first established. Prior to intervention, Cy7-labeled CGP NRs are intravenously injected into tumor-bearing mice to explore the biodistribution of CGP NRs in vivo. The fluorescent signals are captured using a live animal imaging system. As illustrated in Fig. 5b, significant fluorescent signals gradually cluster at the tumor site over time, which can be ascribed to the enhanced permeability and retention (EPR) effect. Subsequently, major organs and tumors are collected, and their fluorescent signals are captured for fluorescence intensity analysis. The fluorescence intensity accumulated at the tumor is higher than that in other organs, except for the kidney, demonstrating the efficient retention of CGP NRs at the tumor site (Fig. S20 in Supporting information). Moreover, the biodistribution of CGP NRs is also tracked by determining the Cu content using inductively coupled plasma mass spectrometry (ICP-MS). After 48 h, the Cu content in the liver is higher than that in the other main organs and tissues (Fig. S21 in Supporting information), proving that the system can be metabolized through the liver and ensuring the safety of treatment. Notably, the Cu content in tumors ranks second only to the liver, indicating the targeted aggregation of CGP NRs in the tumor. Additionally, Fig. S22 (Supporting information) investigates the in vivo photothermal capacity of CGP NRs. After tumor-bearing mice are injected with CGP NRs and treated with laser irradiation, their temperature changes in the tumor region are monitored. Compared with the temperature of tumors injected with PBS, the temperature of tumor sites treated with CGP NRs shows a noticeable increase and over 50 ℃ within 4 min, which is sufficient to cause the cell death of tumors.
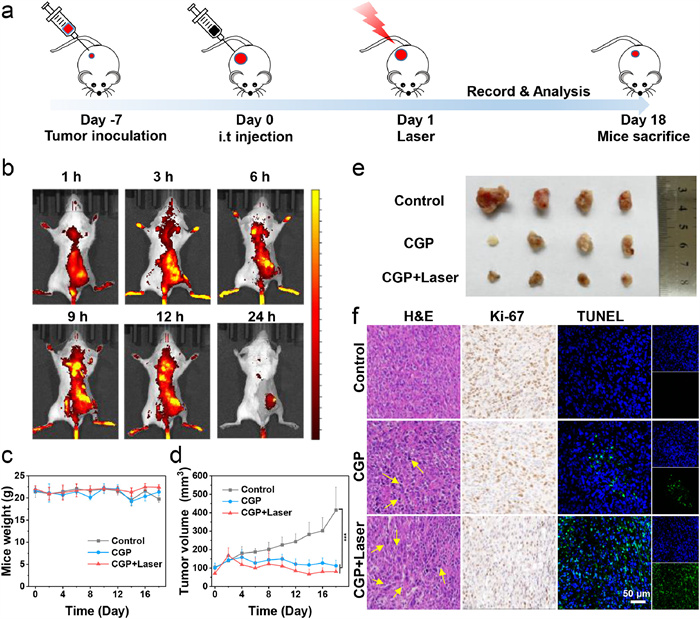
To investigate the tumor inhibition ability of CGP NRs in vivo, tumor model intervention experiments are conducted. The tumor volume and body weight were measured every other day. As shown in Fig. 5c, mice body weights show no significant abnormalities during the treatment, indicating the biosafety of CGP NRs. Concurrently, Fig. 5d monitors changes in tumor volume. In contrast to the control group, tumor proliferation in the CGP NRs group is significantly inhibited, which may be ascribed to glucose depletion by GOx and augmented efficiency of the CDT. Furthermore, in synergy with laser irradiation, tumor growth is further suppressed. The result demonstrates that the combination of PTT, CDT and glucose depletion can effectively destroy tumors for augmented cancer therapy. Representative and dissected tumor images are collected at the end of the intervention (Fig. 5e). Compared with other groups, the tumors in the CGP+Laser group are smaller because the CGP NRs integrated with laser irradiation can effectively eliminate tumors.
To further evaluate therapeutic performance through tumor-pathological analysis, hematoxylin and eosin (H&E) staining, Ki-67 immunohistochemistry, and terminal deoxynucleotidyl transferase-mediated dUTP-biotin nick end labeling (TUNEL) fluorescence staining was used. H&E staining of tumor tissue slices from the group of CGP NRs reveals sparsely arranged tumor cells and a lot of apoptotic cells with extensive nuclear shrinkage compared to the control group (yellow arrow, Fig. 5f). Notably, the nucleus crumpling is further exacerbated under laser irradiation, indicating CGP NRs plus laser lead to the most severe damage to tumor cells. For Ki-67 immunostaining, extensive brown-positive areas are observed in the control group. However, rare positive signals are observed in the CGP+Laser group, reflecting tumor cell proliferation is significantly reduced after the intervention. The TUNEL assay also confirms the potent antitumor ability of CGP NRs under an 808 nm laser, in which the strongest green apoptotic signals are observed in the treatment of CGP NRs and laser irradiation.
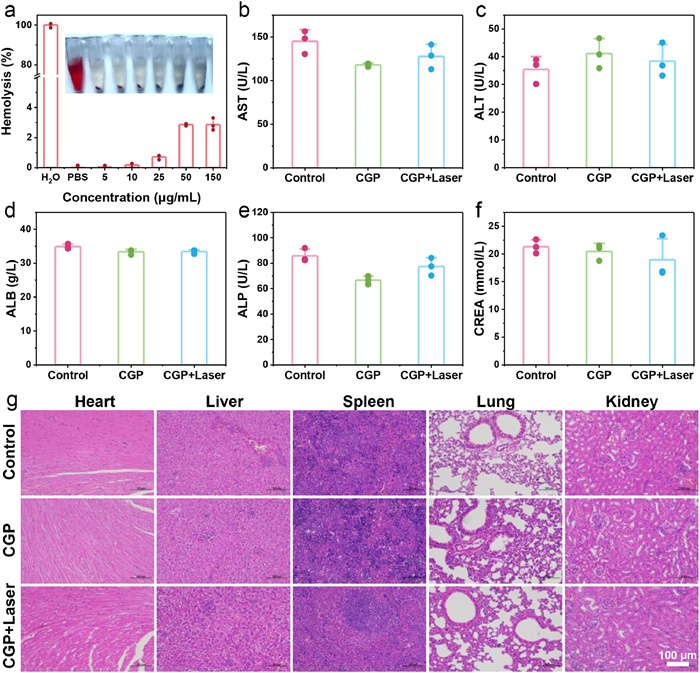
The biocompatibility of nanodrugs remains a critical concern. To investigate the toxicity of CGP NRs, an ex vivo hemolysis assay is performed. The result in Fig. 6a demonstrates the good blood compatibility of CGP NRs. Additionally, the blood biochemical analysis further confirms the biosafety of CGP NRs. As depicted in Figs. 6b-f, there are no significant differences in the blood biochemical analysis between the intervention groups and the control group, and all of the hematological parameters remained within normal levels. Moreover, pathological examination of dissected major organs' tissue slices using H&E staining reveals no noticeable organ damage or inflammation (Fig. 6g). The results demonstrate the biosafety of CGP NRs in vivo.
In summary, we have successfully constructed a CGP hybrid cascade system based on the TME to enhance cancer therapy by combining PTT/CDT/starvation therapy. The excellent POD-like activity of CuNC SANs achieves efficient cancer CDT via catalyzing intracellular H2O2 to produce poisonous •OH. The CDT efficiency is further amplified by immobilizing GOx on CuNC SANs, where the constructed CGP hybrid cascade systems can consume glucose at the tumor site to achieve cancer starvation therapy and produce H2O2 in situ. The produced H2O2 with elevated concentration is further catalyzed by CuNC SANs to increase the amount of •OH after the cascade reaction, promoting oxidative damage to cancer cells. Additionally, the photothermal properties of CuNC SANs not only accelerate the cascade reaction for high-efficiency CDT but also enable synergistic treatment by cancer PTT. Therefore, this work provides a promising strategy for high-efficiency cancer therapy.
The authors declare that they have no known competing financial interests or personal relationships that could have appeared to influence the work reported in this paper.
Xiaoli Cai: Writing – review & editing, Writing – original draft, Supervision, Funding acquisition, Data curation, Conceptualization. Qihui Zheng: Writing – original draft, Validation, Software, Formal analysis. Yu Wu: Methodology, Investigation. Xin Cheng: Data curation. Chengzhou Zhu: Writing – review & editing, Supervision, Resources.
The authors gratefully acknowledge the financial support from the Natural Science Foundation of Hubei Province, China (No. 2023AFB122), “the 14th Five Year Plan” Hubei Provincial advantaged characteristic disciplines (groups) project of Wuhan University of Science and Technology (No. 2023C0301). We would like to thank the Analytical & Testing Center of Wuhan University of Science and Technology for the help with in vivo imaging of mice analysis.
Supplementary material associated with this article can be found, in the online version, at doi:
R.L. Siegel, K.D. Miller, N.S. Wagle, et al., CA Cancer J. Clin. 73 (2023) 17–48. doi: 10.3322/caac.21763
A. Boire, K. Burke, T.R. Cox, et al., Nat. Rev. Cancer 24 (2024) 578–589. doi: 10.1038/s41568-024-00708-4
Q. Zhao, L. Zheng, Y. Gao, et al., J. Am. Chem. Soc. 145 (2023) 12586–12600. doi: 10.1021/jacs.3c01532
Z. Yue, J. Li, M. Tang, et al., Adv. Healthcare Mater. 13 (2024) e2303222. doi: 10.1002/adhm.202303222
J. Huang, G. Deng, S. Wang, et al., Adv. Sci. 10 (2023) e2302208. doi: 10.1002/advs.202302208
C. Cao, X. Wang, N. Yang, et al., Chem. Sci. 13 (2022) 863–889. doi: 10.1039/d1sc05482a
J. Yang, H. Yao, Y. Guo, et al., Angew. Chem. Int. Ed. 61 (2022) e202200480. doi: 10.1002/anie.202200480
X. Cai, Y. Huang, C. Zhu, Adv. Healthcare Mater. 44 (2024) 211–228.
J. Wu, X. Wang, Q. Wang, et al., Chem. Soc. Rev. 48 (2019) 1004–1076. doi: 10.1039/c8cs00457a
X. Niu, Y. Zhu, C. Ding, et al., Adv. Funct. Mater. 33 (2023) 2306778. doi: 10.1002/adfm.202306778
X. Cai, L. Jiao, H. Yan, et al., Mater. Today 44 (2021) 211–228. doi: 10.1016/j.mattod.2020.12.005
Y. Tang, X. Liu, P. Qi, et al., Nano Lett. 24 (2024) 9974–9982. doi: 10.1021/acs.nanolett.4c02594
Y. Shi, R. van der Meel, X. Chen, et al., Theranostics 10 (2020) 7921–7924. doi: 10.7150/thno.49577
P.L. Bedard, D.M. Hyman, M.S. Davids, et al., Lancet 395 (2020) 1078–1088. doi: 10.1016/S0140-6736(20)30164-1
Y. Luo, F. Zheng, Y. Gao, et al., ACS Appl. Nano Mater. 7 (2024) 9345–9354. doi: 10.1021/acsanm.4c00840
J.N. Rahmat, J. Liu, T. Chen, et al., Chem. Soc. Rev. 53 (2024) 5862–5903. doi: 10.1039/d3cs00602f
X. Jing, F. Yang, C. Shao, et al., Mol. Cancer 18 (2019) 157. doi: 10.1186/s12943-019-1089-9
F.R. Greten, S.I. Grivennikov, Immunity 51 (2019) 27–41. doi: 10.1016/j.immuni.2019.06.025
N. Yang, W. Xiao, X. Song, et al., Nano-Micro Lett. 12 (2020) 15. doi: 10.1007/s40820-019-0347-0
Z. Yang, A. Yang, W. Ma, et al., J. Nanobiotechnol. 20 (2022) 20. doi: 10.1002/ppul.25736
M. Zhao, A. Zhu, X. Zheng, et al., Adv. Healthcare Mater. 12 (2023) e2300118. doi: 10.1002/adhm.202300118
J.N. Hao, K. Ge, G. Chen, et al., Chem. Soc. Rev. 52 (2023) 7707–7736. doi: 10.1039/d3cs00356f
X. Cai, R. Liu, H. Yan, et al., Adv. Healthcare Mater. 12 (2023) 2300516. doi: 10.1002/adhm.202300516
Q. Lu, M. Hou, X. Huang, et al., Adv. Funct. Mater. 34 (2024) 2401328. doi: 10.1002/adfm.202401328
M. Huo, L. Wang, Y. Chen, et al., Nat. Commun. 8 (2017) 357. doi: 10.1038/s41467-017-00424-8
Z. Wang, X. Wang, X. Dai, et al., Adv. Mater. 36 (2024) e2312316. doi: 10.1002/adma.202312316
W. Xu, J. Qian, G. Hou, et al., Adv. Funct. Mater. 32 (2022) 2205013. doi: 10.1002/adfm.202205013
H. Li, Y. Li, L. Su, et al., Adv. Sci. 11 (2024) 2308251. doi: 10.1002/advs.202308251
D. Liu, R. Guo, S. Mao, et al., Nano Res. 16 (2022) 1021–1032. doi: 10.3390/agronomy12051021
M. Sha, L. Rao, W. Xu, et al., Nano Lett. 23 (2023) 701–709. doi: 10.1021/acs.nanolett.2c04697
W. Ke, J. Li, F. Mohammed, et al., ACS Nano 13 (2019) 2357–2369.
Y. Wu, Y. Tang, W. Xu, et al., Small 19 (2023) e2302929. doi: 10.1002/smll.202302929
Z. Sun, C. Zhou, Y. Zhou, et al., Adv. Healthcare Mater. 12 (2023) 2301306. doi: 10.1002/adhm.202301306
X. Di, Z. Pei, Y. Pei, et al., Coord. Chem. Rev. 484 (2023) 215098. doi: 10.1016/j.ccr.2023.215098
W. Xu, X. Cai, Y. Wu, et al., Nat. Commun. 14 (2023) 6064. doi: 10.1038/s41467-023-41765-x
Y. Wu, J. Wu, L. Jiao, et al., Anal. Chem. 92 (2020) 3373–3379. doi: 10.1021/acs.analchem.9b05437
W. Yan, W. Chen, Y. Chen, Adv. Funct. Mater. 34 (2024) 2401027. doi: 10.1002/adfm.202401027
Q. Chang, J. Wu, R. Zhang, et al., Nano Today 56 (2024) 102236. doi: 10.1016/j.nantod.2024.102236
J. Shen, J. Chen, Y. Qian, et al., Adv. Mater. 36 (2024) e2313406. doi: 10.1002/adma.202313406
L. Jiao, W. Xu, Y. Wu, et al., Chem. Soc. Rev. 50 (2021) 750–765. doi: 10.1039/d0cs00367k
X. Zhu, J. Wu, R. Liu, et al., ACS Nano 16 (2022) 18849–18862. doi: 10.1021/acsnano.2c07691
T. Ye, C. Chen, D. Wang, et al., Nat. Commun. 15 (2024) 1682. doi: 10.1038/s41467-024-45927-3
W. Li, Y. Xiao, G. Guo, et al., Nano Today 56 (2024) 102223. doi: 10.1016/j.nantod.2024.102223
J. Cai, X. Hao, Z. Bian, et al., Angew. Chem. Int. Ed. 63 (2024) e202409079. doi: 10.1002/anie.202409079
K.K. Lee, J.H. Lee, S.C. Lee, et al., Theranostics 12 (2022) 6762–6778. doi: 10.7150/thno.77060
R. Wang, X. Wang, X. Mu, et al., Acta Biomater. 148 (2022) 142–151. doi: 10.1016/j.actbio.2022.06.007
N. Tao, S. Chen, S. Mahdinloo, et al., Nano Today 57 (2024) 102371. doi: 10.1016/j.nantod.2024.102371

Scheme 1 Illustration of the construction steps of CGP NRs and augmented CDT/PTT/starvation therapy.

Figure 1 (a) SEM (b) TEM and (c) magnified HAADF-STEM images of CuNC SANs. (d) Schematic illustration of the construction of CuNC@GOx hybrid cascade systems. (e, f) TEM images of CuNC@GOx with different magnifications. (g) Cu K-edge XANES spectra of CuNC SANs and Cu foil. (h) Fourier transform EXAFS spectra of CuNC SANs and Cu foil. (i) FTIR spectra of CuNC, GOx, PEG, and CGP NRs.

Figure 2 (a) UV–vis absorption spectra of TMB, TMB+H2O2 and TMB+H2O2+CuNC. (b) UV–vis absorption spectra of TMB in the presence of H2O2 with different concentrations. (c) The kinetic analysis and Lineweaver-Burk plotting (inset) for CuNC SANs with H2O2 as substrate. (d) the ESR spectra of H2O2, CuNC+H2O2 and CGP NRs+glucose. (e) UV–vis absorption spectra of TMB in the presence of CGP and glucose with different concentrations. Insets represent digital photos of color changes. (f) Temperature curves of CuNC SANs with different concentrations under laser irradiation.

Figure 3 (a) Schematic illustration of CGP-initiated cascade catalytic reactions in tumor cells. (b) The fluorescence images of 4T1 cells after incubating with FITC-labeled CGP NRs for 0, 0.5 and 2 h. (c) Cellular ROS production after different treatments. (d) Flow cytometric analysis of intracellular ROS levels in 4T1 cells after different treatments.

Figure 4 Cytotoxicity of 4T1 cells treated with (a) CGP NRs under different pH conditions, (b) various concentrations of l-ascorbic acid and (c) CGP NRs under laser or no laser irradiation (808 nm, 1.5 W/cm2, n = 3). (d) CLSM images of living and dead cell distributions after different treatments. Data are expressed as mean values ± standard deviations (***P < 0.001).

Figure 5 (a) Diagram illustrating the experimental methodology used to assess the anti-tumor activity of CGP NRs. (b) The in vivo biodistributions of Cy7-labeled CGP NRs at various time points post intravenous injection. (c) The weight and (d) tumor growth curves of mice in different groups (n = 4). (e) Photos of the 4T1 tumor-bearing mice after different treatments for 18 days. (f) H&E, Ki-67, and TUNEL assay with stained tumor slices in different groups. Data are expressed as mean values ± standard deviations (***P < 0.001).

Figure 6 (a) Hemolysis analysis of CGP NRs with different concentrations. (b-f) Hematological parameters of mice administrated with different treatments for 18 days (n = 3), including aspartate aminotransferase (AST), alanine aminotransferase (ALT), albumin (ALB), alkaline phosphatase (ALP) and creatinine (CREA). (g) H&E assay of major organs from mice.

 扫一扫看文章

扫一扫关注我们
 DownLoad:
 下载:
下载:
 下载:
下载: