Citation:
Jingwen Li, Junan Pan, Weinan Yin, Yuntao Cai, Hao Huang, Yuhao He, Gu Gong, Ye Yuan, Chengpeng Fan, Qingfeng Zhang, Longlu Wang. Recent status and advanced progress of tip effect induced by micro-nanostructure[J]. Chinese Chemical Letters,
2023, 34(8): 108049.
doi:
10.1016/j.cclet.2022.108049
Recent status and advanced progress of tip effect induced by micro-nanostructure
English
Recent status and advanced progress of tip effect induced by micro-nanostructure
College of Electronic and Optical Engineering & College of Flexible Electronics (Future Technology), Nanjing University of Posts & Telecommunications (NJUPT), Nanjing 210023, China
b.
School of Materials Science and Engineering, Xiangtan University, Xiangtan 411105, China
Received Date:
03 October 2022 Accepted Date:
06 December 2022 Revised Date:
16 October 2022 Available Online:
15 August 2023
Abstract:
The unique structural features represented by micro-nanoneedle tip structure reflect wonderful physical and chemical properties. The tip effect includes the concentration of energy such as electrons, photons and magnetism in the tip region, which has promising applications in the fields of energy conversion, water capture, environmental restoration and so on. In this review, a comprehensive and systematic summary of the latest advances in the application of the tip effect in different fields is provided. Utilizing advanced Finite Difference Time Domain simulation, we further propose our understanding of the fundamental mechanism of the tip effect induced by micro-nanostructure. However, we need to forge the present study to further reveal the essential law of the tip effect from the perspective of theoretical calculations. This review would provide a solid foundation for further development and application of the tip effect.
As known to all, certain basic structure control can give materials extraordinary properties [1]. Micro-nano structures could regulate the materials at the nanoscale [2], which may change the original characteristics of materials and make them exhibit various physical and chemical properties such as surface effect [3], small size effect [4] and macroscopic quantum tunneling effect [5]. Micro-nano structural materials have been widely used in semiconductors [6], telecommunication [7], life sciences [8] and other fields [9-12]. Among them, there is a nanoneedle structure, which has great application prospects in the fields of catalysis [13-16] and bionics [17,18] because of its unique conical shape. As early as the 18th century, Franklin discovered the point discharge [19], namely the charge is concentrated in the tip region with large curvature, resulting in a sharp increase in the electric field intensity, which causes the air near the tip to be ionized and produce gas discharge. Using this principle, Franklin further invented the lightning conductor [20], inspiring subsequent research on the tip effect.
The tip effect refers to the aggregation of energy such as electrons, photons, and magnetism in the tip region with large curvature, resulting in locally enhanced electric, thermal and magnetic fields [21-24]. It has potential applications in catalysis [25-27], bubble collection [17], water capture [18,28,29] and pollutant treatment [30]. In the field of catalysis, the tip effect can not only induce the concentration of the reaction medium at the tip [31], but also regulate the reaction energy barrier [32]. The unique gaps in the conical array also facilitate mass transfer [33,34]. For bubble collection and water capture, the Laplace pressure induced by the contact of the liquid with the tip surface [35] enables the directional mass transport. In terms of pollutant treatment, a more sufficient contact between the water flow carrying pollutants and the tip catalyst could be observed in the gap of nanoneedle array [30].
Even though the tip effect has shown great application value in the above different fields, the current research on the tip effect is still mostly limited to numerical simulation methods such as finite element simulation or indirect in-situ observation of the bubbles generated by the reaction [36-40]. It is also necessary to apply advanced theoretical calculations to disclose the fundamental mechanism of the tip effect at the atomic and molecular levels in a simulation system closer to the real environment. We summarized the latest research progress of tip effect, proposed the application advantages of micro-nanoneedle structure in catalysis, bubble collection, water capture and other fields, and prospected the future development of tip effect. This review will inspire more research on the micro-nano structure regulation strategies.
2.
Electric field effect
The traditional electric double layer theory assumes that the surface of the plate electrode is smooth and the distribution of charge or electric field on the electrode surface is uniform [41,42]. However, in practice, the electrode surface is rough. Due to the tip effect, there are different electric field distributions on the electrode surface [43]. Under the action of Coulomb repulsion, the electrostatic charge will gather to the tip of catalyst/electrode with larger curvature [44,45], resulting in a tip-enhanced electric field. This electric field induced by the micro-nanoneedle structure could aggregate reactants and adjust the thermodynamic energy barrier of the reaction, improving the activity and selectivity of the catalytic reaction [46] and showing great advantages in catalyzing carbon dioxide reduction [47], oxygen evolution [48-51] and hydrogen evolution reaction [52-55].
2.1
Tip-induced reagent concentration
Nanoneedle structure electrode could produce high local electric field at low overpotential [56,57]. This locally enhanced electric field at the tip would induce the concentration of electrolyte cations, which helps to enhance the adsorption of reactants near the active site [27].
In the process of carbon dioxide reduction reaction (CO2RR), Liu et al. [13] fabricated a nanoneedle structure to bring higher electric field under the same conditions, and the electric field intensity on the needle surface would increase with the decrease of the radius of the tip. This kind of electric field effect can obtain higher electrolyte cation concentration near the tip surface and improve the current density and reaction efficiency, realizing the clean conversion of carbon dioxide (CO2) to carbon monoxide (CO) [58].
A finite-element numerical method was used to explore the enhanced electric field intensity and cation concentration distribution at the tip. As the electrode sharpens, the electron density of the tip concentration increases, which is attributed to the migration of free electrons under electrostatic repulsion (Fig. 1A). When the tip radius of the electrode decreases from 140 mm to 5 mm, the electric field intensity at the tip increases by an order of magnitude (Fig. 1B). The surface K+ density and current density distributions on the surface of Au needles were mapped through Gouy-Chapman-Stern model (Fig. 1C). The locally enhanced electrostatic field at the tip results in a 20-fold increase in the concentration of K+ ions at the tip and a two order of magnitude increase in the current density, as shown in Fig. 1D. With the assistance of concentrated K+, CO2 is rapidly stabilized in the tip region, where CO2RR would occur (Fig. 1E). These results together indicate that tip-induced reagent concentration is a powerful way to enhance CO2RR.
Figure 1
Figure 1.
(A) Distribution of free electron density on electrode surfaces. The electrostatic field distribution around the electrode is represented by a set of arrows, where the size and direction of the electric field are represented by the size and direction of the arrows at the spatial position. The tip radius of each electrode is 5 nm (left), 60 nm (middle) and 140 nm (right). Scale bars represent 5 nm. (B) The electrostatic field intensity of the electrode tip increases with the decrease of the tip radius. (C) Current density and K+ density distributions on the surface of Au nanoneedles with tip radius of 5 nm. (D) The adsorbed K+ density and the reaction current density are functions of the electric field intensity at the nanoneedle tip. (E) K+ ions on the surface of Au nanoneedles help adsorb CO2 molecule. (F) Current intensity-voltage curves on Au nanoneedles, rods and particles through linear sweep volatmmetry scans at a scan rate of 10 mV/s. (G) CO formation Faradaic efficiencies of Au nanoneedles, rods and particles at various applied potentials. Reprinted with permission [13]. Copyright 2016, Springer Nature. Electric field distribution of the surface of (H) disordered nanoneedle arrays (CuNNs) and (I) ordered nanoneedle arrays (CuNNAs). The K+ concentration on the surface of (J) CuNNs and (K) CuNNAs. (L) Schematic diagram of C2 formation on an individual nanoneedle. (M) C2 formation Faradaic efficiencies of CuNNAs and CuNNs under different potentials. Reprinted with permission [25]. Copyright 2022, American Chemical Society.
Au needle, rod and particle electrodes were prepared by electrodeposition, and their tip curvature radii were 5 nm, 40 nm and 140 nm, respectively. Their CO2 reduction activity were measured. As shown in Fig. 1G, for Au needles, the Faradaic efficiency for CO production is higher than 95% at −0.30 V to −0.50 V, while the current density of Au rods and particles in this interval is much lower (Fig. 1F). The electrocatalytic activities of the three electrodes after normalization were also compared by testing the specific surface area of the three electrodes. The electrocatalytic activities of Au needles is 63 times that of the Au rods and 112 times that of the Au particles.
In addition, annealing, etching, plasma bombardment and other treatments were carried out on the surface of Au needles to change the surface structure. However, the electrochemical activity did not change significantly, indicating that the different properties of the three Au electrodes are not from the exposed crystal surface structure, but from the morphology. Through this nanoneedle structure, the intermediate products are stabilized, and the problems of poor selectivity and high overpotential in the practical application of CO2RR would be solved. However, this nanoneedle structure is made of noble metal, and its large-scale preparation and application may be hindered by its high cost.
An ordered Cu nanoneedle array was further designed [25]. The simulation results show that the ordered nanoneedle array could generate a stronger locally enhanced electric field than the disordered array (Figs. 1H and I) [59], thereby accelerating the adsorption and concentration of reaction intermediates (Figs. 1J and K) and promoting carbon–carbon (C–C) coupling to produce highly selective multi-carbon products (Fig. 1L) [60-64]. At the same time, ordered nanoneedle arrays (CuNNAs) and disordered nanoneedle (CuNNs) were prepared by template-assisted electrodeposition. The Faradaic efficiency of multi-carbon products of CuNNAs reached 59% at −1.2 V versus reversible hydrogen electrode (RHE), while that of CuNNs was only 20% (Fig. 1M). This reagent concentration caused by the tip-enhanced electric field of ordered nanoneedle arrays shows great potential in CO2 reduction, providing a new perspective for the structural design of nanocatalysts. Nevertheless, how to delicately regulate this ordered nanoneedle array and realize its large-scale application remains to be discussed.
2.2
Proximity effect
On the nanoneedle array electrode, as the distance between the adjacent nanoneedles gradually decreases, the electric field induced by the two tips would couple with each other, which further strengthens the electric field [65], producing an enrichment effect on the reagent. This enrichment is mainly determined by the distance between the nanoneedles, namely the proximity effect [66,67]. Yu et al. [31] designed a high-curvature CdS nanoneedle catalyst to induce the concentration of alkali-metal cations, dramatically enhancing the electroreduction efficiency of CO2.
Through simple microwave thermal synthesis, three CdS nanostructures with different tip curvature radii were successfully prepared by adjusting the reaction parameters (Fig. 2A). The finite element simulation shows that the decrease of the curvature radius of the tip would increase the electric field intensity near the tip, thereby enhancing the concentration of K+ ions (Fig. 2B). Moreover, it is worth noting that CdS needle arrays with small gaps could further regulate the electric field that affects the K+ concentration. As shown in Fig. 2C, the K+ concentration increases with the decrease of the gap width due to the enhancement of the electric field in the narrow gap. When the gap width is reduced from 40 nm to 10 nm, the concentration of K+ ions is increased by 28 times (Fig. 2D). These concentrated K+ ions can interact with CO2 through non-covalent characteristics, which rapidly stabilize CO2 at the tip of CdS nanoneedle, where CO2RR would occur [68,69]. Flow cell tests show that this nanoneedle arrays could achieve 95.5% Faradaic efficiency of CO formation and 212 mA/cm2 partial current density at −0.9 V (vs. RHE), far exceeding the commercial Ag/C catalyst (Figs. 2E and F). It is also revealed in Fig. 2G that the partial current density of CO increases monotonously with the increase of KOH concentration from 0.1 mol/L to 5 mol/L, leading to the high Faradaic efficiency of CO formation under high partial current density.
Figure 2
Figure 2.
(A) Schematic diagrams of electric field on the conical electrode with different curvature radii. The tip radius of each conical electrode is 24 nm (left), 14 nm (middle) and 3 nm (right). Scale bar, 5 nm. (B) Adsorbed K+ ions and the electric field intensity of the tip reveal that both adsorbed K+ ions and electrostatic field intensity increase with the decrease of the tip radius. (C) The concentration intensity of K+ ions in CdS nanoneedle gap increases with the decrease of gap distance. (D) K+ ions concentration distribution in the needle gap, showing that the concentration of K+ ions in the tip gap is enhanced. Scale bars, 10 nm, 10 nm and 15 nm. (E) The CO Faradaic efficiencies and (F) CO partial current of CdS needles and commercial Ag/C catalysts. (G) The CO production performance of CdS nanoneedles at different KOH concentrations. Reprinted with permission [31]. Copyright 2020, Wiley VCH.
This reagent concentration induced by nanoneedle structure, coupled with the proximity enrichment effect, enables efficient conversion of CO2 to CO without noble-metal catalysts and effectively suppresses the hydrogen evolution reaction. However, how to accurately regulate the distance between adjacent nanoneedles and conveniently prepare this nanoneedle array to induce the proximity effect remain a question.
2.3
Tip-deposited photocatalysis
The strong electromagnetic field at the tip could also enhance its surface lattice vibration, thereby enhancing spontaneous surface recombination and promoting the generation of active sites [70-72]. Xiao et al. [22] loaded Pt nanoparticles on the tips of bimetallic Au nanobipyramids (Au NBPs) to concentrate light energy on Pt metals with high catalytic activity and produce abundant hot carriers that can be used for catalytic reactions, extending the photocatalytic activity to visible and near-infrared regions. The transition metal Pt deposited at the tip not only exposes abundant active sites for reactant entry, but also extends the life of hot carriers to achieve efficient transfer and injection.
Single-molecule fluorescence imaging was used to investigate the photocatalytic properties of Pt-deposited Au NBPs. The effect of Pt loading position on the photocatalysis was also studied. Results show that compared with the all-Pt-deposited nanostructures (aPt-Au NBPs), the bimetallic nanostructures deposited only at the Au NBPs tip (ePt-Au NBPs) effectively maintain a strong electromagnetic field in the tip region, thus promoting the generation and transfer of hot carriers, which can improve the utilization of hot carriers in photocatalytic reactions.
Fig. 3A explains the mechanism of the improved utilization of hot carriers. Previous studies have suggested that by loading semiconductors on plasmonic nanoparticles, the separation and utilization of hot carriers could be facilitated [73-77]. With the Schottky barrier formed at the interface of the metal and semiconductor, these hot electrons could be captured into the conduction band of the semiconductor, delaying the decay process of the hot electrons returning to the metal and extending the lifespan of the electron–hole pairs accordingly [78,79]. However, in this structure, the electron transfer efficiency is comparatively low. To further improve the electron transfer efficiency, Xiao et al. found that combining plasmonic nanoparticles with transition metals (Pt) could avoid the formation of energy barriers, ulteriorly increasing the separation and utilization of hot carriers. With the assistance of transition metals, the photocatalytic activity of plasmonic nanoparticles was extended to the visible and near-infrared regions [80-82].
Figure 3
Figure 3.
(A) The photocatalytic reaction diagram of ePt-Au NBPs. Hot electrons produced by Au were aggregated and quickly transferred to PtNPs under laser irradiation. Additionally, the strong electromagnetic field in the tip region promoted the generation of additional hot electrons for subsequent photocatalytic reactions. (B) Schematic illustration of the catalytic process of silica-coated nanostructures. (C) The changes of fluorescence intensity of ePt-Au NBPs and ePt-Au NBPs@SiO2versus time were studied. (D) Determined reaction rates from Au NBPs, Au NBPs@SiO2, ePt-Au NBPs, and ePt-Au NBPs@SiO2 at a saturated [AR] concentration. Reprinted with permission [22]. Copyright 2022, American Chemical Society.
Additionally, ePt-Au NBPs exhibited faster spontaneous surface active sites remodeling induced by a strong electric field at the tip, which greatly facilitated the catalytic reaction. Finite Difference Time Domain (FDTD) method was used to calculate the electric field distribution. For aPt-Au NBPs, due to the direct energy absorption of dense Pt deposition, the surface plasmon resonance was suppressed, dramatically reducing the electric field intensity at the tip. By contrast, the ePt-Au NBPs retained the strong electric field in the tip region, facilitating the rapid accumulation of hot electrons and their efficient transfer to reactive metal reaction sites.
To confirm this argument, the side surface of ePt-Au NBPs was coated with a silica layer (ePt-Au NBPs@SiO2) to screen the active sites from Au tip (Fig. 3B, the Au tip was still exposed) [83-85]. As a control, when the Au NBPs surface was coated in a heavy layer of silica (Au NBPs@SiO2), the fluorescence burst during the turnover trajectory was sharply curbed, and the turnover rate was reduced by 73.44% (Fig. 3B (left) and D), proving that the silica layer could effectively mask the catalytic reaction sites. For the ePt-AuNBPs, after side surface coating, the turnover rates were almost the same, with only a slight decrease from 1.71 ± 0.09 s−1 to 1.59 ± 0.10 s−1 (7.02%, Figs. 3C and D). These results testify that the contribution from the tip plays a key role in the overall photocatalytic activity of ePt-AuNBPs.
This tip Pt-deposited nanobipyramids greatly improve the generation and utilization of hot carriers, which provides guidance for the design of nanostructures in photocatalysis. In practical applications, the Pt nanoparticles deposited at the tip inevitably produces a slight reduction in the original electromagnetic field of the Au metal tip, but this attenuation can be ignored under a substantial increase in photocatalytic performance. The effect of magnetic field on this photocatalysis process needs more advanced characterization and detailed elaboration.
3.
Synergistic effect of thermal and electric field
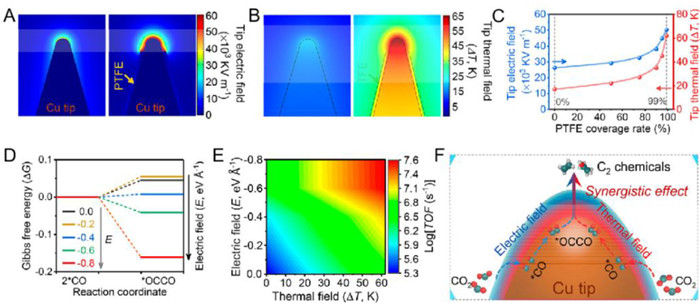
Previous studies proved that high curvature metal structures could aggregate electrons and enhance the local electron density and collision spontaneously, resulting in a local enhanced electric-thermal field at the tip [86,87]. Liu et al. [88] used polytetrafluoroethylene (PTFE), a dielectric polymer, to coat a copper nanoneedle (Cu NN) with a conformal coating, further enhancing the electric-thermal field in the tip region.
The distribution of electric field and thermal field at the tip of Cu NN with different coverage ratios of PTFE were studied by finite element simulation. Results show that with the increase of PTFE coating coverage rate from 0% to 99%, the electron density at the tip exhibits a 2-fold enhancement, resulting in an enhancement of the electric and thermal field in the tip region (Figs. 4A and B). As shown in Fig. 4C, with 99% PTFE coating, the electric and thermal field were dramatically enhanced by about 2 times (from 26.3 × 10³ kV/m to 50.3 × 10³ kV/m) and 3 times (from 17 K to 62 K).
Figure 4
Figure 4.
(A) The distribution of electric field on a pure Cu NN (left) and a Cu NN with 99% PTFE coverage (right). (B) Compared with room temperature (298 K), the distribution of thermal field on a pure Cu NN (left) and a Cu NN with 99% PTFE coverage (right). (C) The relationship between the electric-thermal field of Cu NN tip and PTFE coverage. (D) Diagrams of the Gibbs free energy (ΔG) of *CO dimerization reaction on the Cu (100) surface. (E) TOF map of *CO dimerization reaction on Cu (100) under different electric and thermal fields. (F) Synergistic effect diagram of electric and thermal field induced by nanoneedle structure on promoting C2 production. Reprinted with permission [88]. Copyright 2015, American Chemical Society.
This synergistic effect of the electric-thermal field was applied to the electrochemical reduction of CO2, which promotes the C-C coupling of *CO intermediates and successfully converts CO2 into C2 products (Fig. 4F). The *CO is a pivotal intermediate for C-C coupling, and its dimerization process of is the rate-limiting step of the CO2-to-C2 [89,90]. The results of DFT calculations show that the Gibbs free energy (ΔG) of *CO dimerization decreases with the increase of electric field (Fig. 4D), indicating that the enhance electric field is beneficial to the formation of C2 thermodynamically. To explore the kinetic process of *CO dimerization, the activation energy (ΔEa) and turnover frequency (TOF) were calculated. The ΔEa of *CO dimerization decreases with the increasing electric field, indicating that the electric field is also favorable for the formation of C2 kinetically. In addition, TOF diagram of *CO dimerization shows that as the electric-thermal field increases, TOF increases by more than two orders of magnitude (Fig. 4E). These findings prove that the electric-thermal field induced by nanoneedle structure accelerates the dimerization of *CO both in thermodynamics and kinetics.
Generally, the synergistic effect of the electro-thermal field induced by the needle tip and the dielectric polymer increases the Faraday efficiency of the C2 product to more than 86% at a partial current density higher than 250 mA/cm2, and the C2 conversion frequency is up to 11.5 ± 0.3 s−1 Cu site−1. This electro-thermal strategy of catalyst based on morphological regulation provides new insights for improving the catalytic selectivity and activity of C2 products, boosting further research on enhancing efficiency or selectivity of other electro/photocatalytic reactions.
4.
Localized electron structure regulation
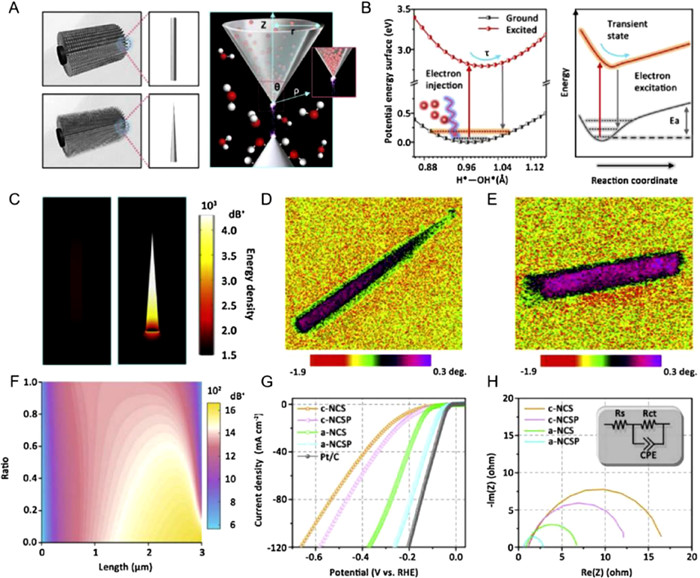
The enriched energy at the nanoneedle tip could also affect the localized electronic structure, thereby regulating the charged valence state of the material, which has great application prospects in catalytic reactions [91]. Zhou et al. [92] used the tip-induced localized electron to drive water molecules to a metastable excited state, reducing the activation energy barrier of water splitting and achieving efficient hydrogen production.
An acicular NiCo2S4-xPx nanowire array was constructed on a substrate (Fig. 5A), and the accumulated electrons would discharge and convert the adsorbed water molecules into meta-stable states, obtaining higher catalytic activity. The mechanism of localized electron- assisted H2O dissociation is illustrated in Fig. 5B. Compared with the uncharged system, the tip-induced excitation effect of the electron transfer enables water to be activated under a reduced activation barrier [93]. In order to study the influence of morphology, finite difference time domain (FDTD) was used to reveal the electric field distribution in the fabricated acicular and cylindrical nanostructures, as shown in Fig. 5C. The FDTD simulation results show that due to the Coulomb interaction, more electrons enter the acicular surface, resulting in a significantly stronger electric field distribution than the cylindrical nanowire surface.
Figure 5
Figure 5.
(A) Schematic diagrams of H2O dissociation in the tip region of acicular and cylindrical NiCo2S4-xPx arrays. (B) DFT calculation of potential energy surface of H2O on NiCo2S4-xPx surface (left) and schematic diagram of electron-assisted H2O dissociation mechanism (right). (C) Energy densities of cylindrical (left) and acicular (right) nanostructures. The EFM images of (D) single acicular and (E) cylindrical NiCo2S4-xPx nanowires. (F) The electron density as function of the sharpness of the acicular NiCo2S4-xPx nanowire. (G) Polarization curves and (H) EIS Nyquist plots for c-NCS, c-NCSP, a-NCS and a-NCSP. Reprinted with permission [92]. Copyright 2020, Elsevier.
The process of charge injection and accumulation was described in detail by electrostatic force microscopy (EFM). The EFM diagram of localized tip-induced charging reveals that most of the charges are localized at the tip of the nanoneedle, in which a charge accumulation region is represented by a green ring (Figs. 5D and E). Therefore, the electron localization process is strongly dependent on the acicular morphology. To further study the tip-enhanced effect, the relationship between the electron energy density and the sharpness of the acicular NiCo2S4-xPx nanowire array (a-NCSP) was investigated. Results show that the sharper the acicular nanowires, the greater the electron density concentrated at the tip (Fig. 5F). When the radius ratio of the cone top to the cone bottom is less than 0.15, a strong tip-enhanced effect would be obtained.
The polarization curves of a-NCSP and acicular NiCo2S4 nanowire array (a-NCS), cylindrical NiCo2S4-xPx nanowire array (c-NCSP) and cylindrical NiCo2S4 nanowire array (c-NCS) were tested. It was found that the a-NCSP showed the highest hydrogen evolution reaction (HER) catalytic performance (Fig. 5G). Meanwhile, the Tafel slope of a-NCSP with phosphorus injection drops from 121.1 mV/dec to 42.3 mV/dec. These excellent performances caused by tip-induced electrons localization can even be comparable to commercial Pt/C catalyst. The electrochemical impedance spectroscopy of the electrodes reveals that the conductivity is also greatly relative to morphology and charged dopants (Fig. 5H). Obviously, the a-NCSP exhibits the smallest charge transfer resistance. The significant decrease of charge transfer resistance indicates that the electron accumulation at the tip greatly promotes the transfer of charge and carrier.
This tip-induced charged excited state not only greatly improves the intrinsic catalytic activity of the material, but also promotes charge and mass transfer. This simple structural engineering provides new insights into the potential catalytic mechanisms and functions of catalytic properties of materials.
Li et al. [94] reported a P doped NiCo2Se4 nanoneedle array, whose doping of P atoms could optimize the adsorption/desorption energy of H* and water by regulating the electronic states, finally achieving an excellent pH-universal HER performance. Whether the regulation of this electronic states is attributed to phosphorus atom doping or tip effect, and the fundamental mechanism of electronic state regulation still needs further study.
5.
Faster mass transport
When the needles are arranged into a conical array, the unique structure of the array gap would facilitate mass transfer. Catalysts with a conical array structure could be more fully in contact with substances in the liquid, resulting in faster microfluidic flow [30]. In addition, the conical structure could also be used to catalyze various interface effects, such as solar interface evaporation [33] and plastron effect [34].
5.1
Microfluidic flow
The conical array could regulate the movement of a very small volume of fluid, namely the microfluidic flow. When flowing through the conical array, the microfluidic flow exhibits more sufficient contact with the tip and faster flow speed. Li et al. [30] constructed a conical needle-tip array by disodium ethylenediamine tetraacetate (Na2EDTA)-assisted hydrothermal method and applied it to photocatalytic degradation of sustainable pollutants in water.
A TiO2-based nanocones photocatalyst was prepared to degrade 4-chlorophenol (4-CP) pollutants in water (Fig. 6A). The intrinsic activity of catalyst with different morphologies was compared by the removal kinetics of 4-CP pollutants. Fitting the data to the pseudo-first-order kinetics model (Fig. 6B), with 20-ppm 4-CP, the normalized apparent rate constant of TiO2 nanocones catalysts was 5.05 m2 h−1 g−1, which was 3 times and 6 times higher than that of the nanorods and aggregated nanoparticle catalysts, respectively, indicating that TiO2 nanocones catalysts exhibit the highest intrinsic activity during the photoelectrocatalytic (PEC) degradation of 4-CP.
Figure 6
Figure 6.
(A) Schematic diagram of 4-CP degradation on TiO2 nanocones photocatalyst. (B) 4-CP degradation performance of different nanostructured TiO2 catalysts. The volume fraction magnitude field of water flow on (C) TiO2 NCs and (D) TiO2 NRs after different times of computational fluid dynamics simulations. The velocity magnitude contours of water flow on (E) TiO2 NCs and (F) TiO2 NRs. Reprinted with permission [30]. Copyright 2021, American Chemical Society.
To further explore the excellent performance of the nanocone catalysts, computational fluid dynamics simulation was conducted to study the effect of the catalyst morphology on the mass transfer during 4-CP degradation. As shown in Figs. 6C and D, compared with the nanorods, water volume distribution fraction for conical structures is higher and gradually grows to 100% in the interspace of conical array structures, which exhibits the sufficient contact of water with the catalysts surface. Meanwhile, the water velocity in the interspace of the nanocone arrays is 0.45 µm/s (Fig. 6E), about 1.3 times that of the nanorods (0.34 µm/s) (Fig. 6F). The faster microfluidic flow of TiO2 nanocones suggests that the conical structure favors the mass transfer of the 4-CP degradation process.
The above results highlight that the conical morphology of the photocatalysts could facilitate mass transfer and improve the performance of the PEC for the degradation of persistent contaminants, providing an effective strategy for the rational design and preparation of photoelectrodes to degrade contaminants.
5.2
Vapor diffusion
The conical array structure could be combined with the interface solar evaporation technology to improve the interface water vapor diffusion rate. Qu et al. [33] developed a reconfigurable and magnetically responsive evaporator with conical arrays through the controllable and reversible assembly of graphene-coated Fe3O4 nanoparticles (Fig. 7A).
Figure 7
Figure 7.
(A) Schematic diagram of the reconfigurable dynamic solar evaporation. (B) Macroscopic and microscopic reconfiguration of a conical array during dynamic evaporation. (C) Evaporation rate of conical arrays assembly at different sun illumination intensity. Reprinted with permission [33]. Copyright 2022, Springer Nature. (D) Conical structure characteristics of the moth's eye. (E) Schematic diagram of interfacial multi-layered evaporator for solar water evaporation and electricity generation. (F) Light absorption spectra of the evaporation in the wavelength ranging from 190 nm to 2500 nm. Reprinted with permission [100]. Copyright 2022, Springer Nature.
Under the control of adjustable magnetic field, the conical array could continuously change the tilt direction and disturb the surrounding atmosphere, which greatly promotes the water vapor diffusion. At the microscopic level, as the direction of the conical array changes, the internal nanoparticles rearrange to a disordered state [95-97], establishing an internal cycle of water, salt ions and heat (Fig. 7B). This unique magnetic field-controlled conical array gives the evaporator excellent characteristics, including satisfactory salt tolerance, sufficient water transport, recycling capacity and high evaporation rate. Compared with traditional static evaporation, the dynamic reconstruction of conical array leads to an increase of evaporation rate by more than 20% (Fig. 7C). This evaporation strategy ingeniously modulates the conical array, macroscopically disturbing the surrounding air and microscopically establishing the internal circulation of substance, which points out the direction for the structural study of the water evaporation system.
Moreover, the conical array could also increase the interface temperature and improve the evaporation efficiency by enhancing the light absorption. Inspired by the surface structure of a moth's eye (Fig. 7D) [98,99], Sun et al. [100] prepared a conical array structure to improve light capture and combined it with the hierarchical design of the multifunctional layer to prepare a efficient interfacial multi-layered evaporator (Fig. 7E). The bionic light capture conical array structure was synthesized by a unique 3D template method [101-104], which was composed of ionic hydrogel, multi-walled carbon nanotube, MXene and CsPbBr3 type perovskite. This bionic structure could reflect and absorb light multiple times, effectively extend the optical path [105] and finally achieve a high light absorption efficiency of 96.7% (Fig. 7F). Combining this conical structure with the nanofiber functional surface, the highly conductive middle layer and the ionic gel bottom layer, a water evaporation rate of 2.78 kg m−2 h−1 was achieved, and an electrical output power density of 11.8 µW/cm2 was observed under an optimized external environmental condition.
The conical array photothermal material enhances the light absorption, bringing excellent solar thermal conversion performance to this evaporator. This structural strategy of using a conical array could not only be used for water evaporation power generation, but also further inspire people to better collect and utilize a variety of natural energy sources.
5.3
Plastron effect
The plastron effect means that when a superhydrophobic surface comes into contact with water, an air layer could be fixed on the surface to convert the liquid-solid interface into a gas-liquid interface and a gas-solid interface [106,107]. Hydrophobic treatment of conical surfaces could easily induce the plastron effect and has great application potential in promoting gas capture and selective reduction of carbon dioxide.
Conical hydrophobic hairs of diving spiders could trap air, allowing the spider to breathe underwater (Fig. 8A). Inspired by this spider, David Wakerley et al. [34] synthesized a conical Cu dendrite with hydrophobic surface to improve the selectivity of C1 and C2 in carbon dioxide reduction products [108]. The conical Cu dendrites were hydrophobically treated with waxy alkanethiol. As shown in Figs. 8B and C, the contact angle test showed that the contact angle of the wettable electrode surface was 17° and increased to 153° after hydrophobically treatment. In this superhydrophobic state, the conical Cu electrode surface would be able to intercept gas [109].
Figure 8
Figure 8.
(A) The plastron effect and the three-phase interface. The contact angle measurements of (B) the wettable and (C) hydrophobic dendrite. (D) Linear sweep voltammetry of the wettable and hydrophobic dendrite (ν = 20 mV/s). (E, F) The reactant mass transport and product formation on wettable dendrite. (G, H) The reactant mass transport and product formation enhanced by three-phase interfaces on hydrophobic dendrite. Reprinted with permission [34]. Copyright 2019, Springer Nature.
On the hydrophobic Cu dendrite surface (Figs. 8G and H), the electrolyte is pushed to the tip of the hydrophobic Cu dendrite, forming an electrolyte-solid–gas three-phase interface at the electrode tip. The mass transfer of CO2 is omni-directional, while H+ is generated only from one side of the solution, which greatly increases the local CO2 concentration [24,110]. Compared with the unmodified wettable electrode (Figs. 8E and F), the hydrogen release on the surface of the hydrophobic electrode was significantly reduced in the CO2 saturated electrolyte. The Faraday efficiency of HER was reduced from 71% to 10%, while the reduction of CO2 increased from 24% to 86%. Among them, the Faraday efficiency of C2 product was 74%. However, the linear sweep voltammetry of hydrophobic and wettable Cu dendrites in CsHCO3 showed that wettable Cu dendrites could reach a current density of −5 mA/cm2 at −0.68 V, while hydrophobic Cu dendrites require −1.38 V (Fig. 8D). The catalytic activity of this hydrophobic Cu dendrite needs to be further improved.
This strategy of using a conical structure to induce the plastron effect subtly facilitates gas capture and increases catalytic selectivity. However, in this conical Cu dendrites system, CO2 needs to be introduced from the bottom of the electrolytic cell in the form of air flow, and if no air flow is introduced, the generated C1 and C2 products would be reduced. Moreover, the continuous collision between the bubbles generated in the reaction and the electrode surface will weaken the production activity of C2. These problems may become obstacles in the practical application of this system.
6.
Bubble collection
In addition to the field of catalysis, the tip effect also has application advantages in bubble collection. When contacted with liquid, the conical structure would induce a Laplacian pressure gradient, transporting the droplets directionally to the bottom of the nanoneedle [111-113]. Jiang et al. [17] fabricated the integrated bundle electrode with wettability-gradient cone electrodes (WGCEs), which had multiple functions of continuous production, directional transmission and efficient collection of hydrogen bubbles.
As shown in Fig. 9A, the wettability-gradient cone electrode (WGCE) can be conveniently prepared by gradient electroetching, hydrophobic modification and surface coating [114]. The conical morphology could induce Laplace pressure on the nanosilica particle droplet, achieving its directional movement, namely, from the tip to the root [115,116]. The number of superhydrophobic nanosilica particles should increase from the tip to the bottom surface, dividing the electrode into three regions based on the wettability (Figs. 9B-E). During the HER of a single WGCE, a large number of hydrogen bubbles could be observed in its tip region (Fig. 9G) and quickly moved to the bottom, leading to a continuous hydrogen production by the WGCE (Fig. 9F). The vertex angle of the cone electrode was investigated (Fig. 9H), indicating that the electrode with a large vertex angle has a more sufficient contact area with the electrolyte, and hence has a larger current density. For the integrated bundle electrodes, air pockets would form on the bottom (Figs. 9I and J), which could selectively absorb hydrogen bubbles and restrict electrolyte leakage. The generation, transport and collection process of the hydrogen bubbles were observed in-situ (Fig. 9K). Furthermore, the hydrogen bubbles could be removed out of the reaction system through an external pipeline instead of being released into the electrolyte.
Figure 9
Figure 9.
(A) Fabrication of the WGCE. (B) Scanning electron microscope image of WGCE. Magnified SEM images of the (C) superhydrophobic region, (D) transitional region and (E) hydrophobic region. (F) In situ observations of the bubbles on single WGCE. (G) Schematic illustration of the behaviors of hydrogen (H2) bubbles on WGCE. (H) Current densities of WGCEs with different apex angles. (I) Underwater optical photograph of three adjacent WGCEs and the air pocket among them. (J) Side-view in-situ observation of the transport and absorption of H2 bubbles on the three adjacent WGCEs. (K) In-situ observation of H2 generation, transport, and collection on the integrated WGCEs. Reprinted with permission [17]. Copyright 2021, American Chemical Society.
The cone structure utilizes the Laplace pressure to achieve multiple functions of production, transmission and collection of hydrogen bubbles, preventing bubbles from releasing into the electrolyte. This structure strategy will greatly facilitate the development of hydroelectrolysis technology and inspire people to prepare more efficient HER devices.
With the help of an external magnetic field, Yang et al. [117] regulated a flexible conical magnetic cilia array that bent to the center of the magnet, forming a small concave shape to further realize the controllable transport of bubbles. This flexible conical cilia array can also transmit bubbles of different sizes and adjust the transport speed of bubbles, providing a basis for the development and research of expanding the application of microfluidic technology in the future. Additionally, Liu et al. [118] synthesized a rough copper mesh with Cu(OH)2 nanoneedle structure that showed superhydrophilicity in air and superhydrophobicity in water to prevent bubbles from passing through the grid, achieving the separation of water and bubbles. These studies on conical structure are conducive to effectively regulating the behavior of bubbles under water, eliminating the harm caused by bubbles and even cleverly utilizing bubbles in some cases.
7.
Water capture
Similarly, the conical morphology is also widely considered to favor water collection [119]. In nature, the cactus in the desert could easily capture atmospheric water with the assistance of the needle structure, and the beetles could harvest atmospheric water by the conical bulges on their wings [120,121]. Enlightened by the surface structure of cactus spines and beetles' wings, Nie et al. [28] invented a novel asymmetric amphiphilic needle system that could collect water droplets from fog. Fig. 10A vividly shows the designed structure of the needle system. For the cactus, due to the Laplace pressure and the energy gradient on the surface of the cactus spines, fog was first captured by the tip and gradually gathered into tiny water droplets, sliding down to the bottom. Moreover, the asymmetric spines further improve droplets removal after collection. Meanwhile, the surface of the beetles' wings is an amphiphilic surface with both hydrophilic bulges and hydrophobic depressions that can not only capture atmospheric water but also transport it to the dried body. Combining the merits of the above two structures and utilizing laser-engraved fluorinated ethylene propylene membranes for Laplace driving forces, Nie et al. [28] fabricated the bionic spine arrays. The spine was covered by an amphiphilic cellulose ester coating, with its hydrophilic component facilitating droplet nucleation and hydrophobic component promoting droplet transport and removal. Furthermore, a smooth hydrophobic channel was designed to transport the captured water droplets, which would slip down along the channel under both gravity and hydrophobic repulsion.
Figure 10
Figure 10.
(A) Schematic illustration of asymmetric amphiphilic surface enlightened by the asymmetric cactus spines and the beetle amphiphilic surface. (B) The self-propelling of fog droplet on the spine structure. (C) Fog capturing by spine arrays with different inclined angles (30°, 45°, 60° and 90°). (D) Force analysis of the droplets on horizontal and inclined spines. (E) Water harvesting performance of the spine array with different inclined angles. (F) Water harvesting performance of the spine array with different widths of hydrophobic channel. (G) Water harvesting performance of the spine array with different vertical distances of the spines, and the root width of each spine is 1.2 mm. Reprinted with permission [28]. Copyright 2022, Springer Nature.
The droplet self-propelling process is presented in Fig. 10B. Force analysis indicates that when the spine is placed inclined, the gravity (G) can be decomposed into Fx and Fy along the axis (Fig. 10D), the Fx with the coaxial FL (Laplace pressure) synergistically drive the droplet removal. To investigate how the angle between the spine and hydrophobic channel influences the water harvesting efficiency, a series of experiments were designed with the angle increasing from 30° to 90° (Fig. 10C), and a highest harvesting rate was observed with an angle of 60° (Fig. 10E). The width of the smooth hydrophobic channel would also affect the water harvesting efficiency by controlling the speed of droplets slipping. As shown in Fig. 10F, the water harvesting rate was maximal (85.47 kg m−2 h−1) with a width of 2 mm. Furthermore, the vertical distances of the spines were also regulated, achieving an optimal harvesting rate with ipsilateral distances of 2 mm and contralateral distances of 1.2 mm (Fig. 10G).
In summary, the amphiphilic surface with the Laplace pressure brings from asymmetric spines structural, synergistically offering outstanding water collection efficiency to the bionic needle system. Additionally, the harvested droplets were utilized as a charge source to further trigger boost friction electric generators to provide additional charges for enhanced electrostatic adsorption effect, achieving an extremely high water collection efficiency of 93.18 kg m−2 h−1.
This system benefits from the unique structural effect of the tip, which is not only of great value for foggy areas but also for the steam recovery of cooling towers, providing a new insight for alleviating the water-energy relationship.
8.
Conclusion and outlook
As a promising micro-nano structure, the conical nanoneedle structure has attracted wide attention in the past few decades. At present, great progress has been made in understanding the physical and chemical properties of the nanoneedle structure [122-128]. Here, we summarize the recent applications of tip effect in the fields of catalysis, bubble collection, water capture and pollutant treatment. These results would lay a foundation for further research and utilization of tip effect. However, existing research on the tip effect is largely limited to numerical simulations, or the visualization of bubbles preferentially formed at the tip using in-situ high-resolution characterization, among which the tip effect is not studied inadequately. Advanced theoretical calculations are still needed to reveal the fundamental mechanism of the tip effect at the atomic and molecular levels in a more realistic environment. Additionally, in order to achieve optimal catalytic performance, the preparation of some nanoneedle arrays requires carefully regulation. Due to the continuous collision between the bubbles generated in the reaction and the conical electrode surface, the stability of conical structure also needs to be further enhanced. In summary, the practical large-scale application of tip effect still has a long way to go.
Declaration of competing interest
The authors declare that they have no known competing financial interests or personal relationships that could have appeared to influence the work reported in this paper.
Acknowledgments
This work was financially supported by the Natural Science Foundation of China (No. 51902101), Natural Science Foundation of Jiangsu Province (No. BK20201381), and Science Foundation of Nanjing University of Posts and Telecommunications (No. NY219144), and the National College Student Innovation and Entrepreneurship Training Program (No. 202210293017Z).
Figure 1
(A) Distribution of free electron density on electrode surfaces. The electrostatic field distribution around the electrode is represented by a set of arrows, where the size and direction of the electric field are represented by the size and direction of the arrows at the spatial position. The tip radius of each electrode is 5 nm (left), 60 nm (middle) and 140 nm (right). Scale bars represent 5 nm. (B) The electrostatic field intensity of the electrode tip increases with the decrease of the tip radius. (C) Current density and K+ density distributions on the surface of Au nanoneedles with tip radius of 5 nm. (D) The adsorbed K+ density and the reaction current density are functions of the electric field intensity at the nanoneedle tip. (E) K+ ions on the surface of Au nanoneedles help adsorb CO2 molecule. (F) Current intensity-voltage curves on Au nanoneedles, rods and particles through linear sweep volatmmetry scans at a scan rate of 10 mV/s. (G) CO formation Faradaic efficiencies of Au nanoneedles, rods and particles at various applied potentials. Reprinted with permission [13]. Copyright 2016, Springer Nature. Electric field distribution of the surface of (H) disordered nanoneedle arrays (CuNNs) and (I) ordered nanoneedle arrays (CuNNAs). The K+ concentration on the surface of (J) CuNNs and (K) CuNNAs. (L) Schematic diagram of C2 formation on an individual nanoneedle. (M) C2 formation Faradaic efficiencies of CuNNAs and CuNNs under different potentials. Reprinted with permission [25]. Copyright 2022, American Chemical Society.
Figure 2
(A) Schematic diagrams of electric field on the conical electrode with different curvature radii. The tip radius of each conical electrode is 24 nm (left), 14 nm (middle) and 3 nm (right). Scale bar, 5 nm. (B) Adsorbed K+ ions and the electric field intensity of the tip reveal that both adsorbed K+ ions and electrostatic field intensity increase with the decrease of the tip radius. (C) The concentration intensity of K+ ions in CdS nanoneedle gap increases with the decrease of gap distance. (D) K+ ions concentration distribution in the needle gap, showing that the concentration of K+ ions in the tip gap is enhanced. Scale bars, 10 nm, 10 nm and 15 nm. (E) The CO Faradaic efficiencies and (F) CO partial current of CdS needles and commercial Ag/C catalysts. (G) The CO production performance of CdS nanoneedles at different KOH concentrations. Reprinted with permission [31]. Copyright 2020, Wiley VCH.
Figure 3
(A) The photocatalytic reaction diagram of ePt-Au NBPs. Hot electrons produced by Au were aggregated and quickly transferred to PtNPs under laser irradiation. Additionally, the strong electromagnetic field in the tip region promoted the generation of additional hot electrons for subsequent photocatalytic reactions. (B) Schematic illustration of the catalytic process of silica-coated nanostructures. (C) The changes of fluorescence intensity of ePt-Au NBPs and ePt-Au NBPs@SiO2versus time were studied. (D) Determined reaction rates from Au NBPs, Au NBPs@SiO2, ePt-Au NBPs, and ePt-Au NBPs@SiO2 at a saturated [AR] concentration. Reprinted with permission [22]. Copyright 2022, American Chemical Society.
Figure 4
(A) The distribution of electric field on a pure Cu NN (left) and a Cu NN with 99% PTFE coverage (right). (B) Compared with room temperature (298 K), the distribution of thermal field on a pure Cu NN (left) and a Cu NN with 99% PTFE coverage (right). (C) The relationship between the electric-thermal field of Cu NN tip and PTFE coverage. (D) Diagrams of the Gibbs free energy (ΔG) of *CO dimerization reaction on the Cu (100) surface. (E) TOF map of *CO dimerization reaction on Cu (100) under different electric and thermal fields. (F) Synergistic effect diagram of electric and thermal field induced by nanoneedle structure on promoting C2 production. Reprinted with permission [88]. Copyright 2015, American Chemical Society.
Figure 5
(A) Schematic diagrams of H2O dissociation in the tip region of acicular and cylindrical NiCo2S4-xPx arrays. (B) DFT calculation of potential energy surface of H2O on NiCo2S4-xPx surface (left) and schematic diagram of electron-assisted H2O dissociation mechanism (right). (C) Energy densities of cylindrical (left) and acicular (right) nanostructures. The EFM images of (D) single acicular and (E) cylindrical NiCo2S4-xPx nanowires. (F) The electron density as function of the sharpness of the acicular NiCo2S4-xPx nanowire. (G) Polarization curves and (H) EIS Nyquist plots for c-NCS, c-NCSP, a-NCS and a-NCSP. Reprinted with permission [92]. Copyright 2020, Elsevier.
Figure 6
(A) Schematic diagram of 4-CP degradation on TiO2 nanocones photocatalyst. (B) 4-CP degradation performance of different nanostructured TiO2 catalysts. The volume fraction magnitude field of water flow on (C) TiO2 NCs and (D) TiO2 NRs after different times of computational fluid dynamics simulations. The velocity magnitude contours of water flow on (E) TiO2 NCs and (F) TiO2 NRs. Reprinted with permission [30]. Copyright 2021, American Chemical Society.
Figure 7
(A) Schematic diagram of the reconfigurable dynamic solar evaporation. (B) Macroscopic and microscopic reconfiguration of a conical array during dynamic evaporation. (C) Evaporation rate of conical arrays assembly at different sun illumination intensity. Reprinted with permission [33]. Copyright 2022, Springer Nature. (D) Conical structure characteristics of the moth's eye. (E) Schematic diagram of interfacial multi-layered evaporator for solar water evaporation and electricity generation. (F) Light absorption spectra of the evaporation in the wavelength ranging from 190 nm to 2500 nm. Reprinted with permission [100]. Copyright 2022, Springer Nature.
Figure 8
(A) The plastron effect and the three-phase interface. The contact angle measurements of (B) the wettable and (C) hydrophobic dendrite. (D) Linear sweep voltammetry of the wettable and hydrophobic dendrite (ν = 20 mV/s). (E, F) The reactant mass transport and product formation on wettable dendrite. (G, H) The reactant mass transport and product formation enhanced by three-phase interfaces on hydrophobic dendrite. Reprinted with permission [34]. Copyright 2019, Springer Nature.
Figure 9
(A) Fabrication of the WGCE. (B) Scanning electron microscope image of WGCE. Magnified SEM images of the (C) superhydrophobic region, (D) transitional region and (E) hydrophobic region. (F) In situ observations of the bubbles on single WGCE. (G) Schematic illustration of the behaviors of hydrogen (H2) bubbles on WGCE. (H) Current densities of WGCEs with different apex angles. (I) Underwater optical photograph of three adjacent WGCEs and the air pocket among them. (J) Side-view in-situ observation of the transport and absorption of H2 bubbles on the three adjacent WGCEs. (K) In-situ observation of H2 generation, transport, and collection on the integrated WGCEs. Reprinted with permission [17]. Copyright 2021, American Chemical Society.
Figure 10
(A) Schematic illustration of asymmetric amphiphilic surface enlightened by the asymmetric cactus spines and the beetle amphiphilic surface. (B) The self-propelling of fog droplet on the spine structure. (C) Fog capturing by spine arrays with different inclined angles (30°, 45°, 60° and 90°). (D) Force analysis of the droplets on horizontal and inclined spines. (E) Water harvesting performance of the spine array with different inclined angles. (F) Water harvesting performance of the spine array with different widths of hydrophobic channel. (G) Water harvesting performance of the spine array with different vertical distances of the spines, and the root width of each spine is 1.2 mm. Reprinted with permission [28]. Copyright 2022, Springer Nature.


 DownLoad:


 下载:
下载:


 下载:
下载:
