Department of Physics, Shanghai Key Laboratory of Materials Protection and Advanced Materials in Electric Power, Shanghai University of Electric Power, Shanghai 200090, China
b.
Shenzhen Key Laboratory of Interfacial Science and Engineering of Materials, State Environmental Protection Key Laboratory of Integrated Surface Water-Groundwater Pollution Control, Guangdong Provincial Key Laboratory of Soil and Groundwater Pollution Control, School of Environmental Science and Engineering, Southern University of Science and Technology, Shenzhen 518055, China
c.
Eastern Institute for Advanced Study, Eastern Institute of Technology, Ningbo 315200, China
Received Date:
27 September 2023 Accepted Date:
13 December 2023 Revised Date:
22 November 2023 Available Online:
15 September 2024
Abstract:
Formaldehyde (HCHO) as an indoor air pollutant released by new furniture and decorative materials is of great concern. Developing a self-cleaning device to remove HCHO is an ideal way to improve indoor air quality. In this study, a self-cleaning window with a multilayered structure constructed from fluorine-doped tin oxide/bismuth tungstate/resorcinol-formaldehyde resin (FTO/Bi2WO6/RF) has been fabricated, which is capable of degrading HCHO in natural indoor condition. The as-fabricated device could utilize the natural room light and promote the generation and transfer of the photocatalytic carriers in Bi2WO6, which subsequently delivers a good catalytic oxygen reduction efficiency in RF to produce hydrogen peroxide (H2O2). The as-synthesized H2O2 could further split into hydroxyl radicals (•OH), then oxide the HCHO molecules in the air. The present study demonstrates a novel and efficient strategy to fabricate a transparent multifunctional window for self-cleaning indoor gaseous pollutants, the concept is of great importance to be expanded in a broad range of indoor furniture for in-house air pollution control.
Indoor volatile toxic gases (VOCs) emitted from interior building decoration materials, such as wooden furniture, wallpaper, and paint, are the primary sources of indoor air pollution [1,2]. As one of the most representative and direct indoor VOCs, formaldehyde (HCHO) poses a significant risk to human nerve and respiratory systems [3,4]. In 2006, HCHO was classified as a major indoor air pollutant and Group I carcinogen compound by the International Agency for Research on Cancer (IARC) [5]. Furthermore, HCHO is a challenge in terms of quickly degrading and can affect indoor air quality for up to six months [6,7]. Therefore, effectively removing indoor HCHO is imperative to improve indoor air quality and protect human health [8]. Among various methods reported for HCHO purification [9–11], adsorption is widely used owing to its easy operation and low cost. However, the adsorbed HCHO may re-release from the adsorbent to the environment, resulting in a secondary cycle of pollution [12,13]. Thermal catalysis can mineralize HCHO into non-toxic products such as CO2 and H2O; however, high energy consumption is required, restricting its application for indoor air purification under natural conditions [14–16]. Therefore, it is necessary to develop green and sustainable technologies to effectively degrade the indoor HCHO and control the air quality.
Photocatalytic technologies are attracting increasing attention because they convert solar energy into environmentally friendly energy carriers for pollutant degradation. Various photocatalysts have been developed to ensure cost-effective and highly efficient photocatalytic processes [12,13,17]. Although a variety of photocatalysts have been explored for HCHO degradation, most of the photocatalysts explored nowadays are powders. During the practical application in indoor room air control, these photocatalyst powders are difficult to apply and can be easily inhaled into the human body, resulting in subsequently adverse human health impact [18].
In this study, we first coated multiple layers of bismuth tungstate (Bi2WO6) and resorcinol-formaldehyde resin (RF) films onto the fluorine-doped tin oxide (FTO) substrate via continuous hydrothermal reactions to construct a photocatalytic window with a distinct sandwich structure. The multiple-layered FTO/Bi2WO6/RF thin films demonstrated high photocatalytic efficiency and strong oxidation capacity toward the effective removal of indoor HCHO gas. This work provides a new concept for designing multilayer self-cleaning windows for indoor air quality control, which paves the way for the construction of smart furniture for a sustainable environment.
To construct the self-clean window, Bi2WO6 has been coated on FTO to construct the FTO/Bi2WO6via a hydrothermal method. Briefly, 0.97 g of Bi(NO3)3·5H2O, 0.32 g of Na2WO4·2H2O, and 0.01 g of cetyltrimethylammonium bromide (CTAB) were added in 16 mL of ethylene glycol and stirred for 1 h. The mixture was transferred into a 20 mL Teflon-lined stainless autoclave. Then, an FTO substrate was fully immersed in the solution in the autoclave with the conductive surface facing upwards with a tilted angle of 45°. The autoclave was heated in a 180 ℃ oven for 16 h to enable in-situ growth of Bi2WO6 on the FTO surface. After the reaction, the high-pressure autoclave was cooled down to room temperature naturally. The obtained FTO/Bi2WO6 was washed continuously with deionized (DI) water and anhydrous ethanol under sonication and dried in an oven at 60 ℃ to obtain a white Bi2WO6 film on the FTO surface. To further fabricate FTO/Bi2WO6/RF, 0.096 g of resorcinol powder was dissolved in a mixed solution containing formaldehyde (0.135 mL), ammonia (0.050 mL), and DI water (16 mL). After stirring for 30 min, the mixture was transferred into a 20 mL Teflon-lined stainless autoclave. The previously synthesized FTO/Bi2WO6 was fully immersed in the mixture, and the temperature of the convection drying oven was adjusted to 250 ℃ and heated for 24 h. Afterward, the resulting FTO/Bi2WO6/RF was cooled down and loaded in a beaker containing acetone solution, and sonicated for 1 min. Later, it was washed repeatedly with DI water and anhydrous ethanol, and dried in a vacuum drying oven at 80 ℃ for 10 h to obtain a reddish film. The detailed details have been shown in Fig. S1 (Supporting information), and documented in the Supporting information.
Photocatalytic experiments were conducted in a 60 mL homemade glass box using a Xenon lamp as a simulated light source. The full-spectrum light source was adjusted to one sun intensity by a light intensity meter, while the visible light source was obtained by filtering the UV light from the full spectrum using a 420 nm filter. 50 mL of DI water was added to a homemade box to simulate the indoor room environment. The FTO/Bi2WO6/RF film was placed vertically on the wall of the box. The surface containing the Bi2WO6/RF was aligned in the direction of the light source. 0.5 mL of the solution was extracted from the box into a 10 mL test tube every 1 h. Then 4.5 mL of cerium sulfate solution (0.05 mol/L) was added to this test tube and shaken to make sure a homogeneous solution was obtained. The absorbance of the solution was measured in the cuvette using a ultraviolet–visible (UV–vis) spectrophotometer, while the concentration of H2O2 produced by photocatalysis was calculated using the following equation (Eq. 1):
(1)
where V0 and C0 are the volume and concentration of the prepared cerium ion solution; V1 is the volume of the test solution; C1 is the residue cerium concentration calculated from the absorbance and standard curves.
Powder X-ray diffraction (PXRD) was used to study the phase compositions of the as-synthesized different films (Fig. S2a in Supporting information). The XRD pattern of FTO/Bi2WO6/RF in Fig. 1a suggests that orthorhombic Bi2WO6 (space group B2ab (41), JCPDS 73–2020) [19] has been successfully growth on FTO, indicating a high purity of the as-prepared Bi2WO6 film [19]. Furthermore, a broad characteristic peak at approximately 20° corresponding to the amorphous RF resin has been observed, suggesting the RF resin has been successfully deposited on the film (Fig. S2b in Supporting information). To further study the morphology and elucidate the elemental distribution on FTO/Bi2WO6/RF, SEM and EDS mapping has been recorded as shown in Figs. S3a-f (Supporting information). It can be seen that the up surface of FTO/Bi2WO6/RF is covered by spherical RF resin, while all the elements are uniformly distributed within the film. To unravel the layered stacking structure of FTO/Bi2WO6/RF, a cross-sectional SEM image (Fig. 1b) has been recorded, which reveals that a sandwich structure has been preserved within FTO/Bi2WO6/RF film. The light-absorbing ability of a photocatalyst is critical to its photocatalytic activity, to study the optical properties of the as-prepared films. Solid-state UV–vis spectra have been recorded as shown in Fig. 1c. It can be seen that the absorption edge of the Bi2WO6 film was 480 nm. A steep absorption edge is observed in the visible range, indicating that Bi2WO6 presents a bandgap of 2.51 eV within the visible light area [20]. Moreover, an absorption edge of 650 nm corresponding to a bandgap energy of 1.98 eV has been also observed in Fig. 1d, this can be assigned to the charge transfer of the benzenoid units to quinoid units [21].
Figure 1
Figure 1.
(a) XRD pattern of FTO/Bi2WO6/RF. (b) Cross-sectional SEM image. (c) UV–vis diffuse reflectance spectra of Bi2WO6 and (d) RF resin. Inset: corresponding bandgaps estimated by plotting (αhv)2versus hν, where α and ν are the absorbance and wavenumber, h is the Planck constant.
Furthermore, the surface elemental species and valence states of FTO/Bi2WO6/RF were analyzed using XPS. The change in binding energy was investigated which could be inferred from the tendency of electron transfer in FTO/Bi2WO6/RF [22–24]. As shown in Fig. S4 (Supporting information), the characteristic peaks associated with C, O, W, and Bi can be found in the full spectrum, demonstrating the presence of all the destinated elements in FTO/Bi2WO6/RF. Fig. 2a shows the XPS spectra of C 1s, the binding energies at 284.7, 286.5 and 287.6 eV are attributed to the chemical bonds of the sp2 or sp3 hybridized carbon within typical C=C, C—O, and C=O groups in RF, respectively [25,26]. Fig. 2b presents the high-resolution XPS spectrum of O 1s, wherein three characteristic peaks at binding energies of 529.9, 531.4 and 533.9 eV corresponding to the Bi-O, W-O, and O—H bonds are observed, respectively [25]. Furthermore, the W 4f peaks at 33.1 and 37.1 eV and Bi 4f peak at 164.3 and 159.0 eV, corresponding to the binding energies of W 4f7/2 and W 4f5/2, [27] and Bi 4f5/2 and Bi 4f7/2 [28] in Bi2WO6, have been observed in Figs. 2c and d, respectively. For comparison, the XPS spectra of FTO/Bi2WO6/RF under visible-light irradiation have also been recorded. Significant changes in peak positions of C 1s, O 1s, W 4f, and Bi 4f have been observed, indicating variations in the electron densities after light irradiation. It is clear that under visible-light irradiation, the peak position of all the elements shows a redshift, which indicates a feasible electron transfer under light irradiation [24,29].
Figure 2
Figure 2.
XPS spectra of FTO/Bi2WO6/RF at (a) C 1s, (b) O 1s, (c) W 4f, and (d) Bi 4f core levels (Vis — the materials after light irradiation and another set without light exposure). (e) Transient photocurrent responses and (f) EIS plots of FTO/RF and FTO/Bi2WO6/RF.
In addition, the transient photocurrent of FTO/RF, FTO/Bi2WO6, and FTO/Bi2WO6/RF are shown in Fig. 2e. The photocurrent response increases significantly from 0.05 µA to 0.11 µA in FTO/Bi2WO6/RF, which is ascribed to the synergetic effects of coupling Bi2WO6/RF together. Furthermore, the electrochemical impedance spectroscopy (EIS) spectra have been recorded in Fig. 2f, and a smaller radius has been observed within FTO/Bi2WO6/RF, compared with FTO/RF and FTO/Bi2WO6, suggesting a significantly reduced charge transfer resistance and benefited to the separation and transfer of photogenerated carriers [30,31].
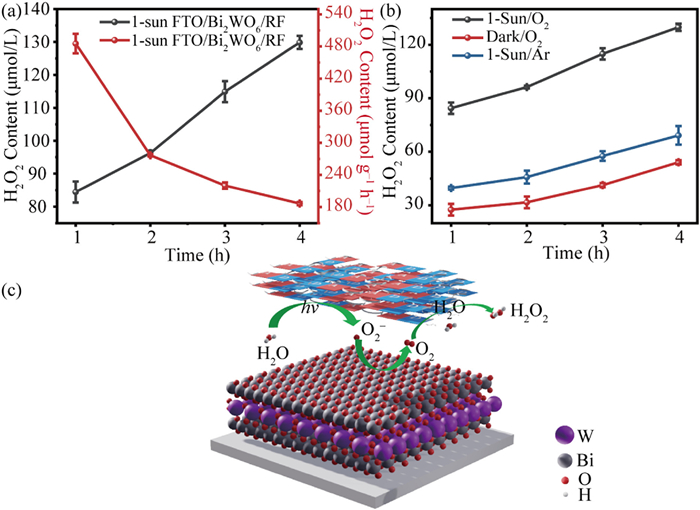
The photocatalytic activity of the FTO/Bi2WO6/RF film for H2O2 production was investigated under 1 sun (100 mW/cm2) irradiation with a simulated light source [32]. Fig. 3a shows a time-dependent H2O2 generation efficiency of FTO/Bi2WO6/RF film. The H2O2 generation concentrations are high at an early stage and continue to increase after prolonged light exposure. The overall H2O2 concentration reaches up to 130 µmol/L after 4 h, which is superior to the H2O2 concentrations generated by the photocatalyst powders as reported in the literature. Furthermore, the highest production rate of 480 µmol g−1 h−1 can be achieved at the early stage, while it decreases afterward (Table 1) [33–39]. The intrinsic reason could be ascribed to the fact that the as-generated holes (h+) in the valence band (VB) of RF are accumulated as the reaction goes on, which is not only subjected to consumption by water oxidation but also by RF autoxidation [21].
Figure 3
Figure 3.
Photocatalytic H2O2 generation of FTO/Bi2WO6/RF. (a) H2O2 concentration produced under 1 sunlight illumination and 4 h of continuous oxygen supply (black), H2O2 production rate over 4 h (red). (b) Effects of oxygen and light on the H2O2 production (black: with light and oxygen, blue: with light and without oxygen, red: with oxygen and without light). (c) Schematic diagram of oxygen cycles on Bi2WO6 and RF.
To understand the H2O2 production mechanism, the influence of light and oxygen on photocatalytic H2O2 generation efficiency was studied (Fig. 3b). The red line indicates the produced H2O2 concentration after continuous passage of oxygen in the dark condition, while the black and blue lines represent the generated H2O2 concentrations under oxygen and argon environments under 1 sun irradiation. The results demonstrate that under anaerobic conditions, a 70 µmol/L H2O2 concentration in 4 h has achieved in FTO/Bi2WO6/RF, which should be account to the fact that photocatalytic O2 production capability of Bi2WO6 combined with the oxygen reduction ability of RF, which helps to split the water molecule to generate O2, then further reduced to produce H2O2 [40], as it is well-known that Bi2WO6 is a capable of photocatalytic water oxidation to highly efficient generating O2 [41,42]. Moreover, the concentration of H2O2 produced by FTO/Bi2WO6/RF and FTO/RF under anaerobic conditions are compared and shown in Fig. S5 in Supporting information. It is clear that under the presence of Bi2WO6, the generated H2O2 concentration is 3–4 times higher than solely with RF, indicating that the oxygen produced by Bi2WO6via photocatalytic water splitting pathway plays a critical role in the efficient production of H2O2 in the FTO/Bi2WO6/RF system. It may serve as the oxygen source for photocatalytic reduction to produce H2O2. As shown in Fig. 3c, it illustrates the process of bismuth tungstate generating oxygen and the resin reducing oxygen. Water molecules adsorb onto the bottom layer of the Bi2WO6 film, where the oxygen atom of the water molecule donates an electron, forming oxygen ions (O2−). The generated O2− are released onto the catalyst surface, where they combine with holes to produce O2. O2 is then transported to the upper layer RF, where it participates in the oxygen reduction reaction with the electrons escaping from its surface, accelerating the production of H2O2. The specific formula is as follows (Eq. 2) [43,44]:
(2)
As shown in Fig. 4a, the production of H2O2 increased with the light intensity. The stronger the light intensity, the more H2O2 is produced. Fig. 4b compares the H2O2 concentrations produced by different films under the same light intensity. FTO/Bi2WO6/RF generates more H2O2 than FTO/RF and FTO/Bi2WO6. In addition, the H2O2 production ability of FTO/Bi2WO6/RF under different light intensities (0.5 and 1 sun) was investigated.
Figure 4
Figure 4.
Factors affecting photocatalytic H2O2 generation of FTO/Bi2WO6/RF. (a) H2O2 concentrations produced by FTO/Bi2WO6/RF under 1 sun and 0.5 sun of light irradiation. (b) H2O2 concentrations produced by FTO/Bi2WO6/RF, FTO/RF and FTO/Bi2WO6 under the same light intensity (1 sun). (c) Energy band diagram of Bi2WO6 and RF resin for different reactions.
To understand the energy diagram and electron transfer pathway, the energy structure of the material consisted within the film has been carefully characterized (Fig. 4c). Mott-Schottky measurements were conducted to calculate the conduction band (CB) and valence band (VB) positions of Bi2WO6 and RF. As shown in Fig. S6 (Supporting information), both Bi2WO6 and RF are n-type semiconductors with positive slopes and their flat-band potentials are −0.87 and −0.48 V, respectively. The CB positions versus the standard hydrogen electrode (SHE) were converted using the following equation (Eq. 3) [45,46]:
(3)
The calculated CB positions of Bi2WO6 and RF are −0.22 and 0.173 V, respectively [47]. Therefore, based on the respective band gaps of 2.51 and 1.98 eV for Bi2WO6 and RF, the valence band positions can be determined as 2.290 and 2.153 eV, respectively. By analyzing the energy band structure and conducting photoelectrochemical tests on the FTO/Bi2WO6/RF film, its high photocatalytic activity may be attributed to the efficient transfer of photo-induced electrons [48].
The HCHO concentration was detected by national standard method (Fig. S7 in Supporting information). Then a schematic representation of HCHO degradation test is depicted in Fig. 5a. A closed cubic box (6 × 6 × 6 cm3) was prepared with injection of HCHO gas containing FTO/Bi2WO6/RF film inside it. At intervals of every 15 min under sunlight conditions, gas samples were extracted from the box to measure the time-dependent HCHO concentration (Fig. S8 in Supporting information). The schematic diagram of the HCHO photocatalytic degradation and detection experiment is as shown in Fig. S9 (Supporting information). The concentration of HCHO in the box without FTO/Bi2WO6/RF film is around 0.18 mg/m3, higher than the national standard for indoor HCHO concentration (0.08 mg/m3). In contrast, for the box containing FTO/Bi2WO6/RF film, HCHO concentration is reduced to 0.03 mg/m3 within 1 h, below the national standard. The degradation efficiency (η) was calculated using the following equation (Eq. 4):
(4)
where C0 and Ct are the initial and after-reaction concentrations of HCHO. The degradation efficiency was as high as 84% (Fig. 5b), superior to other photocatalysts that have been reported under similar conditions. (Table S2 in Supporting information). These findings demonstrate the exceptional performance of the designed FTO/Bi2WO6/RF structure in indoor HCHO degradation in limited time-period. In this context, electron paramagnetic resonance (EPR) tests were conducted to investigate the active species responsible for formaldehyde degradation, as depicted in Fig. 5c. •OH played a crucial role. Furthermore, DFT calculations were performed to unravel the reaction kinetics (Table S3 in Supporting information) [49]. In the FTO/Bi2WO6/RF photocatalytic process, the total energy of the reactants (HCHO and hv) provided the initial energy at the outset of the reaction. The photoexcited •OH possessed a sufficiently high energy state to facilitate the degradation of formaldehyde molecules. The overall ΔG = −257.1 kcal/mol for the entire reaction, indicating that the entire reaction is proceeding spontaneously towards the formation of more stable products like H2O and CO2. A negative ΔG value implies that the reaction is thermodynamically favorable, possessing sufficient driving force and requiring no additional energy input. Therefore, it is a thermodynamically favorable process for formaldehyde degradation.
Figure 5
Figure 5.
(a) A closed box used to simulate the inhouse degradation experiment. (b) Efficiency of HCHO degradation within 1 h. (c) EPR of air in the box. (d) Schematic of indoor HCHO degradation mechanism.
Furthermore, the overall mechanism of HCHO degradation can be summarized in Fig. 5d. When sunlight irradiates on the surface of FTO/Bi2WO6/RF film, the light energy exceeds or equals the band gap energies of Bi2WO6 and RF, will promote electrons and holes separation within the photocatalyst. Heterojunction between Bi2WO6/RF facilitates transfer of photogenerated electrons from Bi2WO6 to RF. The photogenerated electrons in CB of RF are captured by O2 for two-electron reduction being converting into H2O2. Subsequently, under light exposure, the H2O2 formed on FTO/Bi2W6/RF surface will be spitted into hydroxyl radicals capable of degrading formaldehyde into water and carbon dioxide [8,29].
In summary, a facile two-step hydrothermal method has been employed to successfully construct the FTO/Bi2WO6/RF heterojunction window. This novel and highly efficient photocatalyst can degrade up to 84% of indoor HCHO within 1 h, with a degradation rate of 0.15 mg m−3 h−1. In this experiment, the national indoor formaldehyde standard (0.08 mg/m3) was achieved within 1 h. The excellent photocatalytic performance is attributed to the Bi2WO6/RF heterojunction that promotes photogenerated electron transfer from Bi2WO6 to RF. This study presents innovative approach on integrating multilayer photocatalytic materials on substrate for effective removal of indoor HCHO, with potential applicability in degrading other VOCs.
Declaration of competing interest
The authors declare that they have no known competing financial interests or personal relationships that could have appeared to influence the work reported in this paper.
Acknowledgments
This work was financially supported by the National Key Research and Development Programme of China (No. 2021YFA1202500, H.C.), Foundation of Shenzhen Science, Technology and Innovation Commission (SSTIC) (Nos. 20231122110855002, JCYJ20200109141625078, H.C.), National Natural Science Foundation of China (No. 12174246, J.L.), Shenzhen Key Laboratory of Interfacial Science and Engineering of Materials (No. ZDSYS20200421111401738, H.C.), Natural Science Funds for Distinguished Young Scholar of Guangdong Province, China (No. 2020B151502094, H.C.). We acknowledge the technical support from the SUSTech Core Research Facilities at Southern University of Science and Technology.
Supplementary materials
Supplementary material associated with this article can be found, in the online version, at doi:10.1016/j.cclet.2023.109429.
Figure 1
(a) XRD pattern of FTO/Bi2WO6/RF. (b) Cross-sectional SEM image. (c) UV–vis diffuse reflectance spectra of Bi2WO6 and (d) RF resin. Inset: corresponding bandgaps estimated by plotting (αhv)2versus hν, where α and ν are the absorbance and wavenumber, h is the Planck constant.
Figure 2
XPS spectra of FTO/Bi2WO6/RF at (a) C 1s, (b) O 1s, (c) W 4f, and (d) Bi 4f core levels (Vis — the materials after light irradiation and another set without light exposure). (e) Transient photocurrent responses and (f) EIS plots of FTO/RF and FTO/Bi2WO6/RF.
Figure 3
Photocatalytic H2O2 generation of FTO/Bi2WO6/RF. (a) H2O2 concentration produced under 1 sunlight illumination and 4 h of continuous oxygen supply (black), H2O2 production rate over 4 h (red). (b) Effects of oxygen and light on the H2O2 production (black: with light and oxygen, blue: with light and without oxygen, red: with oxygen and without light). (c) Schematic diagram of oxygen cycles on Bi2WO6 and RF.
Figure 4
Factors affecting photocatalytic H2O2 generation of FTO/Bi2WO6/RF. (a) H2O2 concentrations produced by FTO/Bi2WO6/RF under 1 sun and 0.5 sun of light irradiation. (b) H2O2 concentrations produced by FTO/Bi2WO6/RF, FTO/RF and FTO/Bi2WO6 under the same light intensity (1 sun). (c) Energy band diagram of Bi2WO6 and RF resin for different reactions.
Figure 5
(a) A closed box used to simulate the inhouse degradation experiment. (b) Efficiency of HCHO degradation within 1 h. (c) EPR of air in the box. (d) Schematic of indoor HCHO degradation mechanism.


 DownLoad:


 下载:
下载:


 下载:
下载:
