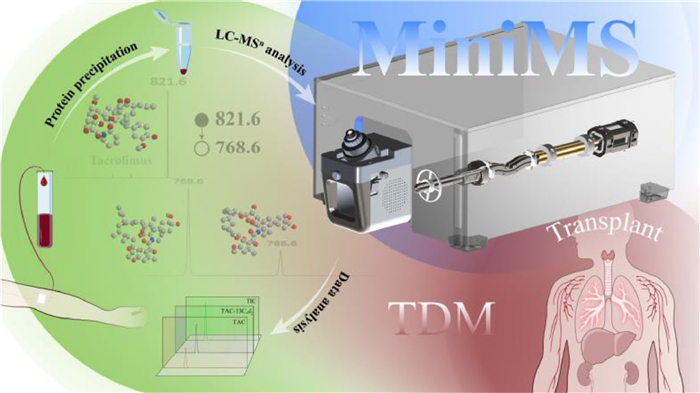
Scheme 1.
Integrated workflow of therapeutic drug monitoring using MiniMS: From sample pretreatment to data analysis.
Home-built LC-MiniMS system for quantification of tacrolimus in whole blood
Wenke Liu , Di Zhang , Ziyu Qu , Keke Yi , Shumin Wan , Zihong Ye , Xinhua Dai , Jie Xie , You Jiang , Xiang Fang

Tacrolimus (TAC), a first-line immunosuppressant in clinical practice, exerts its therapeutic effects through specific inhibition of calcineurin phosphatase activity and thereby suppresses cytokine production and effectively attenuates allograft rejection [1–3]. However, the clinical application of TAC presents considerable challenges due to three key pharmacokinetic characteristics: low oral bioavailability (typically 20%–25%), narrow therapeutic index (5–20 ng/mL), and substantial interpatient variability in drug metabolism [4,5]. These factors necessitate rigorous therapeutic drug monitoring (TDM) with long-term follow-up of trough blood concentrations (C0) to maintain levels within the therapeutic window [6]. Multiple variables influence TAC pharmacokinetics and pharmacodynamics, including genetic polymorphisms in metabolic enzymes [7–9], drug–drug interactions [10–12], and individual characteristics [13]. Maintaining therapeutic concentrations is critical for optimal outcomes—subtherapeutic levels risk acute rejection episodes, while supratherapeutic concentrations increase the likelihood of dose-dependent toxicities including nephrotoxicity, neurotoxicity, and post-transplant diabetes mellitus [14,15]. These complex pharmacokinetic challenges underscore the urgent need for two essential clinical tools—reliable analytical methods for precise blood concentration measurement and personalized dosing algorithms that integrate patient-specific variables to optimize therapeutic efficacy while minimizing adverse effects.
Currently, three methods are available for the quantification of TAC: Immunoassays (IAs), high-performance liquid chromatography (HPLC), and liquid chromatography–mass spectrometry (LC-MS/MS) [16–18]. IAs inevitably cross-react with TAC metabolites, which leads to biased assay results or even false-positive results. HPLC methods lack the sensitivity required to detect low concentrations of TAC in whole blood and are less suitable for routine use in TDM. A substantial body of research has established LC-MS/MS as the prevailing standard for TAC quantification [19,20]. The integration of LC's separation capabilities and MS's detection sensitivity has yielded a technique that exhibits remarkable specificity, sensitivity, and accuracy. This approach facilitates effective differentiation between TAC and its impurities within complex matrices. A study for improving the automation level of pretreatment developed the CLAM-LC-MS/MS system, which demonstrates extremely high accuracy in the quantitative analysis of TAC. Compared with manual pretreatment, its quality control shows lower internal and external reproducibility values, both < 7% [21]. Kocur et al.'s innovative method of combining volumetric absorption micro sampling with LC-MS/MS, which effectively overcomes matrix effects and carryover contamination, has been successfully validated for clinical monitoring of pediatric renal transplant recipients [22]. Despite their advantages, the limitations of conventional LC-MS/MS systems, which are bulky, costly, and expensive to maintain, and complex to operate, prevent their use in resource-limited clinical environments, especially in remote healthcare facilities.
Miniaturized MS can overcome this situation. Demand for application scenarios (real-time monitoring of environmental pollution, detection of toxicants, and immediate clinical diagnosis) and advances in related supporting technologies (micromachining, new vacuum systems, high-performance and low-power electronic components, and circuit integration) have combined to drive the development of miniaturization of MS. In 2006, Mini10, the first handheld mass spectrometer for monitoring volatile organic compounds [23], developed by the Cooks team at Purdue University, was a landmark event in the evolution of compact MS. Mini β [24] developed by Ouyang et al. has been successfully applied to the detection of drugs, perfluorinated alkanes, and hormones [25–27]. To achieve rapid onsite analysis, the vast majority of related studies in the past have combined environmental ionization techniques, such as paper spray, desorption electrospray ionization, and direct analysis in real time [28]. However, without chromatographic separation and purification, such analytical strategies usually lead to varying degrees of matrix effect problems. Gu et al. (2023) first developed a compact LC-MS system for quantitative evaluation of common immunosuppressive agents [29], which effectively attenuated matrix effects, but had some application limitations due to the lack of auto sampling equipment. To address these challenges, a more compact, automated, and user-friendly solution is needed while maintaining the high specificity and sensitivity of conventional LC-MS/MS systems.
In this paper, an innovative home-built liquid chromatography–miniature mass spectrometry (LC-MiniMS) system, with a compact design and accompanying programs for automatic calibration and optimization of multiple functions, was developed for routine use (Scheme 1). This work introduces a 'dual isolation' strategy, which further enhances the system's analytical capabilities, achieving high sensitivity and precision that rival conventional systems within a miniaturized and automated framework. Moreover, the automated detection of actual clinical samples after simple pretreatment was analyzed for consistency of results compared with a conventional LC-MS/MS system, and the accuracy and reliability of the system in quantifying TAC in whole blood was confirmed. The LC-MiniMS system expands the accessibility of high-precision monitoring tools while ensuring the overall performance of the instrument and can further change the practice of TDM in clinical settings.
TAC was purchased from Norna Technology (Hubei, China), and tacrolimus-13C, d2 (TAC-13C, d2) was obtained from Zzbio Co., Ltd. (Shanghai, China). Methanol and acetonitrile were sourced from Fulltime Specialized Solvents & Reagents (Anhui, China), and deionized water was obtained from Millipore Mini-Q (Merck, Germany), zinc sulfate was obtained from Macklin Biochemical (Shanghai, China), ammonium acetate was purchased from Aladdin Biochemical Technology (Shanghai, China), and anticoagulant whole blood was acquired from Yanzun Biotechnology (Shanghai, China).
A home-built miniature ion trap mass spectrometer was developed by the National Institute of Metrology, China. EClassical 3200 high-performance liquid chromatograph was purchased from Dalian Elite Analytical Instruments Co., Ltd. (China). FRESCO 21 microcentrifuge was obtained from Thermo Fisher Scientific (USA). QTRAP 6500+LC-MS/MS system was acquired from AB Sciex (USA). XPR205/A electronic analytical balances were purchased from Mettler Toledo (Switzerland). ThermoMixer C homogenizers, centrifuge 5424, and precise mechanical pipettes were obtained from Eppendorf (Germany). Vortex-Genie2 vortex mixer was sourced from Scientific Industries (USA), and MIX-25P mini mixer was provided by Hangzhou Miu Instruments Co., Ltd. (China).
Precise amounts of the immunosuppressants TAC and TAC-13C, d2 were accurately weighed and dissolved in methanol to prepare 1 mg/mL stock solutions, which were stored at −20 ℃ in a refrigerator. For ease of handling, the stock solutions were diluted 100-fold with methanol to obtain intermediate solutions of TAC and TAC-13C, d2 at 10 μg/mL, maintained under the same storage conditions.
Using a gradient dilution method, the TAC intermediate solution was further diluted with methanol to prepare working standard solutions at concentrations of 10, 20, 40, 100, 200, 400, and 1000 ng/mL. These standard solutions were stored at 4 ℃. The TAC-13C, d2 intermediate solution was diluted with acetonitrile to prepare an internal standard working solution at a concentration of 10 ng/mL.
Precisely 161.45 mg of zinc sulfate was weighed and dissolved in 20 mL of methanol and 20 mL of water by shaking to prepare a 25 mmol/L zinc sulfate extraction solution. Zinc sulfate alters the ionic strength and pH of the solution, and promotes protein denaturation and precipitation in the blood.
For sample preparation, 950 μL of human whole blood was placed in a 1.5 mL centrifuge tube. Then, 50 μL of the different concentrations of standard solutions were added, and the mixture was shaken on a shaker for 8 h to ensure thorough mixing and to allow tacrolimus to reach stable physiological distribution equilibrium within the whole blood matrix. Subsequently, 100 μL of the spiked blood solution was transferred, and 100 μL of the zinc sulfate extraction solution was added. After allowing 3 min for complete protein precipitation, 300 μL of the internal standard working solution was added, followed by vortexing for 5 min. The mixture was then centrifuged at 14,000 rpm for 6 min. Finally, 200 μL of the supernatant was aspirated, filtered through a 0.22 μm polyethersulfone membrane, and transferred to an injection vial for LC-MS analysis. The final concentrations of TAC were 0.5, 1, 2, 5, 10, 20, and 50 ng/mL, with quality control (QC) samples at concentrations of 1, 20, and 40 ng/mL.
A total of 32 whole-blood clinical samples were collected from the First People's Hospital of Lanzhou City (Ethics number: 2024A-23), and informed consent was obtained from all patients. The samples were transported on dry ice to the laboratory and stored at −80 ℃ until use. Prior to analysis, the samples were thawed at room temperature for 1 h and thoroughly mixed by shaking at 800 rpm and 37 ℃ for 30 min. Subsequent procedures were consistent with the pretreatment described above.
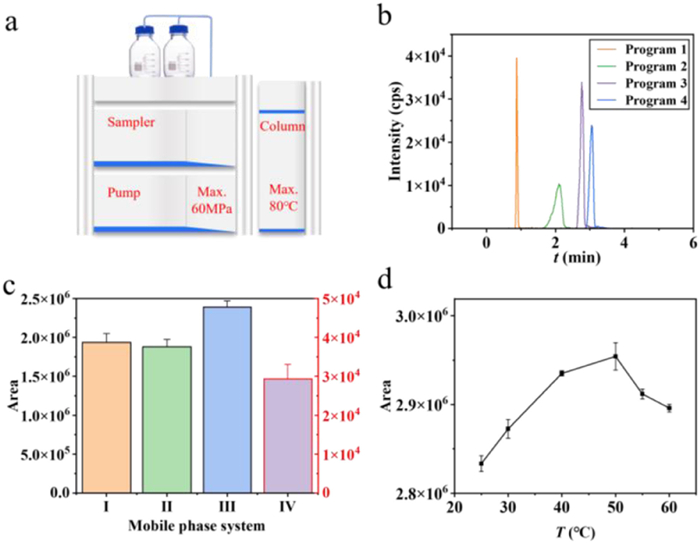
The LC-MiniMS system comprised two components: The LC module was a customized EClassical 3200 system, and the MS module was a miniature linear ion trap mass spectrometer developed by the National Institute of Metrology, China. The whole system is shown in Fig. 1a, with overall dimensions of only 100 × 57 × 48 cm3. The highly integrated circuit boards are beneficial for the maintenance and upkeep of the equipment in the later stages. Notably, the mass spectrometer is even more miniaturized than the LC module.
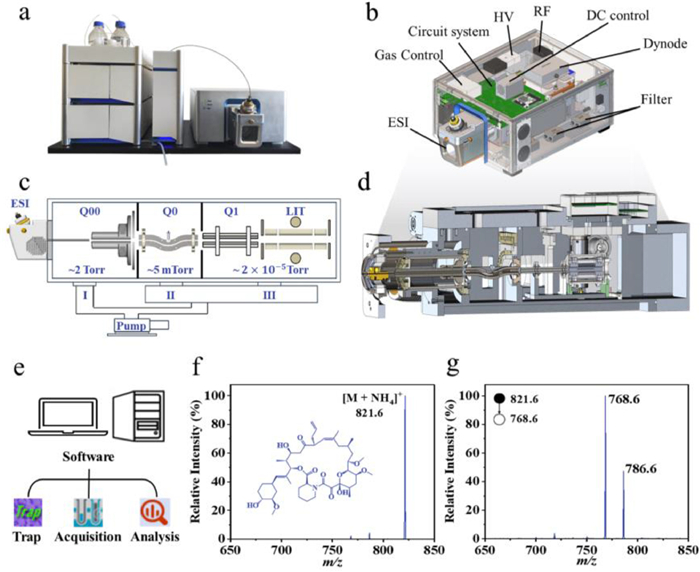
The complete 3D modeling of the miniature mass spectrometer is shown in Fig. 1b, and its main internal structure, which includes, in order from front to back, the ion source, ion guide (Q00), curved quadrupole ion guide (Q0), rectangular quadrupole (Q1), linear ion trap (LIT), detector, mechanical pump, and turbo molecular pump, is presented in Figs. 1c and d. The electronic components include a main control system, circuitry, signal acquisition system, and data processing system. For vacuum, a mechanical pump as a fore pump was combined with a turbo molecular pump to form a three-stage differential vacuum system. Ions were ionized by the ion source and upon entering the vacuum chamber, passed through two stages of high-sensitivity ion transmission systems (with vacuums of approximately ~2 Torr and ~5 mTorr) under the influence of electric fields and gas dynamics, and entered the LIT (vacuum ~ 2 × 10⁻⁵ Torr). High-energy ions collided with high-purity helium gas upon entering the LIT and were ultimately confined by electric forces within the quadrupole field. The control system precisely manipulated the ions within the LIT to achieve functions such as ion capture, cooling, excitation, dissociation, and scanning.
A suite of software applications, comprising TinyTrap, TinyAcquisition, and TinyAnalysis, was independently developed for this LC-MiniMS system (Fig. 1e). Specifically, TinyTrap was designed for mass spectrometer tuning, calibration, and optimization of mass parameters; TinyAcquisition facilitated automated sample analysis and data collection, whereas TinyAnalysis enabled the processing of acquired experimental data.
TAC is a complex macrolide immunosuppressant that lacks highly basic nitrogen groups in its chemical structure [30]. Therefore, TAC is more likely to form adducts with alkali metal ions or ammonium ions rather than undergo direct protonation. Certain amounts of sodium and potassium metal cations exist in the environment; due to their small ionic radii, they can tightly bind to the polar sites in the TAC molecule and cause changes in its fragmentation patterns. Moreover, their specific concentrations are unknown and uncontrollable, which makes them suboptimal choices for quantification. In contrast to sodium adducts formed through incidental ion exchange, ammonium adducts derive their cationic component (NH4+) from intentionally introduced volatile ammonium additives in the mobile phase. This controlled adduction mechanism exhibits predictable ionization behavior, maintains stoichiometric stability across chromatographic separation, ionization interfaces, and mass analysis stages, and demonstrates the advantage for quantitative reproducibility in electrospray ionization MS. Therefore, the ammonium adduct was selected as the precursor ion (Fig. 1f), and the characteristic fragment ion at m/z 768.6 was selected as the product ion (Fig. 1g).
The miniature mass spectrometer employed an electrospray ionization (ESI) source and operated in ion trap multiple-stage fragmentation (ITMSn) scanning mode. ESI voltage was 4500 V, ion source temperature was 350 ℃, sheath gas pressure was 3.45 × 10⁵ Pa, auxiliary gas pressure was 1.03 × 10⁵ Pa, and sweep gas pressure was 6.89 × 10³ Pa. Other mass spectrometric parameters are listed in Table 1.
 DownLoad:
CSV
DownLoad:
CSV
| Compound | Precursor ion (m/z) | Product ion (m/z) | LC-MiniMS | QTRAP 6500+ | ||||||
| IT (ms) | q | FE (%) | DP (Ⅴ) | EP (Ⅴ) | CE (Ⅴ) | CXP (Ⅴ) | ||||
| TAC | 821.6 | 768.6 | 100 | 0.30 | 16 | 20.00 | 10.62 | 30.68 | 31.94 | |
| TAC-13C, d2 | 824.6 | 771.6 | 50 | 0.35 | 16 | 38.84 | 11.89 | 30.69 | 49.93 | |
| IT: Ion-enrichment/injection times; q: q value (unitless); FE: Fragmentation energy; DP: Declustering potential; EP: Entrance potential; CE: Collision energy; CXP: Collision cell exit potential. | ||||||||||
For LC, a Phenomenex C18 column (2.6 μm, 2.1 mm × 100 mm) was used. The mobile phase consisted of solvent A (10 mmol/L ammonium acetate aqueous solution containing 0.1% acetic acid) and solvent B (methanol containing 0.1% acetic acid). Isocratic elution was performed with A: B = 1:99 at a flow rate of 0.25 mL/min. Injection volume was 5 μL, and column temperature was maintained at 40 ℃.
In the QTRAP 6500+ system, mass spectrometer was operated in multiple reaction monitoring mode. ESI voltage was 5500 V, ion source temperature was 550 ℃, nebulizer gas pressure was 3.45 × 10⁵ Pa, auxiliary heating gas pressure was 3.79 × 10⁵ Pa, and curtain gas pressure was 2.41 × 10⁵ Pa. The LC conditions differed slightly from those of the LC-MiniMS system. To optimize chromatographic peak shape, a gradient elution method was employed with the following program: 0–0.5 min, A: B = 80:20; 0.51–2 min, A: B = 0:100; 2.01–3 min, A: B = 80:20, at a flow rate of 0.35 mL/min.
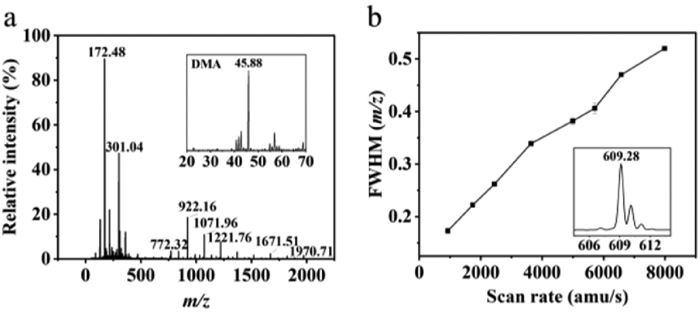
A custom-built MiniMS in Fullscan mode was utilized to record the injection of cesium sodium iodide and dimethylamine (DMA) standard solution through a needle pump at a flow rate of 5 μL/min resulted in the acquisition of Fig. 2a, which demonstrates the instrument's capacity to scan within a range of m/z 50–2000. Distinct scanning velocities employed for a 1 μg/mL reserpine standard solution led to the generation of Fig. 2b, which clearly demonstrates that, within a specific range, the full width at half maximum (FWHM) of the mass spectrum obtained by MiniMS is proportional to the scanning speed. At the maximum scan speed examined, the FWHM of the observed (m/z 609.28) mass spectrum peak remained below 0.55 amu, which exhibited the capacity to ensure higher resolution and accurate ion detection despite the compressed volume. This capacity is of particular importance for expeditious screening initiatives, where the capacity to process large quantities and the precision of detection are paramount. The LC-MiniMS system demonstrated its capability to detect target analytes with stable signals and reliable quantitative results; thus, its applicability to a wider range of clinical practices is ensured.
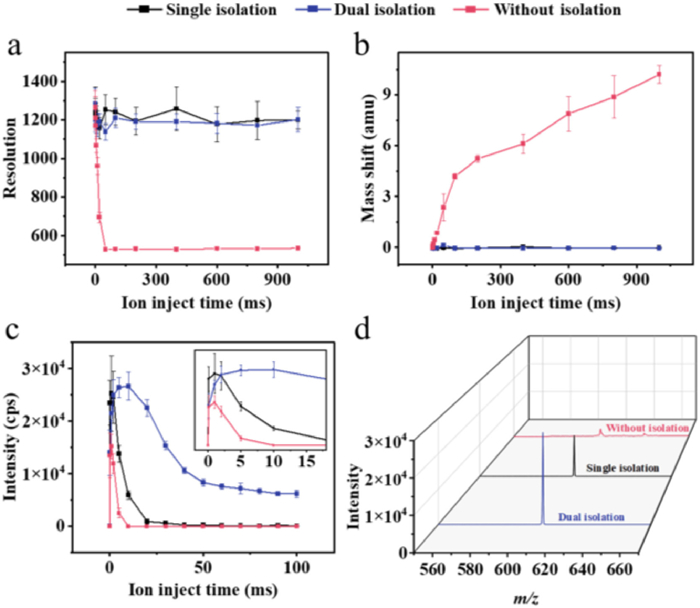
Compared with the authors' earlier investigations [31] of quadrupole tandem linear ion trap MS (Q-LIT), MiniMS utilized the ion trap furthermore for the screening of target ions owing to the miniaturization and simplification of quadrupole filtering. Consequently, MiniMS exhibited heightened vulnerability to space charge effects, wherein ions amassed in the trap engaged in electrostatic interactions that resulted in the distortion of the field employed for trap capture. To evaluate the influence of space charge effect on the performance of MS systematically, a 100 ng/mL of reserpine solution was prepared, and 10 consecutive mass spectra were acquired at different ion injection times.
In this study, the changes of signals with ion injection time across three scanning modes: The without isolation mode, where all ions (including impurities from various sources) are trapped and accumulated in the ion trap without any discrimination; the single isolation mode, where the trapped ions undergo precise selection of target ions within an isolation window of approximately m/z 1 using the stored waveform inverse Fourier transform (SWIFT) technique; and the dual isolation mode, where trapped ions are selected using a coarse-to-fine sequential approach with two SWIFT waveforms having isolation widths of approximately m/z 5 and m/z 1, respectively.
Fig. 3a illustrates no substantial discrepancy in mass resolution between single and dual isolation modes. However, the resolution in without-isolated mode exhibited a substantial decline within a brief period (~1 ms) due to the space charge effect. As illustrated in Fig. 3b, the without-isolated mode demonstrated a substantial mass shift over the same period and reached 10.2 amu for an ionization time of 1000 ms. By contrast, the isolated mass spectra showed excellent mass accuracy. Fig. 3c illustrates the variation of signal response for different ionization times. During a brief interval, the signal intensity increased with the ion injection time because the ion trap capacity limit has not yet been reached. However, once a certain time was exceeded, the accumulated high ion density in the trap exceeded the capacity of the trap, which resulted in a substantial decrease of the peak intensity. The without-isolated scanning mode exhibited the fastest accumulation of ions in the ion trap, which was predominantly influenced by the space charge effect. Notably, the maximum response value was considerably lower than those of the two other scanning modes. The single-isolated mode can expeditiously and efficiently eject impurities within 1 ms, and thereby increased the number of target ions retained in the trap and enhanced the response intensity. However, as the ion injection time was prolonged, this mode experienced a substantial decline in peak intensity. The dual isolation scanning mode effectively suppressed the influence of the space charge effect on the ion response. When the ion injection time was < 2 ms, the signal loss caused by the twice isolation ejecting the target ions to a certain extent led to a slightly lower response strength than the single isolation mode. However, the dual isolation strategy had a clear advantage in slowing down the speed of the ion accumulation in the trap within 2–100 ms. Furthermore, the dual isolation strategy can be used to maintain the signal response within a longer ion injection time to weaken the detrimental influence of space charge effect on the signal response. As illustrated in Fig. 3d, the mass spectra of the three scanning modes at an ion injection time of 5 ms demonstrated that except for the dual-isolation mode, both modes underwent considerable signal degradation due to the space-charge effect. Generally, an increased ionization time corresponds to a lower detection limit. In this comparison experiment, the ion injection times required to reach the capacity limit of the ion trap for the three scanning strategies (without isolation, single isolation, and dual isolation) were 1, 1, and 10 ms, respectively. Consequently, the dual isolation strategy was selected for the subsequent TAC experiments.
To achieve optimal sensitivity and stability, the key parameters of MS and LC were systematically optimized.
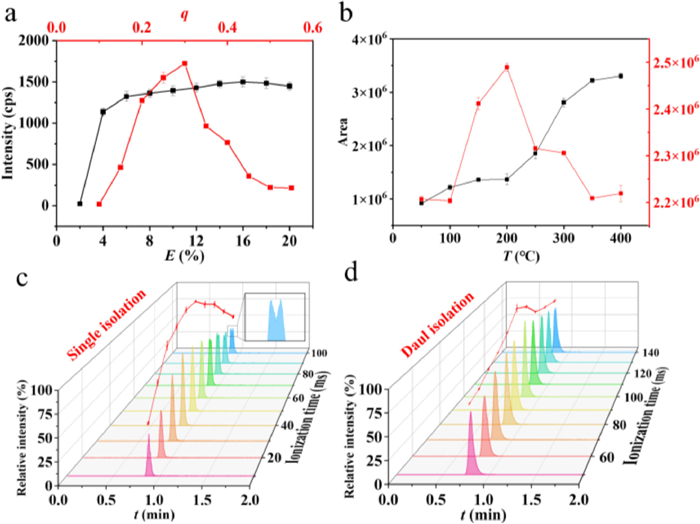
For the MS component, fragmentation q value, fragmentation energy, ion source temperature, and ion enrichment times were optimized using flow injection analysis at a flow rate of 5 μL/min. As shown in Fig. 4a, increasing the q value initially enhanced the response of TAC, followed by a decline, and the maximum ion stability and response were observed at a q value of 0.3. Additionally, the signal intensity of the characteristic fragment ion (m/z 768.8) was used to assess collision energy. The signal increased, then stabilized as fragmentation energy increased, and reached optimal intensity and stability at a collision energy of 16%. The effect of ion source temperature and interface temperature (Fig. 4b) on the signal was also investigated using a LC-MS approach. The best intensity and stability for TAC were achieved at an ion source temperature of 350 ℃ and an atmospheric pressure interface temperature of 200 ℃. A "peak collapse" in the chromatogram was observed during the ion enrichment time study of 10–100 ms (Fig. 4c) because prolonged ionization time may lead to a massive influx of ions that exceed the ion trap's capacity and space charge effects that limited further sensitivity improvements. Additionally, due to differences in ionization degrees and compound properties, in single isolation mode, when the ion enrichment time exceeded 60 ms, the peak area gradually decreased abnormally, which differed slightly from the 1 ms observed in the reserpine test. In Fig. 4d, to suppress these effects and fully enhance the detection system's sensitivity, a dual isolation strategy was employed to extend the ionization time of TAC to 100 ms. This longer ionization time achieved more complete target ion enrichment, stronger signal response, and improved detection sensitivity.
For the LC (Fig. 5a) component, four different gradient elution programs, including isocratic and gradient modes, were designed as follows: Program 1 (0–6 min, A: B = 1:99), Program 2 (0–1 min, A: B = 40:60; 2–3 min, A: B = 1:99; 3–6 min, A: B = 40:60), Program 3 (0–0.5 min, A: B = 10:80; 1–2 min, A: B = 1:99; 3–6 min, A: B = 10:80), and Program 4 (0–1 min, A: B = 10:80; 1–2 min, A: B = 1:99; 3–6 min, A: B = 10:80). Comparison of the chromatograms from these four programs (Fig. 5b) indicated that higher proportions of aqueous phase during gradient elution were detrimental to TAC elution and led to broader chromatographic peaks and reduced sensitivity. Consequently, Program 1, an isocratic elution with A: B = 1:99, was selected as the optimal elution method, which shortened the retention time, reduced the total analysis time to 3 min, and substantially enhanced analytical efficiency. Additionally, four mobile phase systems, as referenced in the literature, were evaluated (Fig. 5c and Table S1 in Supporting information). Mobile phase system Ⅲ provided the best response and was subsequently used for further experiments. The effect of column temperature, ranging from 25 to 60 ℃, on peak area was also assessed (Fig. 5d). Although larger peak areas were observed at 50 ℃ than 40 ℃, the stability of column was compromised at 50 ℃. Therefore, 40 ℃ was selected as the optimal column temperature.
The matrix effect was assessed by adding a known amount of standard to blank whole blood and pure solvent, and preparing low-, medium-, and high-concentration matrix standards and solvent standards through identical pretreatment procedures. The normalized matrix factors were calculated from the TAC and internal standard matrix factors A/B. The results are shown in Table 2, where the normalized matrix factors for low-, medium-, and high- quality control samples were 0.9814, 0.9876, and 0.9935, respectively. Fig. 6a presents that the correlation equation between the target analyte and the internal standard matrix factor is approximately y = x, with a correlation coefficient R2 = 0.9868, which indicates a strong correlation between the target analyte and the internal standard matrix factor. Fig. 6b shows that the solvent standard curve exhibited a slope of 0.0375, while the matrix standard curve showed a slope of 0.0383, with a slope difference of –0.21%. The slopes of the two standard curves are almost identical and indicate that the matrix effects at different concentrations can be considered negligible [32]. The remarkably low matrix effect demonstrated by our home-built LC-MiniMS system presents a significant advantage compared to other miniaturized mass spectrometry platforms. For instance, Ju et al. [33] developed a method for quantifying glioma biomarkers where the slope difference of matrix-matched calibration curves to standard solution calibration curves was ≤ ±30% (3.07%, –24.16% and –22.76%). Similarly, Wang et al. [34] developed a paper-spray-based portable mass spectrometry point-of-care testing method for monitoring amlodipine and benazepril blood concentrations; Pandy et al. [35] achieved rapid monitoring of cabotegravir and rilpivirine in whole blood. However, these methods typically rely on ambient ionization techniques. While these direct analysis methods offer speed, they frequently face significant challenges from matrix effects when analyzing complex biological samples like whole blood [36]. In stark contrast, the integration of an optimized liquid chromatography separation unit in our LC-MiniMS system effectively separates tacrolimus from the vast majority of matrix components prior to ionization, the results consistent with the report by Gu et al. [29]. This inherent design of our system results in a virtually negligible matrix effect, as evidenced by our near-unity normalized matrix factors and almost identical slopes of solvent and matrix standard curves. Consequently, solvent standard curve calibrators were used in this paper.
DownLoad:
CSV
| QC | A1/B1 | A2/B2 | Normalized matrix factor | Average | CV (%) |
| Low | 0.24 ± 0.03 | 0.24 ± 0.03 | 0.9814 ± 0.02 | 0.9814 | 2.21 |
| Medium | 0.26 ± 0.01 | 0.26 ± 0.00 | 0.9876 ± 0.01 | 0.9876 | 1.49 |
| High | 0.21 ± 0.02 | 0.22 ± 0.02 | 0.9934 ± 0.01 | 0.9935 | 0.73 |
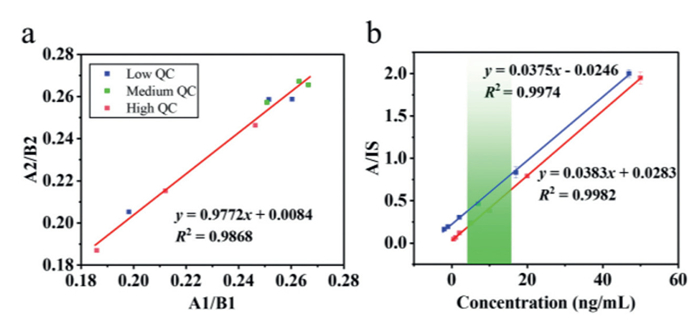
Standard curves for the specimen (blue line) and matrix (red line) were established by correlating the concentration with the ratio of analyte to internal standard (A/IS), as shown in Fig. 6b. The regression equations obtained are y = 0.0375x − 0.0246 (R2 = 0.9974) and y = 0.0383x + 0.0283 (R2 = 0.9982), indicating a linear range of 0.5–50 ng/mL, which fully covers the therapeutic window (green region) of 5–15 ng/mL. By setting the signal-to-noise ratio (S/N) of 3 as the limit of detection (LOD) and S/N of 10 as the limit of quantification (LOQ), five consecutive replicate measurements of the matrix standard were conducted. The LOD and LOQ for TAC were 0.1 and 0.3 ng/mL, respectively, with coefficients of variation (CVs) of 16.08% and 8.11%, respectively.
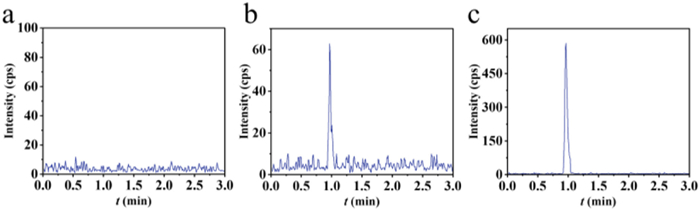
Blank whole-blood matrix, three times LOQ whole-blood standard, and actual samples were pretreated using the said method and resulted in extracted ion chromatograms as shown in Figs. 7a-c, respectively. The retention time of TAC in the whole-blood standard and actual samples was consistent at 0.99 min, with no adjacent peak interference. Fig. 6a demonstrates that no interfering components affected the quantification of TAC in the pretreated blank matrix.
The stability of whole-blood samples was evaluated under three different conditions: 24 h at 4 ℃, three freeze–thaw cycles, and 30 days at −20 ℃ (Table 3). The relative deviations ranged from −0.53% to 3.71%, and the CVs did not exceed 4.20%, which indicated satisfactory sample stability. Accuracy, expressed as recovery, was 106.10% (low QC), 102.31% (medium QC), and 99.67% (high QC). Precision, indicated by the CVs, showed intraday precisions (n = 3) of 2.61%, 1.17%, and 0.70%, and interday precisions (n = 3) of 2.90%, 1.27%, and 0.90%, that correspond to low, medium, and high-quality controls, respectively. The results are shown in Table 3.
DownLoad:
CSV
| QC | 4 ℃, 24 h | Freeze-thaw (3 times) | -20 ℃, 30 days | Recovery (%) | Precision (%) | |||||||||
| Mean (ng/mL) | Bias (%) | CV (%) | Mean (ng/mL) | Bias (%) | CV (%) | Mean (ng/mL) | Bias (%) | CV (%) | Intra-day | Inter-day | ||||
| Low | 1.00 | 0.25 | 2.87 | 1.04 | 3.71 | 4.20 | 1.02 | 2.46 | 3.43 | 106.10 | 2.61 | 2.90 | ||
| Medium | 20.19 | 0.95 | 1.01 | 20.27 | 1.37 | 2.13 | 20.12 | 0.62 | 1.72 | 102.31 | 1.17 | 1.27 | ||
| High | 40.64 | 1.60 | 0.50 | 39.94 | -0.15 | 2.07 | 39.79 | -0.53 | 0.80 | 99.67 | 0.70 | 0.90 | ||
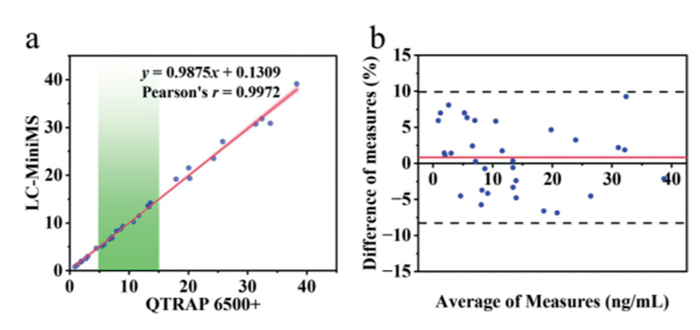
TAC was quantified in 32 clinical whole-blood samples, collected from a diverse individual of post-transplant patients, using the home-built LC-MiniMS system and a QTRAP 6500+ system. Deming regression analysis (Fig. 8a) demonstrated strong agreement between the two systems, and the fitted linear equation approached y = x and Pearson's r value of 0.9972. Bland–Altman analysis (Fig. 8b) revealed the relationship between the relative differences and the means of the two systems. The average bias of the LC-MiniMS system is 0.82%, and all sample results fall within the 95% agreement interval (±1.96 × SD: −8.29% to +9.93%) with no outliers (n = 0). These results indicate a high degree of agreement between the LC-MiniMS system and the QTRAP 6500+ system, demonstrating its suitability for the analysis of diverse clinical samples. Beyond tacrolimus, this system holds significant promise for broader application in TDM. It can be extended to the clinical monitoring of other drug categories requiring precise concentration measurement, such as other immunosuppressants, antiepileptic drugs, certain antibiotics, and cardiovascular medications, thereby providing crucial guidance for optimized clinical dosing.
The accurate quantification of TAC in whole blood was demonstrated using a home-built LC-MiniMS system. While maintaining good analytical performance, this system significantly reduces volume, reduces costs, and improves usability through integrated circuit boards and optimization software. The comprehensive feasibility assessment confirmed that the compact system maintains high precision and sensitivity, so it is suitable for TDM in clinical settings. Importantly, this paper marks the first time that the compact LC-MiniMS is employed to analyze actual clinical samples, and the results agree with those obtained using conventional commercial instruments. Its good performance verification and clinical sample comparison results make it especially suitable for medical scenarios with limited resources or decentralization, such as primary hospitals. The strong consistency between the compact system and standard methods underscores its potential to fulfill clinical needs by integrating the advantages of miniature size, cost-effectiveness, and operational simplicity. Furthermore, the inherent capability of the linear ion trap to perform multi-stage fragmentation (MSn) provides enhanced specificity and aids in distinguishing target analytes from complex matrix interferences, which is particularly valuable for TDM of diverse drug classes.
The authors declare that they have no known competing financial interests or personal relationships that could have appeared to influence the work reported in this paper.
Wenke Liu: Writing – original draft, Validation, Methodology, Formal analysis, Data curation. Di Zhang: Writing – review & editing, Supervision, Resources. Ziyu Qu: Resources. Keke Yi: Writing – review & editing, Supervision. Shumin Wan: Supervision. Zihong Ye: Supervision, Resources. Xinhua Dai: Supervision, Resources. Jie Xie: Writing – review & editing, Supervision, Resources, Project administration, Funding acquisition. You Jiang: Supervision, Resources, Methodology. Xiang Fang: Supervision, Resources.
This research was financially supported by the National Key Research and Development Program of China (Nos. 2021YFC2401100, 2022YFF0607900), the Key Research and Development Program of Shandong Province (No. 2023CXGC010506), the National Natural Science Foundation of China (No. 21927812), and the Research Project of the National Institute of Metrology (Nos. AKYRC2305, AKYZZ2325, AKYKF2408 and AKYKF2515).
Supplementary material associated with this article can be found, in the online version, at doi:
S.J. Li, J. Wang, L. Ma, et al., Cell Res. 26 (2016) 336–349. doi: 10.1038/cr.2016.14
M. Wang, J. Zhou, Q. Niu, H. Wang, Front. Pharmacol. 15 (2024) 1331800. doi: 10.3389/fphar.2024.1331800
F.J. Dumont, Curr. Med. Chem. 7 (2000) 731–748. doi: 10.2174/0929867003374723
O. Campagne, D.E. Mager, K.M. Tornatore, J. Clin. Pharmacol. 59 (2019) 309–325. doi: 10.1002/jcph.1325
C. Thongprayoon, P. Hansrivijit, K. Kovvuru, et al., J. Clin. Med. 9 (2020) 2193. doi: 10.3390/jcm9072193
E.J. Kim, S.J. Kim, K.H. Huh, et al., Sci. Rep. 11 (2021) 12114. doi: 10.1038/s41598-021-91630-4
C. Tron, F. Lemaitre, C. Verstuyft, et al., Clin. Pharmacokinet. 58 (2019) 593–613. doi: 10.1007/s40262-018-0717-7
D.A. Hesselink, R. Bouamar, L. Elens, R.H.N. van Schaik, T. van Gelder, Clin. Pharmacokinet. 53 (2014) 123–139. doi: 10.1007/s40262-013-0120-3
M.E. Mohamed, D.P. Schladt, W. Guan, et al., Am. J. Transplant. 19 (2019) 2795–2804. doi: 10.1111/ajt.15385
A.D. Leino, C. Emoto, T. Fukuda, et al., Am. J. Transplant. 19 (2019) 2944–2948. doi: 10.1111/ajt.15398
D.R. Migliozzi, N.J. Asal, Ann. Pharmacother. 54 (2020) 171–177. doi: 10.1177/1060028019871891
E.B. Rangel, Expert Opin. Drug Metab. Toxicol. 10 (2014) 1585–1605. doi: 10.1517/17425255.2014.964205
H.R. Whalen, J.A. Glen, V. Harkins, et al., Transplantation 101 (2017) 430–436. doi: 10.1097/TP.0000000000001129
S.C. Ong, R.S. Gaston, Transplantation 105 (2021) 484–495. doi: 10.1097/tp.0000000000003350
M. Yu, M. Liu, W. Zhang, Y. Ming, Curr. Drug Metab. 19 (2018) 513–522. doi: 10.2174/1389200219666180129151948
D. Lantigua, J. Trimper, B. Unal, G. Camci-Unal, Lab Chip 21 (2021) 3289–3297. doi: 10.1039/d1lc00473e
H. Gong, Q. Zeng, S. Gai, et al., Chin. Chem. Lett. 36 (2025) 110059. doi: 10.1016/j.cclet.2024.110059
P.K. Sharma, V. Mishra, S. Verma, A. Bhatia, Pertanika J. Sci. Tech. 27 (2019) 371–385.
T.R. Zijp, T.J. Knobbe, K. van Hateren, et al., J. Chromatogr. B 1222 (2023) 123709. doi: 10.1016/j.jchromb.2023.123709
C. Shu, T.F. Li, D. Li, Z.Q. Li, X.H. Xia, Chin. Chem. Lett. 33 (2022) 916–919. doi: 10.1016/j.cclet.2021.07.009
T. Shimada, D. Kawakami, A. Fujita, et al., J. Pharm. Health Care Sci. 10 (2024) 5.
A. Kocur, D. Marszałek, J. Rubik, A. Czajkowska, T. Pawiński, Pharmaceutics 15 (2023) 299. doi: 10.3390/pharmaceutics15010299
L. Gao, Q. Song, G.E. Patterson, R.G. Cooks, Z. Ouyang, Anal. Chem. 78 (2006) 5994–6002. doi: 10.1021/ac061144k
L. Li, T.C. Chen, Y. Ren, et al., Anal. Chem. 86 (2014) 2909–2916. doi: 10.1021/ac403766c
Q. Ma, H. Bai, W. Li, et al., Talanta 142 (2015) 190–196.
L. Li, Y. Zhang, L. Zhao, et al., Chem. Eng. J. 485 (2024) 149997.
Y. Zhang, L. Li, J. Li, Q. Ma, Biosens. Bioelectron. 249 (2024) 116010.
L. Zhou, J. Jiang, K. Zhao, et al., Chin. Chem. Lett. 29 (2018) 707–710.
H. Gu, G. Dai, S. Liu, et al., Chin. Chem. Lett. 34 (2023) 107715.
S. Sajjadi, M. Siahi-Shadbad, M.R. Afshar Mogaddam, ImmunoAnalysis 2 (2022) 13. doi: 10.34172/ia.2022.13
X. Fang, J. Xie, S. Chu, et al., Engineering 16 (2022) 56–64.
P. Yang, J.S. Chang, J.W. Wong, et al., J. Agric. Food Chem. 63 (2015) 5169–5177. doi: 10.1021/jf505168v
Z. Ju, X. Guo, L. Li, et al., Anal. Chem. 97 (2025) 712–720. doi: 10.1021/acs.analchem.4c05129
S. Wang, J. Wu, Q. Wang, et al., J. Pharm. Biomed. Anal. 245 (2024) 116194.
S. Pandey, Y. Hu, L.R. Bushman, et al., Anal. Bioanal. Chem. 414 (2022) 3387–3395. doi: 10.1007/s00216-022-03954-3
X. Fan, B. Jiao, X. Zhou, W. Zhang, Z. Ouyang, Anal. Chem. 97 (2025) 9111–9125. doi: 10.1021/acs.analchem.5c01223

Scheme 1 Integrated workflow of therapeutic drug monitoring using MiniMS: From sample pretreatment to data analysis.

Figure 1 (a) Physical picture of LC-MiniMS, (b) MiniMS 3D modeling, (c) simplified schematic diagram of the internal structure and vacuum system, (d) internal structure of the cavity, (e) instrument supporting software, acquired (f) primary and (g) secondary mass spectra of TAC. DC: Direct current; ESI: Electro-spray ionization; HV: High voltage; RF: Radio frequency.

Figure 2 (a) Mass spectrums of sodium iodide cesium iodide solution and DMA solution obtained by MiniMS fullscan mode scanning. (b) FWHM of reserpine (m/z 609.28) versus scan rate.

Figure 3 Trends in (a) mass resolution, (b) mass shift, and (c) signal intensity of reserpine as affected by space charge effects and (d) mass spectra of the three modes at an ion injection time of 5 ms (Red: Without isolation mode; Blue: Dual isolation mode; Black: Single isolation mode).

Figure 4 Optimization of conditions for (a) q value, fragmentation energy and (b) ion source temperature and atmospheric pressure interface temperature. Trends of chromatograms with ionization time in (c) single isolation and (d) dual isolation modes.

Figure 5 (a) Schematic diagram of LC, (b) optimization of conditions for elution procedure, (c) mobile phase system, and (d) column temperature.

Figure 6 (a) Differential analysis of TAC matrix factor versus internal standard matrix factor. (b) Comparison of solvent standard curve (blue) and matrix-matched standard curve (red).

Figure 7 Extracted ion chromatograms of TAC (821.6 → 768.6) in (a) blank matrix, (b) matrix spiked at 3 × LOQ, and (c) clinical sample.

Figure 8 (a) Deming regression analysis and (b) Bland–Altman analysis results of clinical samples between the LC-MiniMS and QTRAP 6500+ system.
Table 1. Key mass spectrometry parameters of LC-MiniMS and QTRAP 6500+.
| Compound | Precursor ion (m/z) | Product ion (m/z) | LC-MiniMS | QTRAP 6500+ | ||||||
| IT (ms) | q | FE (%) | DP (Ⅴ) | EP (Ⅴ) | CE (Ⅴ) | CXP (Ⅴ) | ||||
| TAC | 821.6 | 768.6 | 100 | 0.30 | 16 | 20.00 | 10.62 | 30.68 | 31.94 | |
| TAC-13C, d2 | 824.6 | 771.6 | 50 | 0.35 | 16 | 38.84 | 11.89 | 30.69 | 49.93 | |
| IT: Ion-enrichment/injection times; q: q value (unitless); FE: Fragmentation energy; DP: Declustering potential; EP: Entrance potential; CE: Collision energy; CXP: Collision cell exit potential. | ||||||||||
 下载: 导出CSV
Table 2. Evaluation of matrix effects in low-, medium-, and high-quality control levels.
| QC | A1/B1 | A2/B2 | Normalized matrix factor | Average | CV (%) |
| Low | 0.24 ± 0.03 | 0.24 ± 0.03 | 0.9814 ± 0.02 | 0.9814 | 2.21 |
| Medium | 0.26 ± 0.01 | 0.26 ± 0.00 | 0.9876 ± 0.01 | 0.9876 | 1.49 |
| High | 0.21 ± 0.02 | 0.22 ± 0.02 | 0.9934 ± 0.01 | 0.9935 | 0.73 |
下载: 导出CSV
Table 3. Stability assessment, accuracy, and precision of tacrolimus in whole blood.
| QC | 4 ℃, 24 h | Freeze-thaw (3 times) | -20 ℃, 30 days | Recovery (%) | Precision (%) | |||||||||
| Mean (ng/mL) | Bias (%) | CV (%) | Mean (ng/mL) | Bias (%) | CV (%) | Mean (ng/mL) | Bias (%) | CV (%) | Intra-day | Inter-day | ||||
| Low | 1.00 | 0.25 | 2.87 | 1.04 | 3.71 | 4.20 | 1.02 | 2.46 | 3.43 | 106.10 | 2.61 | 2.90 | ||
| Medium | 20.19 | 0.95 | 1.01 | 20.27 | 1.37 | 2.13 | 20.12 | 0.62 | 1.72 | 102.31 | 1.17 | 1.27 | ||
| High | 40.64 | 1.60 | 0.50 | 39.94 | -0.15 | 2.07 | 39.79 | -0.53 | 0.80 | 99.67 | 0.70 | 0.90 | ||
下载: 导出CSV

 扫一扫看文章

扫一扫关注我们
 下载:
下载: