
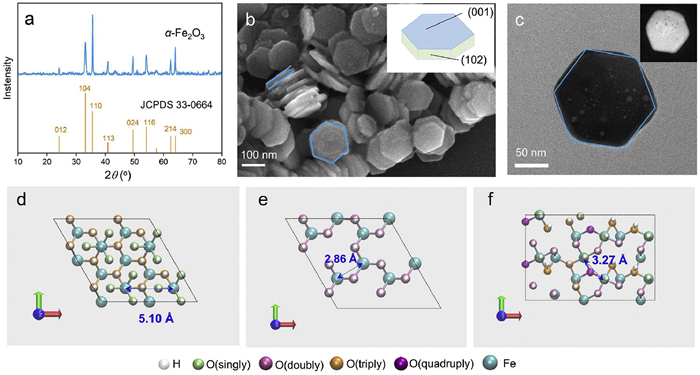
Figure 1.
XRD patterns (a), SEM (b) and TEM images (c) of α-Fe2O3 nanoplates. Hydroxylation configurations of the Fe-terminated (001) (d), O-terminated (001) (e), and O-terminated (102) (f) surfaces.


Arsenate (As(Ⅴ)) contamination poses a significant global threat to water safety and ecosystem health due to its high mobility and persistence in aquatic environments [1]. It is commonly found in surface and groundwater systems affected by agriculture, mining, and industrial activities [2], and is linked to severe health risks such as skin lesions, vascular diseases, neurological disorders, and various cancers [3,4]. In many regions, particularly in Asia and South America, arsenic levels in groundwater exceed the WHO's recommended limit of 0.01 mg/L, posing long-term risks to millions of people [1,5]. These realities underscore the urgent need for effective and practical arsenic remediation strategies that can operate under the chemically complex and variable conditions of natural water systems [6–8].
Iron oxide minerals, particularly α-Fe2O3, are promising candidates for arsenic removal due to their natural abundance, low cost, and strong affinity for As(Ⅴ) [9–12]. α-Fe2O3 has a rhombohedral crystal structure (space group R-3c), with two-thirds of its octahedral sites occupied by Fe3+, and commonly exposes facets such as (001), (012), and (110) [9,10,13–17]. Among these, the (001) facet is the most stable and frequently observed in natural settings [15,17,18]. α-Fe2O3 typically crystallizes as hexagonal nanoplates, where the (001) facets form the basal planes and the (102) facets comprise the lateral edges [11,19,20].
The adsorption behavior of As(Ⅴ) on iron oxide has been widely investigated, with pH identified as a key factor controlling retention. Generally, As(Ⅴ) adsorption decreases with increasing pH [7,21–26]. While it is well established that As(Ⅴ) forms inner-sphere surface complexes, the dominant coordination modes—monodentate versus bidentate, protonated versus deprotonated—remain under debate across different pH ranges. Some studies suggest that bidentate binuclear complexes dominate at low pH, while monodentate mononuclear complexes prevail near neutral pH [11,27,28]. In contrast, attenuated total reflection Fourier transform infrared spectroscopy (ATR-FTIR) analyses indicate that both protonated and deprotonated bidentate binuclear complexes can form across a pH range of 4.28–8.90 [29]. Extended X-ray absorption fine structure (EXAFS) studies have further revealed three potential complexation modes: bidentate mononuclear, bidentate binuclear, and monodentate mononuclear complexes [30–34], with As(Ⅴ) predominantly forming bidentate mononuclear complexes at pH 11 [35]. These inconsistencies may arise from overlooked effects of crystal facets on surface complexation [11,19,20,36]. For instance, recent studies combining spectroscopy and density functional theory (DFT) calculations suggest that As(Ⅴ) forms monodentate mononuclear complexes on α-Fe2O3 (001) and bidentate binuclear complexes on (110) at pH 7 [11].
The presence of phosphate (P(Ⅴ)) further complicates As(Ⅴ) removal. As a common oxyanion, P(Ⅴ) often occurs at much higher concentrations than As(Ⅴ) in contaminated waters [37–43]. Due to its similar tetrahedral structure and acid-base behavior (pKa1, pKa2, pKa3: As(Ⅴ) 2.2, 7.0, 11.5; P(Ⅴ) 2.2, 7.2, 12.3) [44–46], P(Ⅴ) competes strongly for adsorption sites, often reducing As(Ⅴ) removal efficiency. This challenge is further exacerbated in environments with variable pH, such as agricultural runoff (pH 6–8), acidic mine drainage (pH < 4), and industrial wastewater (pH > 10), increasing uncertainty in real-world remediation efforts. While α-Fe2O3 has demonstrated preferential adsorption of As(Ⅴ) under certain conditions [24,44,47–49], the pH-dependent modulation of this selectivity—especially in terms of adsorption kinetics and sequence—remains insufficiently understood. Structural differences in surface complexes are widely recognized as a key factor governing As(Ⅴ)/P(Ⅴ) selectivity [22,44,47,50]. For instance, higher As(Ⅴ) loadings can promote the formation of bidentate complexes, enhancing retention [47]. However, such strategies alone cannot fully mitigate selectivity loss in pH-variable systems. pH not only governs surface charge and protonation but also influences the coordination modes of adsorbed species, directly impacting competitive interactions at the mineral–water interface. A deeper comprehensive understanding of how pH affects As(Ⅴ)/P(Ⅴ) adsorption—including the roles of protonation, complexation structure, adsorption kinetics and sequence, and facet-specific behavior—is critical for advancing mechanistic insights and guiding the design of more effective remediation strategies for P(Ⅴ)-rich and chemically complex water systems.
To address these knowledge gaps and advance more effective remediation strategies, this study investigates the pH-dependent competitive adsorption of As(Ⅴ) and P(Ⅴ) on α-Fe2O3. We focus on how pH regulates protonation states and structural site accessibility, thereby modulating complexation modes, adsorption sequences, and overall As(Ⅴ) retention. Well-defined α-Fe2O3 nanoplates exposing (001) and (102) facets were synthesized and systematically characterized through a multi-scale approach, integrating batch adsorption experiments, in-situ ATR-FTIR spectroscopy, two-dimensional correlation spectroscopy (2D-COS), and DFT calculations. Our findings reveal that simple pH regulation—a practical and cost-effective strategy—can significantly enhance As(Ⅴ) retention even under P(Ⅴ)-rich conditions. By elucidating the molecular-level mechanisms linking interfacial structure, protonation-driven binding transitions, and anion selectivity, this work lays a mechanistic foundation for designing improved arsenic remediation strategies. These insights provide direct guidance for improving water treatment performance and reducing arsenic-related health risks in chemically complex aquatic environments.
Details of α-Fe2O3 nanoplate synthesis, characterization, and batch adsorption experiments are presented in Supporting information. In-situ flow cell ATR-FTIR study and 2D-COS analysis, and DFT simulations are employed to investigate the selective adsorption mechanisms of As(Ⅴ) and P(Ⅴ) on α-Fe2O3 nanoplates, with full methodological descriptions also included in Supporting information.
XRD patterns (Fig. 1a) showed that the synthesized sample was a well-crystallized α-Fe2O3, and no other impurity phases were detected. SEM and TEM images confirmed that the α-Fe2O3 exhibit a typical hexagonal shape with the (001) (78%) and (102) (22%) facets as the main exposed facets [11,19,47,51], with an average side length of ~80 nm and a thickness of ~20 nm (Figs. 1b and c) [19]. The specific surface area was measured at 11.2 m2/g [47].
The clean (001) surface predominantly features two terminations [9,17,18,52,53]: oxygen-terminated (O3-Fe-Fe-) and iron-terminated (Fe-O3-Fe-) (Fig. S1 in Supporting information), with oxygen termination accounting for ~2/3 and iron termination for ~1/3 of the total surface [15,54,55]. These terminations can coexist in distinct domains on the same crystal surface, forming terrace-and-step morphologies [53,56]. The (102) surface primarily exposes oxygen termination (Fig. S1) [57–59]. In aqueous environments, both surfaces undergo pH-dependent protonation [47,54,60], where protonated sites act as complexation sites for oxygen-containing anions via ligand exchange [27,47,61,62]. It is shown that the oxygen termination of the (001) surface has doubly coordinated hydroxyls (≡Fe2OH) with a density of 14.2 sites/nm2 (Fig. 1d and Table S1 in Supporting information), while the iron termination of the (001) surface has both singly (≡FeOH) and triply (≡Fe3OH) coordinated hydroxyls, both at 14.2 sites/nm2 (Fig. 1e and Table S1). The (102) surface contains singly (≡FeOH), doubly (≡Fe2OH), and triply (≡Fe3OH) coordinated hydroxyls, with densities of 6.1, 9.2, and 6.1 sites/nm2, respectively (Fig. 1f and Table S1). This study focuses on the ≡Fe2OH groups on the O-terminated (001) surface and the ≡FeOH groups on the Fe-terminated (001) and (102) surfaces as the primary adsorption sites for As(Ⅴ) and P(Ⅴ) [19,47,53,59,63]. These hydroxyl groups exhibit amphoteric behavior, and their protonation and deprotonation reactions can be described by the diffuse layer model (DLM), widely used for acidity constant and site density calculations in metal (hydr)oxides [61]:
|
|
(1) |
|
|
(2) |
|
|
(3) |
|
|
(4) |
The total proton concentration (Ht) was determined using acid-base titration [50,64]:
|
|
(5) |
where Ca and Cb (mol/L) represent the concentrations of HCl and NaOH, respectively, and V0, Va, and Vb (L) denote the volumes of the initial suspension, HCl, and NaOH used, respectively.
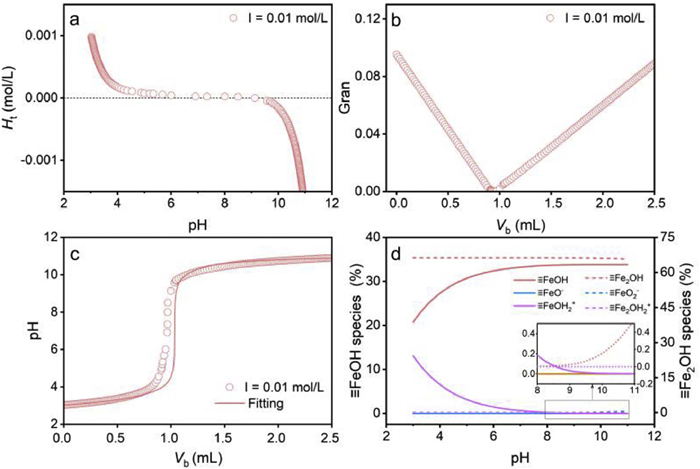
From acid-base titration experiments, the pHpzc value of α-Fe2O3 nanoplates was determined to be 8.21 (Fig. 2a), which is consistent with previous findings (pHpzc = 8.10 in 0.1 mol/L NaCl) [47] and falls within the reported range (3.5–9.2) [65]. The Gran function was used to determine surface site density [61,64]:
For pH < 7:
|
|
(6) |
For pH > 7:
|
|
(7) |
A plot of the Gran function versus NaOH titration volume yielded two linear segments intersecting at Veb1 and Veb2 (Fig. 2b), from which the surface site concentration (Hs) was calculated as:
|
|
(8) |
The surface site density (Ds) was then determined as:
|
|
(9) |
where S (m2/g) represents the specific surface area, and Cs (g/L) denotes the concentration of the α-Fe2O3 suspension. The calculated surface site density (18.9 sites/nm2) is close to the theoretical value of 12.3 sites/nm2 (Table S1).
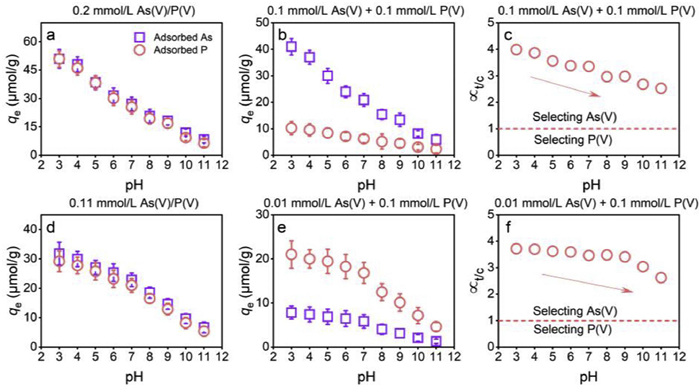
Acid-base titration data were fitted using Protofit to obtain acidity constants in 0.01 mol/L NaCl electrolyte solution (Fig. 2c): logK1 and logK2 equal to −5.96 and −16.0 for ≡FeOH, and logK1 and logK2 equal to 1.57 and −12.4 for ≡Fe2OH. These values align with previous studies [6,66,67], indicating that ≡FeOH and ≡Fe2OH are the dominant surface hydroxyl species over pH 3–11. Further modeling using MINTEQ simulated the pH-dependent distribution of surface sites by varying H+ concentrations (Fig. 2d). This information will be used in subsequent DFT calculations to refine the understanding of As(Ⅴ) and P(Ⅴ) adsorption mechanisms on α-Fe2O3 surfaces. pH-dependent adsorption experiments revealed that the individual adsorption capacities of As(Ⅴ) and P(Ⅴ) on α-Fe2O3 nanoplates were similar, both decreasing with increasing pH (Figs. 3a and d), consistent with previous studies [21,27]. However, in binary systems, α-Fe2O3 nanoplates displayed a pronounced and consistent preference for As(Ⅴ) over a broad pH range (3–11; Fig. 3b). Under acidic conditions, As(Ⅴ) adsorption was markedly favored, and the adsorption disparity between the two species gradually declined with increasing pH. This trend was quantitatively supported by binary separation factor (∝t/c) analysis, which showed a linear decrease from 4.0 to 2.5 with rising pH (Fig. 3c), confirming the pH-sensitive preferential adsorption of As(Ⅴ). Even under highly competitive conditions with a 1:10 initial molar ratio of As(Ⅴ) to P(Ⅴ), α-Fe2O3 nanoplates maintained high selectivity (∝t/c = 2.34 – 4.82, n = 11, Figs. 3e and f). These findings indicate that P(Ⅴ) enrichment does not substantially suppress As(Ⅴ) uptake [47]. Compared to widely used adsorbents, including single oxides, binary oxides, and metal-modified composites—which typically exhibit lower ∝t/c values (Table S2 in Supporting information)—α-Fe2O3 nanoplates demonstrated superior selectivity across the full tested pH range. This establishes α-Fe2O3 as an effective material for arsenic remediation in P(Ⅴ)-rich waters, such as those found in agricultural and industrial settings. Notably, the total adsorption in binary systems closely matched the sum of individual As(Ⅴ) and P(Ⅴ) adsorption capacities (Figs. 3a, b, d, and e), suggesting competition for similar surface sites without significant synergistic or inhibitory effects.
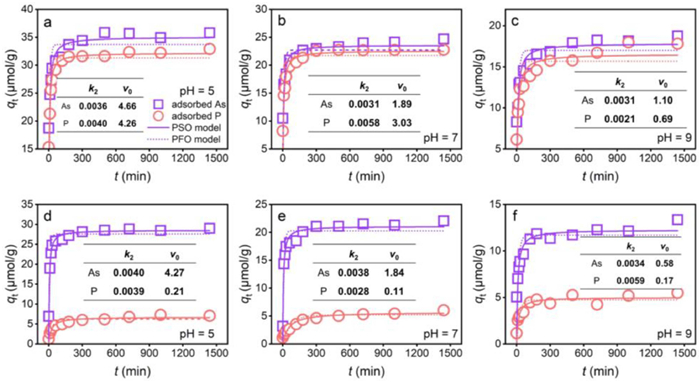
Kinetic experiments further supported the selectivity trend. In single systems, As(Ⅴ) and P(Ⅴ) exhibited nearly identical adsorption rates (Figs. 4a-c), consistent with their similar capacities. Both followed the PSO kinetic model (Table S3 in Supporting information, R2 > 0.98), suggesting that both external and internal diffusion played a role in adsorption, with rapid uptake occurring within the first 3 h. However, in binary systems, As(Ⅴ) exhibited a significantly higher adsorption rate than P(Ⅴ), as reflected in the initial adsorption rate (v0) values (Figs. 4d-f). The v0(As)/v0(P) ratio decreased from 17.8 to 3.41 as pH increased from 5 to 9, indicating that acidic conditions substantially enhanced the kinetic selectivity for As(Ⅴ) on α-Fe2O3 nanoplates.
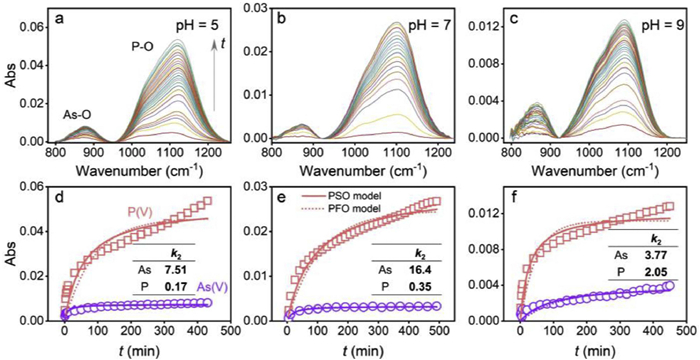
In-situ ATR-FTIR spectroscopy provided real-time validation of these findings with higher temporal resolution (Figs. 5a–c). The PSO model again best fit the adsorption kinetics in individual and competitive systems (Table S4 and Fig. S4 in Supporting information), consistent with batch experiments. The calculated PSO rate constant (k2) for As(Ⅴ) was significantly greater than for P(Ⅴ), especially under acidic conditions. The k2(As)/k2(P) ratios were 44.2, 46.8, and 1.83 at pH 5, 7, and 9, respectively (Figs. 5d–f), confirming the pH-driven acceleration of As(Ⅴ) adsorption. Collectively, these results demonstrate that α-Fe2O3 nanoplates exhibit a strong pH-dependent preference for As(Ⅴ) over P(Ⅴ), influencing both adsorption efficiency and kinetics.
We investigated the pH dependence of As(Ⅴ) and P(Ⅴ) adsorption on α-Fe2O3 nanoplates using in-situ ATR-FTIR over the range of pH 5–9 in both single-solute and competitive systems. In this range, As(Ⅴ) and P(Ⅴ) exhibited absorption bands at 750–900 cm−1 and 900–1250 cm−1 (Figs. 6a-c), respectively, corresponding to As-O-Fe and P-O-Fe vibrations indicative of stable inner-sphere complexes, consistent with previous reports [7,11,29,47,68–73]. Lowering pH from 9 to 5 shifted these bands to higher wavenumbers (Figs. 6a-c), reflecting stronger As–O–Fe interfacial bonding, consistent with previous observations [74]. This confirms that acidic conditions enhance the complexation strength of both species on α-Fe2O3 surfaces, in line with earlier studies [29,75].
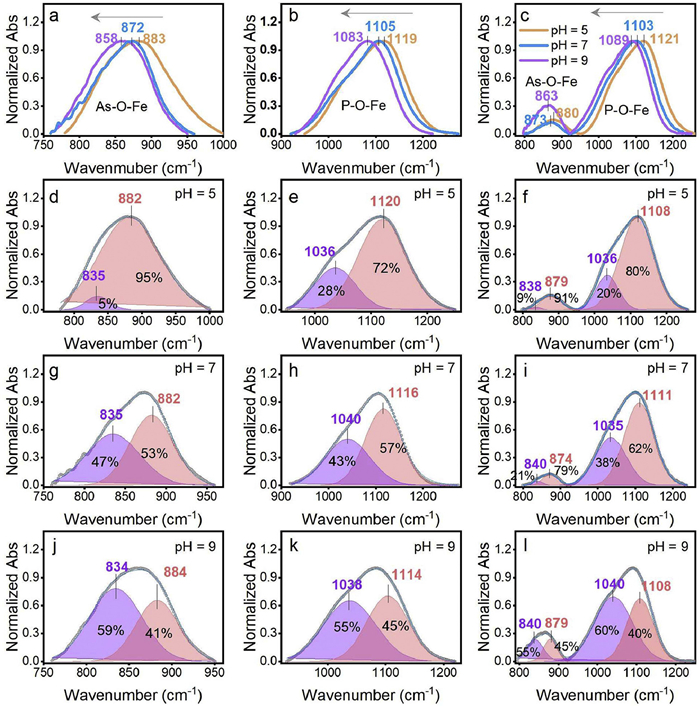
To resolve specific binding modes, the in-situ ATR-FTIR spectra were deconvoluted, yielding high-quality fits (R2 > 0.99, Figs. 6d-l) with peak assignments summarized in Table S5 (Supporting information). For As(Ⅴ), two modes at 834–840 cm−1 and 874–882 cm−1 were identified, assigned to deprotonated (MH1) and protonated (MH0) monodentate complexes, respectively [29,47]. P(Ⅴ) exhibited analogous features at 1035–1040 cm−1 and 1108–1120 cm−1, likewise attributed to deprotonated and protonated monodentate complexes [47,73]. Although the As–O and P–O regions partially overlap, these assignments are consistent with established spectral features. At pH 5, both species were dominated by monoprotonated monodentate complexes, in agreement with DLM model predictions (Fig. S13 in Supporting information). As pH increases from 5 to 9, the proportion of MH1 complexes in the single As(Ⅴ) system decreases from 95% to 41%, with MH0 species rising from 5% to 59% (Figs. 6d, g, and j). A similar trend was observed for P(Ⅴ), with MH1 decreasing from 72% to 45% and MH0 increasing from 28% to 55% (Figs. 6e, h, and k). In the binary system, the MH1 fraction of both ions declined with increasing pH, accompanied by a corresponding rise in MH0 species (Figs. 6f, i, and l). These findings suggest that pH governs the selective adsorption of As(Ⅴ) and P(Ⅴ) on α-Fe2O3 by modulating the protonation state of surface complexes. To further probe this mechanism, DFT calculations were conducted to simulate their adsorption on the (001) and (102) facets of α-Fe2O3.
In aqueous solutions, dissolved As(Ⅴ) and P(Ⅴ) exist in various protonation states depending on pH (Fig. S2). Their primary complexation sites on α-Fe2O3 include doubly coordinated hydroxyl groups on the O-terminated (001) surface, singly coordinated hydroxyls on the Fe-terminated (001) surface, and sites on the (102) surface. Across the pH range of 3–11, ligand exchange reactions yielded various surface complexation modes, including mono-, bi-, and deprotonated monodentate complexes; mono- and deprotonated bidentate complexes; and outer-sphere complexes (Table 1).

 DownLoad:
CSV
DownLoad:
CSV
| Facets | dFe-Fe (Å) | Complexation reactions | Configurations | Ea (kJ/mol) | dAs/P-Fe (Å) | dFe-O (Å) | ICOHP for Fe-O bonds | ||||
| SPIN1 | SPIN2 | ||||||||||
| Fe-terminated (001) | ~5.10a | ≡FeOH + 3H++ AsO43- → ≡FeH2OAsO3 + H2O | MH2 | −169 | 3.44 | 2.15 | −0.79 | −0.48 | |||
| ≡FeOH + 2H++ AsO43- → ≡FeHOAsO3- + H2O | MH1 | −139 | 3.49 | 2.09 | −0.91 | −0.52 | |||||
| ≡FeOH + H++ AsO43- → ≡FeOAsO32- + H2O | MH0 | −127 | 3.44 | 2.06 | −0.98 | −0.54 | |||||
| ≡FeOH + 3H++ PO43- → ≡FeH2OPO3 + H2O | MH2 | −160 | 3.38 | 2.19 | −0.70 | −0.43 | |||||
| ≡FeOH + 2H++ PO43- → ≡FeHOPO3- + H2O | MH1 | −132 | 3.40 | 2.12 | −0.83 | −0.48 | |||||
| ≡FeOH + H++ PO43- → ≡FeOPO32- + H2O | MH0 | −122 | 3.35 | 2.08 | −0.92 | −0.51 | |||||
| O-terminated (001) | ~2.86 | ≡Fe2OH + 3H++ AsO43- → ≡Fe2H2OAsO3 + H2O | MH2 | −190 | 3.46 | 1.97 | 2.13 | −0.56 | −0.41 | −1.24 | −0.81 |
| ≡Fe2OH + 2H++ AsO43- → ≡Fe2HOAsO3- + H2O | MH1 | −143 | 3.35 | 1.97 | 2.10 | −0.56 | −0.43 | −1.28 | −0.89 | ||
| ≡Fe2OH + H++ AsO43- → ≡Fe2OAsO32- + H2O | MH0 | −103 | 3.37 | 1.95 | 2.11 | −0.55 | −0.43 | −1.30 | −0.90 | ||
| ≡Fe2OH + 3H++ PO43- → ≡Fe2H2OPO3 + H2O | MH2 | −179 | 3.28 | 1.98 | 2.17 | −0.52 | −0.37 | −1.16 | −0.71 | ||
| ≡Fe2OH + 2H++ PO43- → ≡Fe2HOPO3- + H2O | MH1 | −134 | 3.27 | 1.97 | 2.14 | −0.54 | −0.39 | −1.22 | −0.78 | ||
| ≡Fe2OH + H++ PO43- → ≡Fe2OPO32- + H2O | MH0 | −97 | 3.28 | 1.98 | 2.15 | −0.54 | −0.39 | −1.24 | −0.81 | ||
| (102) | ~3.37 | ≡FeOH + 3H++ AsO43- → ≡FeH2OAsO3 + H2O | MH2 | −142 | 3.44 | 2.18 | −0.78 | −0.39 | |||
| ≡2FeOH + 3H++ AsO43- → ≡(FeO)2AsHO2 + 2H2O | BH1 | −172 | 3.20 | 1.93 | 2.12 | −0.71b | −0.94c | −1.59 | −0.43 | ||
| ≡FeOH + 2H++ AsO43-→≡FeHOAsO3- + H2O | MH1 | −114 | 3.47 | 1.99 | −1.30 | −0.51 | |||||
| ≡2FeOH + 2H++ AsO43-→≡(FeO)2AsO2- + 2H2O | BH0 | −128 | 3.22 | 1.91 | 2.13 | −0.71 | −0.93 | −1.67 | −0.42 | ||
| ≡FeOH + H++ AsO43- → ≡FeOAsO32- + H2O | MH0 | −86 | 3.47 | 1.95 | −1.42 | −0.56 | |||||
| ≡FeOH + 3H++ PO43- → ≡FeH2OPO3 + H2O | MH2 | −137 | 3.24 | 2.18 | −0.73 | −0.36 | |||||
| ≡2FeOH + 3H++ PO43- → ≡(FeO)2PHO2 + 2H2O | BH1 | −159 | 3.11 | 1.93 | 2.13 | −0.67 | −0.89 | −1.53 | −0.41 | ||
| ≡FeOH + 2H++ PO43- → ≡FeHOPO3- + H2O | MH1 | −110 | 3.34 | 1.99 | −1.24 | −0.50 | |||||
| ≡2FeOH + 2H++ PO43- → ≡(FeO)2PO2- + 2H2O | BH0 | −121 | 3.14 | 1.91 | 2.16 | −0.68 | −0.85 | −1.63 | −0.39 | ||
| ≡FeOH + H++ PO43- → ≡FeOPO32- + H2O | MH0 | −82 | 3.34 | 1.95 | −1.38 | −0.54 | |||||
| a Fe-Fe site distance between adjacent hydroxyl groups. b, c Different Fe-O bonds within the complexes. |
|||||||||||
For As(Ⅴ) adsorption, all surface complexes exhibited negative adsorption energies, indicating thermodynamic stability (Figs. 7 and 8). The dominant complexation mode varied with pH. On the (001) surface, monodentate complexes were predominant at most pH values, consistent with prior findings [11,47]. The Fe-As bond lengths for monoprotonated (MH1) and deprotonated (MH0) monodentate complexes ranged from 3.22 Å to 3.47 Å, in good agreement with EXAFS measurements (~3.27 Å at pH 7) [11]. At higher pH, lower-energy, less protonated monodentate complexes became more favorable (Fig. 7), in line with experimental observations showing decreased As(Ⅴ) uptake with increasing pH (Fig. 3). This trend was further supported by decreasing logK values derived from the DLM model (MH2: 30.2; MH1: 28.9; MH0: 23.7; HB0: 10.5; Table S7 in Supporting information). Vibrational frequency calculations revealed a red shift in As–O–Fe stretching modes with increasing pH (Figs. S14a and S15a in Supporting information), reflecting weaker surface interactions, consistent with both computed energies and in-situ ATR-FTIR spectra (Figs. 6 and 7). On the (102) surface, both monodentate and bidentate complexes formed under acidic conditions, with the latter showing enhanced stability (Fig. 8a), corroborating previous findings that bidentate structures are favored at low pH [27,49]. The As–O–Fe vibrational modes in bidentate structures appeared at lower frequencies than in monodentate ones (Fig. S16a in Supporting information), attributed to the reduced symmetry from C3v to C2v [7]. At very high pH, outer-sphere complexes were favored on both surfaces.
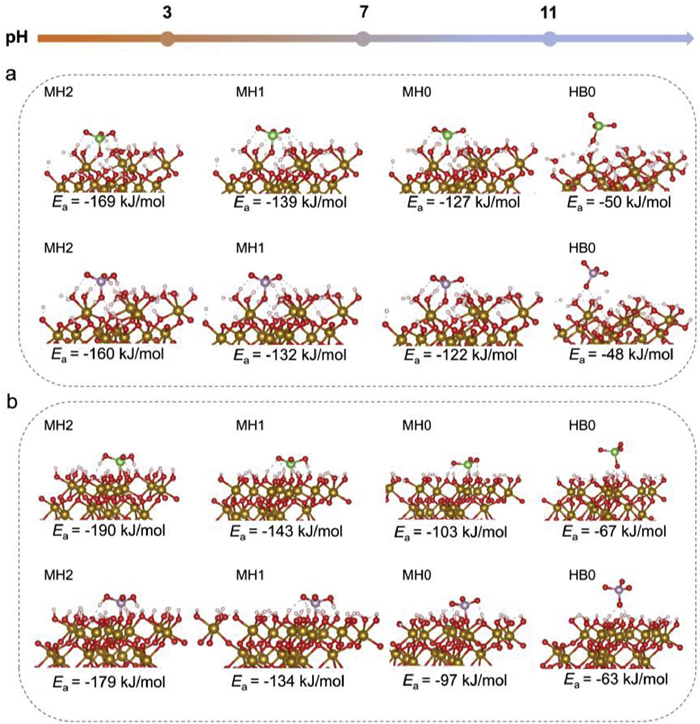
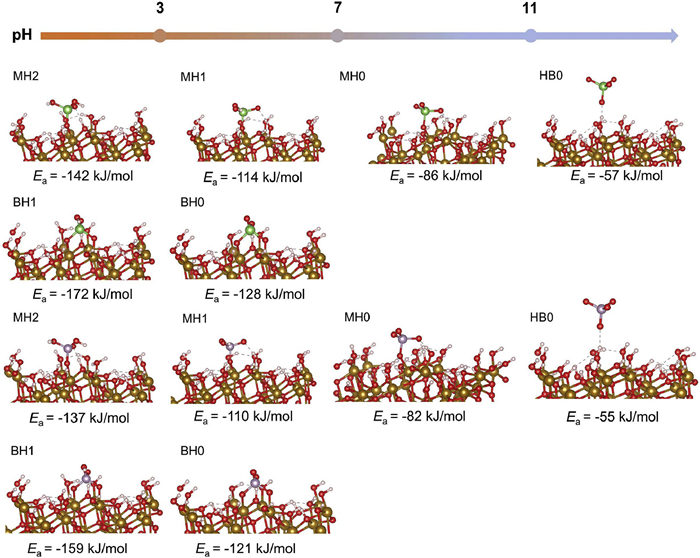
P(Ⅴ) exhibited similar adsorption behavior. All surface complexes showed negative adsorption energies, with monodentate species on the (001) surface prevailing across most pH conditions, consistent with previous reports (Fig. 7) [69]. Increasing pH promoted less protonated, lower-energy monodentate complexes (Fig. 7), matching experimental data that showed declining P(Ⅴ) uptake with rising pH (Fig. 3). DLM-derived logK values followed a similar trend (MH2: 30.1; MH1: 28.8; MH0: 23.9; HB0: 9.5; Table S7). As with As(Ⅴ), P–O–Fe vibrational stretching modes red-shifted with increasing pH, indicating weaker surface interactions (Figs. S14b and S15b in Supporting information). On the (102) surface, bidentate complexes were more stable than monodentate ones under acidic conditions (Fig. 8), in line with earlier studies [76]. The lower wavenumbers associated with bidentate P–O–Fe vibrations indicated a symmetry reduction from C3v to C2v (Fig. S16b in Supporting information) [7]. At high pH, both surfaces predominantly formed outer-sphere complexes. Overall, DFT calculations support the experimental observation that As(Ⅴ) and P(Ⅴ) compete for the same surface sites on α-Fe2O3 surfaces. Their adsorption behaviors are strongly governed by pH-dependent protonation and complexation structures.
The calculated adsorption energies elucidate the selectivity differences observed in batch experiments. Across both terminations of the (001) surface, all As(Ⅴ) complexes exhibited consistently lower (more favorable) adsorption energies than their P(Ⅴ) counterparts (Fig. 7), confirming α-Fe2O3's preferential affinity for As(Ⅴ) across a wide pH range. These results align with DLM-predicted logK values and previous experimental observations (Table S7) [47,48,77]. The energy gap was more pronounced for protonated monodentate complexes compared to their less protonated forms, suggesting that protonation enhances As(Ⅴ) selectivity under P-rich conditions (Fig. 7). A similar trend was observed on the (102) facet (Fig. 8). Moreover, bidentate complexes displayed a greater adsorption energy difference than monodentate complexes, suggesting that bidentate coordination further enhances As(Ⅴ) selectivity [48].
Bonding analyses further support these energetic trends (Table 1). As(Ⅴ) inner-sphere complexes consistently exhibited shorter Fe-O bond lengths and lower integrated crystal orbital Hamilton population (ICOHP) values than P(Ⅴ) complexes, highlighting the stronger affinity of Fe sites for As(Ⅴ) (Table 1 and Figs. S5-S8 in Supporting information) [48,77]. This difference is attributed to As(Ⅴ)'s superior π-acceptor ability relative to P(Ⅴ), which enhances Fe→As back-donation and strengthens the Fe–O–As bond [77]. Notably, protonated monodentate As(Ⅴ) complexes exhibited greater variations in Fe–O bond lengths and ICOHP values than P(Ⅴ), highlighting protonation's role in amplifying As(Ⅴ) selectivity (Table 1 and Figs. S5-S8). Previous studies have shown that the proportion of protonated inner-sphere complexes increases with surface loading, which, together with our results [47,73], suggests that higher surface loading further promotes As(Ⅴ) selectivity. On the (102) facet, bidentate As(Ⅴ) complexes displayed markedly shorter Fe–O bond lengths and more negative ICOHP values than their P(Ⅴ) analogs (Table 1 and Figs. S7 and S8) further confirming the role of bidentate coordination in enhancing selectivity—consistent with findings on the (110) surface [47]. Together, these results demonstrate that while competitive P(Ⅴ) does not completely dominate adsorption, protonation-driven surface complexation significantly influences competitive behavior, highlighting the importance of complexation structure modulation for improved As(Ⅴ) retention in P(Ⅴ)-rich aqueous environments.
Although Fe–O bond lengths in surface complexes increase with protonation (Table 1), this trend primarily reflects hydrogen-bond modulation rather than weaker metal–ligand interactions. At lower pH, the ligand proton (As(Ⅴ)/P(Ⅴ)–OH) in protonated monodentate complexes acts as a hydrogen bond donor, forming stronger interactions with surface oxygen atoms (O_surf) than those formed by surface hydroxyl protons donating to ligand oxygen atoms (Table S6 in Supporting information). These interactions are evidenced by shorter hydrogen bond lengths and lower ICOHP values (Table S6 and Figs. S9-S12 in Supporting information). Strengthened hydrogen bonding slightly elongates the Fe–O bond, weakening the constraint of surface Fe on the As-O bond and resulting in higher vibrational frequencies—consistent with trends observed in our frequency calculations (Figs. S14-S16 in Supporting information). Under these conditions, apparent adsorption energy becomes a more appropriate descriptor for selectivity, as it accounts for both bonding strength and hydrogen-bonding stabilization effects. This mechanism offers a molecular-level explanation for the preferential retention of As(Ⅴ) over P(Ⅴ) and provides a theoretical foundation for differentiating As(Ⅴ) from other competing oxyanions. For instance, nitrate (pKa ≈ –1) and sulfate (pKa1 ≈ –3; pKa2 ≈ 1.9) predominantly exist in deprotonated forms at neutral pH [78], functioning predominantly as hydrogen-bond acceptors. In contrast, As(Ⅴ)/P(Ⅴ) form protonated inner-sphere complexes that benefit from additional hydrogen bonding with the surface, further stabilizing adsorption. These differences suggest that hydrogen bonding may enhance As(Ⅴ) selectivity even in multi-ion systems. However, this study did not experimentally evaluate the competitive effects of nitrate, sulfate, or other coexisting anions. Future work will systematically investigate these systems to quantify their interference and validate the proposed hydrogen-bonding mechanism.
Crystallographic facet dependence also plays a crucial role in As(Ⅴ) selectivity. Differences in adsorption energies, Fe-O bond length, and ICOHP values between As(Ⅴ) and P(Ⅴ) monodentate complexes are more pronounced on the O-terminated (001) surface compared to the Fe-terminated (001) and (102) facets (Figs. 7 and 8 and Table 1). These facet-specific behaviors are primarily governed by differences in surface structure, particularly the Fe–Fe distance between adjacent hydroxyl groups (Figs. 7 and 8 and Table 1). On the O-terminated (001) surface, the shorter Fe-Fe spacing (~2.86 Å) within the ≡Fe2OH group enables simultaneous coordination to two ligand oxygen atoms, promoting selective As(Ⅴ) retention [47]. In contrast, the longer Fe-Fe distance (~5.10 Å) between adjacent ≡FeOH groups on the Fe-terminated (001) surface restricts complexation to monodentate configurations, as previously reported [20]. The (102) facet, with an intermediate Fe-Fe distance (~3.27 Å) between adjacent ≡FeOH groups, supports initial monodentate complex formation and, under low pH or high ligand concentrations, transformation into deprotonated bidentate binuclear complexes [34,47,79,80]. This facet-dependent selectivity is consistent with previous findings for vanadium and chromium adsorption on α-Fe2O3, where bidentate complexes are favored on facets with Fe–Fe distances ~3.5 Å, while monodentate complexes dominate when Fe–Fe spacing exceeds ~5.0 Å [81]. These insights highlight that tuning surface properties—especially Fe-Fe site spacing—can serve as a rational design strategy for engineering high-performance adsorbents to enhance As(Ⅴ) removal, particularly under P(Ⅴ)-rich conditions.
To investigate the pH-dependent adsorption sequences of As(Ⅴ) and P(Ⅴ) on α-Fe2O3 surfaces, a 2D-COS analysis was conducted. The absorption peaks identified by 2D-COS closely matched those observed in the ATR-FTIR spectra. In the synchronous spectra at pH 5, 7, and 9 (Figs. 9a, c, and e), a positive correlation between the As–O (800–920 cm−1) and P–O (950–1200 cm−1) regions indicated that both species exhibited synchronous increases in adsorption intensity under near-neutral conditions.
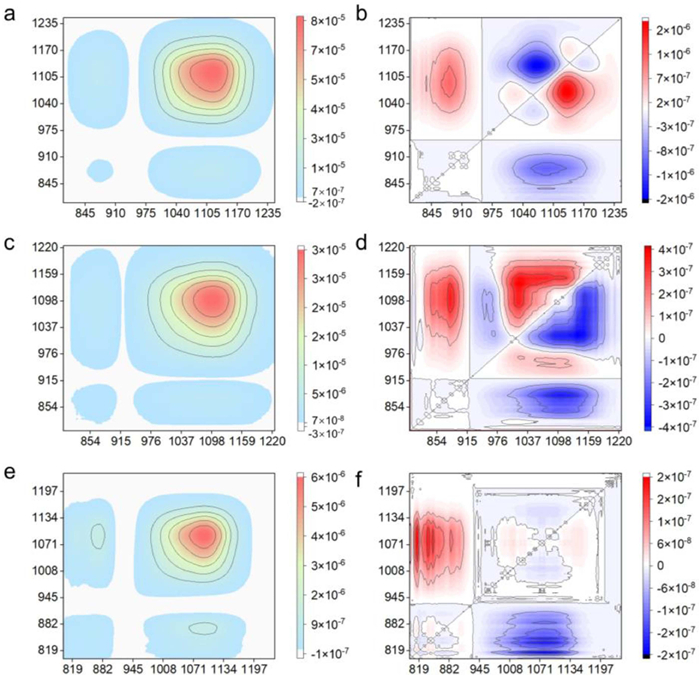
Asynchronous spectra provided insight into the relative adsorption kinetics. At pH 5 (Fig. 9b), positive cross-peaks at 838/1108, 838/1036, 879/1036, 879/1108, and 1108/1036 cm-1, suggest that As(Ⅴ) species (H2AsO4− and HAsO42−) adsorbed more rapidly than P(Ⅴ) species (H2PO4− and HPO42−), corroborating batch kinetic experiments. Following Noda's rule [82], the adsorption sequences on the α-Fe2O3 were determined as: As(Ⅴ) monoprotonated monodentate complexes (879 cm−1) > As(Ⅴ) deprotonated monodentate complexes (838 cm−1) > P(Ⅴ) monoprotonated monodentate complexes (1108 cm−1) > P(Ⅴ) deprotonated monodentate complexes (1036 cm−1). At pH 7 (Fig. 9d), a similar sequence emerged: As(Ⅴ) monoprotonated monodentate complexes (874 cm−1) > As(Ⅴ) deprotonated monodentate complexes (840 cm−1) > P(Ⅴ) deprotonated monodentate complexes (1035 cm−1) > P(Ⅴ) monoprotonated monodentate complexes (1111 cm−1). The earlier formation of P(Ⅴ) deprotonated monodentate complexes at this pH likely reflects the decreased availability of H2PO4- under slightly alkaline conditions. At pH 9, consistent behavior was observed (Fig. 9f), with positive cross-peaks at 840/1108, 840/1040, 879/1040, 879/1108, and 1040/1108 cm-1, yielding the sequence: As(Ⅴ) deprotonated monodentate complexes (840 cm−1) > As(Ⅴ) monoprotonated monodentate complexes (879 cm−1) > P(Ⅴ) deprotonated monodentate complexes (1040 cm−1) > P(Ⅴ) monoprotonated monodentate complexes (1108 cm−1). This trend suggests that elevated pH promotes the formation of deprotonated inner-sphere complexes, consistent with the increased prevalence of HAsO4− and HPO4−. Overall, As(Ⅴ) adsorption occurred faster than P(Ⅴ) adsorption across the pH range studied. The adsorption sequence was clearly modulated by the protonation states of surface complexes, with lowering pH promoting protonated species and enhancing As(Ⅴ)'s kinetic selectivity over P(Ⅴ). These results support DFT-based predictions and provide mechanistic insight into the preferential retention of As(Ⅴ) in P(Ⅴ)-rich environments.
This study reveals that the competitive adsorption of As(Ⅴ) and P(Ⅴ) on α-Fe2O3 is strongly pH-dependent, with As(Ⅴ) selectivity reaching a maximum under acidic conditions and declining with increasing pH. This behavior is governed by protonation-driven surface complexation, which enhances the stability and selectivity of As(Ⅴ) retention through structural transitions from monodentate to bidentate complexes. The spatial configuration of Fe–Fe sites on α-Fe2O3 surfaces further controls complexation modes and selectivity, providing a new molecular basis for material design.
Importantly, these findings offer a practical and low-cost strategy to enhance arsenic removal in P(Ⅴ)-rich waters—common in agricultural runoff (pH 6–8), acid mine drainage (pH < 4), and industrial effluents (pH > 10). By simply adjusting pH and reaction concentration, As(Ⅴ) selectivity and adsorption kinetics can be significantly improved without relying on advanced materials or complex process modifications. The identified protonation-driven interfacial mechanism—mediated by hydrogen bonding and site-specific coordination—provides a clear framework for optimizing arsenic capture and guiding the design of next-generation adsorbents.
Furthermore, the observed pH-dependent adsorption behavior suggests a potential pathway for regenerating α-Fe2O3 after As(Ⅴ) uptake. While regeneration is feasible, surface degradation over repeated cycles may gradually reduce capacity. Spent adsorbents can be stabilized through solidification, vitrification, or mineral transformation to minimize long-term environmental risk. Beyond mechanistic insights, this work advances practical remediation strategies for complex, multi-anion systems, particularly in resource-limited or rural settings where simplicity, efficiency, and cost-effectiveness are paramount.
The authors declare that they have no known competing financial interests or personal relationships that could have appeared to influence the work reported in this paper.
Hongxing Liu: Writing – review & editing, Writing – original draft, Visualization, Validation, Software, Methodology. Xianjun Xie: Writing – review & editing, Validation, Methodology, Conceptualization. Yanxin Wang: Writing – review & editing, Funding acquisition.
The research work was financially supported by National Key Research and Development Program of China (No. 2021YFA0715900). This study was also supported by the high-performance computing platform of China University of Geosciences.
Supplementary material associated with this article can be found, in the online version, at doi:
J. Podgorski, M. Berg, Science 368 (2020) 845–850. doi: 10.1126/science.aba1510
M.K. Yadav, D. Saidulu, A.K. Gupta, P.S. Ghosal, A. Mukherjee, J. Environ. Chem. Eng. 9 (2021) 105203. doi: 10.1016/j.jece.2021.105203
M.S. Rahaman, M.M. Rahman, N. Mise, et al., Environ. Pollut. 289 (2021) 117940. doi: 10.1016/j.envpol.2021.117940
R. Kaur, A. Garkal, L. Sarode, et al., J. Hazard. Mater. Lett. 5 (2024) 100090. doi: 10.1016/j.hazl.2023.100090
A. Sarkar, B. Paul, Chemosphere 158 (2016) 37–49. doi: 10.1016/j.chemosphere.2016.05.043
Y. Zhang, X. Liu, J. Cheng, X. Lu, Environ. Sci. Technol. 55 (2021) 15921–15928. doi: 10.1021/acs.est.1c05343
E. Di Iorio, H.G. Cho, Y. Liu, et al., Geochim. Cosmochim. Acta 237 (2018) 155–170. doi: 10.1016/j.gca.2018.06.027
K.D. Hristovski, J. Markovski, Sci. Total Environ. 598 (2017) 258–271. doi: 10.1016/j.scitotenv.2017.04.108
S. Yamamoto, T. Kendelewicz, J.T. Newberg, et al., J. Phys. Chem. C 114 (2010) 2256–2266. doi: 10.1021/jp909876t
X.P. Huang, X.J. Hou, X. Zhang, K.M. Rosso, L.Z. Zhang, Environ. Sci. Nano 5 (2018) 1790–1806. doi: 10.1039/c8en00548f
L. Yan, T.S. Chan, C.Y. Jing, Environ. Sci. : Nano 7 (2020) 3927–3939. doi: 10.1039/d0en00812e
H.B. Guo, A.S. Barnard, J. Mater. Chem. A 1 (2013) 27–42. doi: 10.1039/C2TA00523A
J.G. Catalano, Z. Zhang, C. Park, P. Fenter, M.J. Bedzyk, Geochim. Cosmochim. Acta 71 (2007) 1883–1897. doi: 10.1016/j.gca.2007.01.015
T. Pabisiak, A. Kiejna, J. Phys. Commun. 3 (2019) 035023. doi: 10.1088/2399-6528/ab0fa7
T.P. Trainor, A.M. Chaka, P.J. Eng, et al., Surf. Sci. 573 (2004) 204–224. doi: 10.1016/j.susc.2004.09.040
J.G. Catalano, P. Fenter, C. Park, Geochim. Cosmochim. Acta 73 (2009) 2242–2251. doi: 10.1016/j.gca.2009.02.001
S. Kerisit, Geochim. Cosmochim. Acta 75 (2011) 2043–2061. doi: 10.1016/j.gca.2011.01.026
K.S. Tanwar, S.C. Petitto, S.K. Ghose, P.J. Eng, T.P. Trainor, Geochim. Cosmochim. Acta 73 (2009) 4346–4365. doi: 10.1016/j.gca.2009.04.024
H. Mei, Y. Liu, X. Tan, et al., J. Hazard. Mater. 399 (2020) 123028. doi: 10.1016/j.jhazmat.2020.123028
L. Yan, T. Chan, C. Jing, Environ. Sci. Technol. 56 (2022) 3138–3146. doi: 10.1021/acs.est.1c07801
X. Wang, Y. Zhang, C. Song, et al., Chem. Eng. J. 479 (2024) 147677. doi: 10.1016/j.cej.2023.147677
X. Wang, T. Wang, C. Song, et al., Sep. Purif. Technol. 354 (2025) 128916. doi: 10.1016/j.seppur.2024.128916
Y. Mamindy-Pajany, C. Hurel, N. Marmier, M. Roméo, Desalination 281 (2011) 93–99. doi: 10.1016/j.desal.2011.07.046
J. Han, H.M. Ro, Environ. Sci. Pollut. Res. 25 (2018) 28572–28582. doi: 10.1007/s11356-018-2897-y
J. Giménez, M. Martínez, J. de Pablo, M. Rovira, L. Duro, J. Hazard. Mater. 141 (2007) 575–580. doi: 10.1016/j.jhazmat.2006.07.020
Y. Mamindy-Pajany, C. Hurel, N. Marmier, M. Roméo, C. R. Chim. 12 (2009) 876–881.
H. Zeng, B. Fisher, D.E. Giammar, Environ. Sci. Technol. 42 (2008) 147–152. doi: 10.1021/es071553d
D.M. Sherman, S.R. Randall, Geochim. Cosmochim. Acta 67 (2003) 4223– 4230. doi: 10.1016/S0016-7037(03)00237-0
Y. Brechbühl, I. Christl, E.J. Elzinga, R. Kretzschmar, J. Colloid Interface Sci. 377 (2012) 313–321. doi: 10.1016/j.jcis.2012.03.025
M. Blanchard, G. Morin, M. Lazzeri, E. Balan, I. Dabo, Geochim. Cosmochim. Acta 86 (2012) 182–195. doi: 10.1016/j.gca.2012.03.013
Y. Arai, D.L. Sparks, J.A. Davis, Environ. Sci. Technol. 38 (2004) 817–824. doi: 10.1021/es034800w
A. Manceau, Geochim. Cosmochim. Acta 59 (1995) 3647–3653. doi: 10.1016/0016-7037(95)00275-5
G.A. Waychunas, B.A. Rea, C.C. Fuller, J.A. Davis, Geochim. Cosmochim. Acta 57 (1993) 2251–2269. doi: 10.1016/0016-7037(93)90567-G
S. Fendorf, M.J. Eick, P. Grossl, D.L. Sparks, Environ. Sci. Technol. 31 (1997) 315–320. doi: 10.1021/es950653t
S. Das, J. Essilfie-Dughan, M.J. Hendry, J. Nanopart. Res. 16 (2014) 2490. doi: 10.1007/s11051-014-2490-3
J.D. Kubicki, K.W. Paul, L. Kabalan, et al., Langmuir 28 (2012) 14573–14587. doi: 10.1021/la303111a
Y. Li, C. Yu, B. Zhao, et al., Water Res. 209 (2022) 117930. doi: 10.1016/j.watres.2021.117930
M. Simmler, E. Suess, I. Christl, T. Kotsev, R. Kretzschmar, Sci. Total Environ. 572 (2016) 742–754. doi: 10.1016/j.scitotenv.2016.07.049
D.G. Strawn, P.J. Hickey, P.A. McDaniel, L.L. Baker, J. Soils Sediments 12 (2012) 1100–1110. doi: 10.1007/s11368-012-0543-8
Y. Chang, W. Shuhang, F. Che, et al., Environ. Sci. : Processes Impacts 27 (2025) 706–717. doi: 10.1039/d4em00707g
Z. Sharifi, A.A.S. Sinegani, Curr. World Environ. 7 (2012) 233–241. doi: 10.12944/CWE.7.2.07
H.M. Anawar, J. Akai, M. Mihaljevič, et al., Water 3 (2011) 1050–1076. doi: 10.3390/w3041050
H. Neidhardt, S. Rudischer, E. Eiche, et al., J. Hazard. Mater. 411 (2021) 125128. doi: 10.1016/j.jhazmat.2021.125128
X.L. Liang, X.J. Lin, G.L. Wei, et al., Am. Mineral. 106 (2021) 374–388. doi: 10.2138/am-2020-7350
J.S. Yamani, A.W. Lounsbury, J.B. Zimmerman, Water Res. 88 (2016) 889–896. doi: 10.1016/j.watres.2015.11.017
L.N. Pincus, P.V. Petrović, I.S. Gonzalez, et al., Chem. Eng. J. 412 (2021) 128582. doi: 10.1016/j.cej.2021.128582
H. Liu, X. Xie, Y. Wang, Water Res. 271 (2025) 122955. doi: 10.1016/j.watres.2024.122955
H. Liu, X. Xie, H. Cao, Y. Wang, Chemosphere 336 (2023) 139276. doi: 10.1016/j.chemosphere.2023.139276
J.P. Gustafsson, J. Antelo, ACS Earth Space Chem. 6 (2022) 1397–1406. doi: 10.1021/acsearthspacechem.2c00081
X.C. Li, L. Yan, W. Zhong, M. Kersten, C.A.Y. Jing, J. Hazard. Mater. 414 (2021) 125512. doi: 10.1016/j.jhazmat.2021.125512
L. Chen, X. Yang, J. Chen, et al., Inorg. Chem. 49 (2010) 8411–8420. doi: 10.1021/ic100919a
S. Kerisit, K.M. Rosso, Geochim. Cosmochim. Acta 70 (2006) 1888–1903. doi: 10.1016/j.gca.2005.12.021
J.F. Boily, S. Chatman, K.M. Rosso, Geochim. Cosmochim. Acta 75 (2011) 4113–4124. doi: 10.1016/j.gca.2011.05.013
G.F. von Rudorff, R. Jakobsen, K.M. Rosso, J. Blumberger, J. Phys. Chem. Lett. 7 (2016) 1155–1160. doi: 10.1021/acs.jpclett.6b00165
T. Li, F. Shi, Y. Ju, Z. Ding, Water 15 (2023) 4070. doi: 10.3390/w15234070
C.M. Eggleston, A.G. Stack, K.M. Rosso, et al., Geochim. Cosmochim. Acta 67 (2003) 985–1000. doi: 10.1016/S0016-7037(02)01200-0
K.S. Tanwar, S.C. Petitto, S.K. Ghose, P.J. Eng, T.P. Trainor, Geochim. Cosmochim. Acta 72 (2008) 3311–3325. doi: 10.1016/j.gca.2008.04.020
C. Qiu, W. Chen, M. Schmidt, et al., Environ. Sci. Technol. 54 (2020) 6651–6660. doi: 10.1021/acs.est.0c00060
C. Qiu, F. Majs, T.A. Douglas, M. Schmidt, T.P. Trainor, Environ. Sci. Technol. 52 (2018) 11161–11168. doi: 10.1021/acs.est.8b03903
N.J. English, M. Rahman, N. Wadnerkar, J.M.D. MacElroy, Phys. Chem. Chem. Phys. 16 (2014) 14445–14454. doi: 10.1039/c3cp54700k
P. Chen, D. Song, X. Zhang, et al., Environ. Sci. Technol. 56 (2022) 823–834. doi: 10.1021/acs.est.1c03629
P.R. Grossl, M. Eick, D.L. Sparks, S. Goldberg, C.C. Ainsworth, Environ. Sci. Technol. 31 (1997) 321–326. doi: 10.1021/es950654l
X. Ding, X. Song, J.F. Boily, J. Phys. Chem. C 116 (2012) 21939–21947. doi: 10.1021/jp3083776
M. Li, H. Liu, T. Chen, et al., Chem. Geol. 524 (2019) 368–382. doi: 10.1016/j.chemgeo.2019.07.008
M. Kosmulski, Adv. Colloid Interface Sci. 296 (2021) 102519. doi: 10.1016/j.cis.2021.102519
J. Lützenkirchen, T. Preočanin, F. Stipić, et al., Geochim. Cosmochim. Acta 120 (2013) 479–486. doi: 10.1016/j.gca.2013.06.042
P. Venema, T. Hiemstra, P.G. Weidler, W.H. van Riemsdijk, J. Colloid Interface Sci. 198 (1998) 282–295. doi: 10.1006/jcis.1997.5245
K. Müller, V.S.T. Ciminelli, M.S.S. Dantas, S. Willscher, Water Res. 44 (2010) 5660–5672. doi: 10.1016/j.watres.2010.05.053
E.J. Elzinga, D.L. Sparks, J. Colloid Interface Sci. 308 (2007) 53–70. doi: 10.1016/j.jcis.2006.12.061
T.H. Hsia, S.L. Lo, C.F. Lin, D.Y. Lee, Colloids Surf. A 85 (1994) 1–7.
D.G. Lumsdon, A.R. Fraser, J.D. Russell, N.T. Livesey, Eur. J. Soil Sci. 35 (1984) 381–386. doi: 10.1111/j.1365-2389.1984.tb00294.x
X. Sun, H.E. Doner, Soil Sci. 161 (1996) 865–872. doi: 10.1097/00010694-199612000-00006
M.I. Tejedor-Tejedor, M.A. Anderson, Langmuir 6 (1990) 602–611. doi: 10.1021/la00093a015
N.Y. Dzade, A. Roldan, N.H. de Leeuw, Environ. Sci. Technol. 51 (2017) 3461–3470. doi: 10.1021/acs.est.7b00107
S. Goldberg, C.T. Johnston, J. Colloid Interface Sci. 234 (2001) 204–216. doi: 10.1006/jcis.2000.7295
T. Hiemstra, W.H. Van Riemsdijk, J. Colloid Interface Sci. 210 (1999) 182–193. doi: 10.1006/jcis.1998.5904
O. Nwokonkwo, C. Muhich, J. Phys. Chem. C 128 (2024) 1689–1699. doi: 10.1021/acs.jpcb.3c06838
B. Wu, J. Wan, Y. Zhang, B. Pan, I.M.C. Lo, Environ. Sci. Technol. 54 (2020) 50–66. doi: 10.1021/acs.est.9b05569
J. Farrell, B.K. Chaudhary, Environ. Sci. Technol. 47 (2013) 8342–8347. doi: 10.1021/es4013382
B. Zhong, R. Stanforth, S. Wu, J.P. Chen, J. Colloid Interface Sci. 308 (2007) 40–48. doi: 10.1016/j.jcis.2006.12.055
C. Zheng, W. Zhong, L. Yan, C. Jing, Langmuir 39 (2023) 949–956. doi: 10.1021/acs.langmuir.2c02192
I. Noda, Appl. Spectrosc. 47 (1993) 1329–1336. doi: 10.1366/0003702934067694

Figure 1 XRD patterns (a), SEM (b) and TEM images (c) of α-Fe2O3 nanoplates. Hydroxylation configurations of the Fe-terminated (001) (d), O-terminated (001) (e), and O-terminated (102) (f) surfaces.

Figure 2 (a) Acid-base titration curve of α-Fe2O3. (b) Gran's plot, (c) fitted titration results, and (d) simulated pH-dependent distributions of singly and doubly coordinated surface groups in 0.01 mol/L NaCl solution.

Figure 3 pH-Dependent adsorption of As(Ⅴ) and P(Ⅴ) in single-solute and binary systems, and the corresponding binary separation factors. (a) Single-solute adsorption of As(Ⅴ) and P(Ⅴ) at an initial concentration of 0.20 mmol/L. (b) Binary-system adsorption at an As(Ⅴ): P(Ⅴ) molar ratio of 1:1 (0.10:0.10 mmol/L). (c) Binary separation factor values corresponding to the binary adsorption shown in (b). (d) Single-solute adsorption of As(Ⅴ) and P(Ⅴ) at an initial concentration of 0.11 mmol/L. (e) Binary-system adsorption at an As(Ⅴ): P(Ⅴ) molar ratio of 1:10 (0.10:0.01 mmol/L). (f) Binary separation factor values corresponding to the binary adsorption shown in (e). Experimental conditions: 0.01 mol/L NaCl, 25 ℃.

Figure 4 pH-dependent adsorption kinetics of As(Ⅴ) and P(Ⅴ) on α-Fe2O3 in single-solute and binary systems, with pseudo-first-order (PFO) and pseudo-second-order (PSO) model fits and corresponding initial adsorption rates. (a, b) Single-solute (0.20 mmol/L) and binary-system (0.10 mmol/L As(Ⅴ) + 0.10 mmol/L P(Ⅴ)) adsorption kinetics at pH 5. (c, d) Single-solute and binary-system adsorption kinetics at pH 7 (reproduced from Ref. [47] with permission from Elsevier, Copyright 2025) and included for comparison only. (e, f) Single-solute and binary-system adsorption kinetics at pH 9. Experimental conditions: 0.01 mol/L NaCl, 25 ℃.

Figure 5 pH-Dependent competitive adsorption of As(Ⅴ) and P(Ⅴ) on α-Fe2O3 in a binary system (0.10 mmol/L As(Ⅴ) + 0.10 mmol/L P(Ⅴ)). (a-c) In-situ ATR-FTIR spectra showing the time-dependent evolution of surface complexes. (d-f) Adsorption kinetics derived from the integrated peak intensities at 1110 and 870 cm−1. Panels (b) and (e) are reproduced from Ref. [47] with permission from Elsevier (Copyright 2025) and are included solely for comparison. ATR-FTIR conditions: 0.01 mol/L NaCl, flow rate of 0.25 mL/min, room temperature; spectra collected every 5-10 min.

Figure 6 Effect of pH (5, 7, and 9) on ATR-FTIR spectra and peak deconvolution of As(Ⅴ) and P(Ⅴ) adsorption on α-Fe2O3 surfaces in individual and competitive systems. Panels a, d, g, and j show the ATR-FTIR spectra of As(Ⅴ) under single-solute conditions and the corresponding peak deconvolution at each pH. Panels b, e, h, and k present the ATR-FTIR spectra of P(Ⅴ) under single-solute conditions and their corresponding peak deconvolution results. Panels c, f, i, and l display the ATR-FTIR spectra of As(Ⅴ) and P(Ⅴ) under binary-solute conditions along with the peak deconvolution at each pH. Experimental conditions: room temperature, 0.1 mmol/L As(Ⅴ) + 0.1 mmol/L P(Ⅴ), 0.01 mol/L NaCl.

Figure 7 pH-dependent adsorption configurations of As(Ⅴ) and P(Ⅴ) on Fe-terminated (a) and O-terminated (b) (001) surfaces, with corresponding adsorption energies (Ea). MH2, MH1, MH0, and HB0 represent bi-, mono-, and deprotonated monodentate complexes, and outer-sphere complexes, respectively. Atom colors: O (red), Fe (brown), As (green), P (pink), and H (white).

Figure 8 Effect of pH on the adsorption configurations and energies of As(Ⅴ) and P(Ⅴ) on the α-Fe2O3 (102) surface. MH2, MH1, MH0, and HB0 represent bi-, mono-, deprotonated monodentate, and outer-sphere complexes, respectively; BH1 and BH0 denote mono- and deprotonated bidentate complexes. Atom colors: O (red), Fe (brown), As (green), P (pink), H (white).

Figure 9 pH-Dependent two-dimensional correlation spectroscopy (2D-COS) analysis of competitive As(Ⅴ) and P(Ⅴ) adsorption on α-Fe2O3 in a binary system (0.10 mmol/L As(Ⅴ) + 0.10 mmol/L P(Ⅴ)). The left and right panels show the synchronous and asynchronous 2D-COS spectra, respectively. (a, b) pH 5; (c, d) pH 7; and (e, f) pH 9. Panels (c) and (d) are reproduced from Ref. [47] with permission from Elsevier (Copyright 2025) and are included solely for comparison.
Table 1. Adsorption energy (Ea) of As(Ⅴ) and P molecules before and after adsorption on Fe- and O-terminated (001) and (102) surfaces. The table also presents As/P-Fe and Fe-O bond lengths (Å) and their corresponding COHP integral values (ICOHP) for thermodynamically stable inner-sphere configurations after adsorption.
| Facets | dFe-Fe (Å) | Complexation reactions | Configurations | Ea (kJ/mol) | dAs/P-Fe (Å) | dFe-O (Å) | ICOHP for Fe-O bonds | ||||
| SPIN1 | SPIN2 | ||||||||||
| Fe-terminated (001) | ~5.10a | ≡FeOH + 3H++ AsO43- → ≡FeH2OAsO3 + H2O | MH2 | −169 | 3.44 | 2.15 | −0.79 | −0.48 | |||
| ≡FeOH + 2H++ AsO43- → ≡FeHOAsO3- + H2O | MH1 | −139 | 3.49 | 2.09 | −0.91 | −0.52 | |||||
| ≡FeOH + H++ AsO43- → ≡FeOAsO32- + H2O | MH0 | −127 | 3.44 | 2.06 | −0.98 | −0.54 | |||||
| ≡FeOH + 3H++ PO43- → ≡FeH2OPO3 + H2O | MH2 | −160 | 3.38 | 2.19 | −0.70 | −0.43 | |||||
| ≡FeOH + 2H++ PO43- → ≡FeHOPO3- + H2O | MH1 | −132 | 3.40 | 2.12 | −0.83 | −0.48 | |||||
| ≡FeOH + H++ PO43- → ≡FeOPO32- + H2O | MH0 | −122 | 3.35 | 2.08 | −0.92 | −0.51 | |||||
| O-terminated (001) | ~2.86 | ≡Fe2OH + 3H++ AsO43- → ≡Fe2H2OAsO3 + H2O | MH2 | −190 | 3.46 | 1.97 | 2.13 | −0.56 | −0.41 | −1.24 | −0.81 |
| ≡Fe2OH + 2H++ AsO43- → ≡Fe2HOAsO3- + H2O | MH1 | −143 | 3.35 | 1.97 | 2.10 | −0.56 | −0.43 | −1.28 | −0.89 | ||
| ≡Fe2OH + H++ AsO43- → ≡Fe2OAsO32- + H2O | MH0 | −103 | 3.37 | 1.95 | 2.11 | −0.55 | −0.43 | −1.30 | −0.90 | ||
| ≡Fe2OH + 3H++ PO43- → ≡Fe2H2OPO3 + H2O | MH2 | −179 | 3.28 | 1.98 | 2.17 | −0.52 | −0.37 | −1.16 | −0.71 | ||
| ≡Fe2OH + 2H++ PO43- → ≡Fe2HOPO3- + H2O | MH1 | −134 | 3.27 | 1.97 | 2.14 | −0.54 | −0.39 | −1.22 | −0.78 | ||
| ≡Fe2OH + H++ PO43- → ≡Fe2OPO32- + H2O | MH0 | −97 | 3.28 | 1.98 | 2.15 | −0.54 | −0.39 | −1.24 | −0.81 | ||
| (102) | ~3.37 | ≡FeOH + 3H++ AsO43- → ≡FeH2OAsO3 + H2O | MH2 | −142 | 3.44 | 2.18 | −0.78 | −0.39 | |||
| ≡2FeOH + 3H++ AsO43- → ≡(FeO)2AsHO2 + 2H2O | BH1 | −172 | 3.20 | 1.93 | 2.12 | −0.71b | −0.94c | −1.59 | −0.43 | ||
| ≡FeOH + 2H++ AsO43-→≡FeHOAsO3- + H2O | MH1 | −114 | 3.47 | 1.99 | −1.30 | −0.51 | |||||
| ≡2FeOH + 2H++ AsO43-→≡(FeO)2AsO2- + 2H2O | BH0 | −128 | 3.22 | 1.91 | 2.13 | −0.71 | −0.93 | −1.67 | −0.42 | ||
| ≡FeOH + H++ AsO43- → ≡FeOAsO32- + H2O | MH0 | −86 | 3.47 | 1.95 | −1.42 | −0.56 | |||||
| ≡FeOH + 3H++ PO43- → ≡FeH2OPO3 + H2O | MH2 | −137 | 3.24 | 2.18 | −0.73 | −0.36 | |||||
| ≡2FeOH + 3H++ PO43- → ≡(FeO)2PHO2 + 2H2O | BH1 | −159 | 3.11 | 1.93 | 2.13 | −0.67 | −0.89 | −1.53 | −0.41 | ||
| ≡FeOH + 2H++ PO43- → ≡FeHOPO3- + H2O | MH1 | −110 | 3.34 | 1.99 | −1.24 | −0.50 | |||||
| ≡2FeOH + 2H++ PO43- → ≡(FeO)2PO2- + 2H2O | BH0 | −121 | 3.14 | 1.91 | 2.16 | −0.68 | −0.85 | −1.63 | −0.39 | ||
| ≡FeOH + H++ PO43- → ≡FeOPO32- + H2O | MH0 | −82 | 3.34 | 1.95 | −1.38 | −0.54 | |||||
| a Fe-Fe site distance between adjacent hydroxyl groups. b, c Different Fe-O bonds within the complexes. |
|||||||||||
 下载: 导出CSV

 扫一扫看文章


扫一扫关注我们
 下载:
下载: