MgWO4 microflowers assembled by ultrathin nanosheets with highly-exposed (001) facet: Density functional theory and novel energy storage in Mg-ion batteries
Citation:
Meiqi Zhang, Yijing Zhao, Gongke Li, Yuqing Yang, Qing Wang, Ziqing Gui, Xucheng Gu, Juan Liu, Chunsheng Li, Guoliang Dai, Yan Sun, Yan Xu, Pengchao Liu, Yuzhen Zhao. MgWO4 microflowers assembled by ultrathin nanosheets with highly-exposed (001) facet: Density functional theory and novel energy storage in Mg-ion batteries[J]. Chinese Chemical Letters,
2026, 37(8): 111181.
doi:
10.1016/j.cclet.2025.111181
MgWO4 microflowers assembled by ultrathin nanosheets with highly-exposed (001) facet: Density functional theory and novel energy storage in Mg-ion batteries
English
MgWO4 microflowers assembled by ultrathin nanosheets with highly-exposed (001) facet: Density functional theory and novel energy storage in Mg-ion batteries
Key Laboratory of Advanced Electrode Materials for Novel Solar Cells for Petroleum and Chemical Industry of China, School of Chemistry and Life Sciences, Suzhou University of Science and Technology, Suzhou 215009, China
b.
CNPC Offshore Engineering Co., Ltd., Tianjin 300450, China
c.
Xi’an Key Laboratory of Advanced Photo-electronics Materials and Energy Conversion Device, School of Electronic Information, Xijing University, Xi’an 710123, China
d.
College of Energy, Soochow Institute for Energy and Materials Innovations, Light Industry Institute of Electrochemical Power Sources, Key Laboratory of Advanced Carbon Materials and Wearable Energy Technologies of Jiangsu Province, Soochow University, Suzhou 215006, China
Received Date:
09 February 2025 Accepted Date:
03 April 2025 Revised Date:
26 March 2025 Available Online:
15 August 2026
Abstract:
The development of electrode materials with a rapid diffusion kinetics and low polarization is crucial for improving energy storage in magnesium ion batteries (MIBs). Herein, the magnesium tungstate with thermal stability and good chemical stability is proposed as the electrode material in MIBs for the first time. According to the simulated results of density functional theory (DFT) calculations, the high exposed (001) plane of MgWO4 can be achieved as the preferred orientation for Mg2+ fast insertion/extraction. The MgWO4 microflowers with exposed (001) plane architecting by uniform nanosheets were successfully synthesized through a high-efficient microwave radiation strategy. The synthesis mechanism of MgWO4 microflowers was explored as "self-assembly-dissolution-recrystallization-Ostwald ripening" through the evolutions of the morphology and microstructure under continuous reaction timespan. As a MIB electrode material, the MgWO4 microflowers exhibit a good reversible specific capacity (54.6 mAh/g) and cycling stability (70.9% capacity retention after 100 cycles). In conclusion, the MgWO4 material with exposed (001) facet and layered pore structure effectively overcomes the slow diffusion kinetics in MIBs, presenting a new avenue for the design and synthesis of novel reversible electrode materials of MIBs.
The demand for large-scale energy storage systems has skyrocketed in recent years [1–6], and the advancement of lithium-ion batteries (LIBs) has been severely hindered by the limited availability and uneven distribution of lithium in the Earth’s crust, elevated costs, and safety risks [7–13]. In this situation, magnesium-ion batteries (MIBs) are considered the alternative candidates for LIBs owing to a series of advantages associated with the divalent Mg metal anode, including the high theoretical volumetric capacity (~3833 mAh/cm3), suitable reduction potential (−2.37 V vs. SHE), dendrite-free characteristics, sufficient reserves, and high security [14–16]. Despite the fascinating merits, the development of MIBs still suffers from various obstacles. The sluggish diffusion kinetics and strong polarity of Mg2+, caused by the large ion radius, seriously restrict its migration in host materials, leading to low-rate capability and poor reversible capacity of MIBs. In addition, the charging-discharging processes of high-performance MIBs essentially depend on the efficient insertion/stripping of Mg2+ of the cathode/anode. The selection of suitable electrode materials emerges as a crucial factor in attaining the exceptional performances for MIBs. Mg anode has a tendency to develop irreversible passivation layers between the electrode-electrolyte interface during charge and discharge processes, which imposes severe kinetic barriers to Mg2+ diffusion and electron transfer pathways, ultimately leading to rapid capacity degradation and compromised cycling stability [17–19]. For cathodes, the strong polarization effect and high diffusion barrier of Mg2+ induce strong Coulomb force generates strong electrostatic interactions with the host atoms, resulting in delayed ion diffusion kinetics and insufficient Mg2+ insertion in most traditional cathode materials, ultimately compromising the capacity retention and practical viability of MIBs [20–22]. High-efficiency synthesis and energy storage mechanism of electrode materials with specific morphologies that allow for short pathways and low energy barriers for ion diffusion, as well as large electrolyte/electrode contact area, are of great significance for rechargeable MIBs [23–26]. Consequently, the exploration and development of MIB electrode materials characterized by rapid ion diffusion kinetics, minimal polarization, and superior cycle stability remains to pose significant challenges [27–29].
Heretofore, multiple electrode materials have been synthesized for Mg2+ storage, such as attractive Chevron phase Mo6X8 (X = S, Se) electrode materials reported by Aurbach’s group [30], polyanion compounds [31,32], Prussian blue materials [33,34], and transition metal oxides/sulfides [35–37]. Both Faraday and non-Faraday mechanisms of transition metal oxides (e.g., V2O5 [38,39], MoO3 [40,41], and MnO2 [42,43]) can store charges, which was a material suitable for metal-ion storage. In a variety of transition metal oxides, metallic tungstates have attracted extensive attention in the areas of energy storage and conversion, photocatalysts, sensors, dielectrics, and laser-host materials on account of their high stability, environmental friendliness, and moderate price [44]. MgWO4 demonstrates the charming potential to become an energy storage material owing to its unique monoclinic wolframite configuration crystal structure, good chemical stability, and excellent thermal stability [45,46]. MgWO4 exhibits a scheelite-type monoclinic crystal structure, characterized by a three-dimensional sawtooth chain network topology that arises from the edge-sharing of [WO6] and [MgO6] octahedra along the c-axis direction [47]. Notably, the structural distortions within these octahedral units, coupled with the synergistic charge transfer effect between the cation-oxygen coordination polyhedra, collectively optimize the ion transport kinetics within the lattice channels, greatly substantially enhancing the ion migration efficiency of the material [48,49]. The distinctive structure-performance coupling mechanism offers a novel crystal engineering approach for the design of high-efficiency ion transport. Despite the aforementioned merits of MgWO4, its application as an electrode material for MIBs has still not been investigated.
A large number of studies suggested that electrode materials with exposed crystal planes can provide more storage sites and open paths, resulting in efficient ion transportation and superior electrochemical properties [50,51]. The microstructure adjustment of materials can enhance their abilities to transport ions, thereby achieving the goal of increasing diffusion rate [52]. For instance, Du and co-workers proposed that α-MoO3 sheets with highly exposed (110) crystal plane can facilitate Li+ diffusion, resist large volume changes, and obtain a suitable solid electrolyte inter-phase (SEI) layer [53]. In addition, two dimensional nanosheet structures and three-dimensional layered structures can increase the specific surface area of materials, promote ion migration from the interior to the surface, and improve diffusion rates [44]. Thus, effectively controlling the surface structure and morphology of electrode materials for MIBs is critical to achieving outstanding ion intercalation/deintercalation kinetics and optimizing electrochemical performances [54,55].
The synthesis strategy can greatly influence the morphology and microstructure of materials, as well as their performances in practical applications. Different approaches have been applied to the preparation of MgWO4 micro/nanostructures, including solid-state reaction [56,57], hydrothermal/solvothermal method [58], electrostatic spinning method [59], sol-gel synthesis [60], flux growth method [61], and microwave-assisted technique [62]. Among them, owing to the excellent microwave dielectric properties of MgWO4, the microwave radiation strategy with short reaction time, high product phase purity and selectivity, uniform particle size distribution, and controllable shape has significant advantages [63–66]. Therefore, the controllable synthesis of MgWO4 materials with exposed electrochemical active crystal planes through microwave radiation technology is a feasible strategy to elevate the electrochemical performances of the materials.
Herein, this study employed theoretical calculations and targeted experiments to identify the optimal crystal plane for Mg2+ transfer and obtained MgWO4 materials with a particular exposed crystal facet morphology. According to density functional theory calculations, the results of simulating the insertion and extraction of Mg2+ in the (001), (010), and (100) planes of MgWO4 materials point out that the (001) planes are prone to migration of Mg2+ because of the lowest energy value. Therefore, through the implementation of a microwave radiation strategy, MgWO4 microflower structures with exposed (001) plane successfully prepared as positive electrode materials for MIBs under the reaction time for 30 min. The synthesis mechanism of MgWO4 microflowers elucidated through "self-assembly-dissolution-recrystallization-Ostwald ripening", deriving from the shape and composition evolution over the continuous residence time. Meanwhile, the evaluation of the electrochemical properties of MgWO4 as an active material demonstrated a good initial discharge specific capacity (54.6 mAh/g), a specific capacity (36.8 mAh/g) for the 2nd cycle, and superior cycling stability (a capacity retention rate of 70.9% after 100 cycles). The results of cyclic voltammetry (CV) and electrochemical impedance spectroscopy (EIS) analysis also show that MgWO4 exhibit a good reversibility during the insertion/extraction of Mg2+. A thorough analysis revealed that the rapid diffusion of Mg2+ and excellent electrochemical performance of the MgWO4 microflowers are attributed to the synergistic effect of the visible crystal plane, unique morphology and structure, proving MgWO4 microflowers as one of the most rational and promising electrode materials for the MIBs. This work aims to provide experimental and theoretical concepts for future high performance electrode materials of MIBs and other commercial advanced applications.
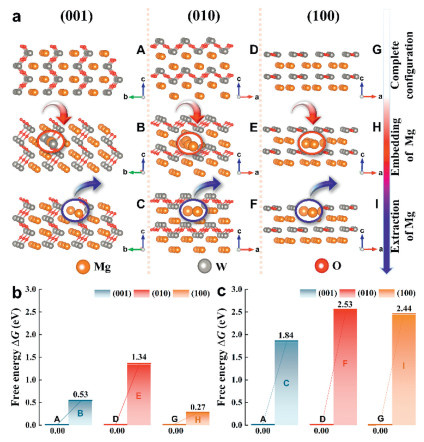
To elucidate the energies of insertion and extraction of Mg2+ into MgWO4 bulk phases with unique structures and surfaces, the first-principle calculations were applied using the Vienna ab initio software package (VASP) with the projector augmented wave method [67–69]. The precise calculation method detailed in the experimental section in Supporting information. Fig. 1 illustrates the simulation of a single Mg2+ embed into MgWO4 through practicable paths from three different crystal planes, including (001), (010), and (100) planes, by establishing and optimizing the MgWO4 structure. Models A, D, and G in Fig. 1 exhibit the initial state of intact MgWO4, with Mg2+ located on the (001), (010), and (100) surfaces. Models B, E, and H demonstrate the structures when Mg2+ expand into their interior and occupy defects. The insertion of Mg2+ from the surface of the MgWO4 into the (001), (010), and (100) planes necessitate overcoming separate these different energy barriers of 0.53, 1.34, and 0.27 eV, respectively. Subsequently, when Mg2+ escape from the interior and generate holes, the situations are shown in models C, F, and I. The energy values that need to be overcome for Mg2+ to escape from the (001), (010), and (100) planes are 1.84, 2.53, and 2.44 eV, respectively. The results indicated that the insertion and extraction of Mg2+ from the (001) plane in the layered crystal structure of MgWO4 only respectively demand overcoming energy barriers of 0.53 and 1.84 eV. In comparison to the other two planes, it has been proven to be the easiest diffusion process, with Mg2+ exhibiting a tendency for insertion and extraction from the (001) facet. Furthermore, from the perspective of an efficient configuration, the (001) plane presents the most accommodating layered structure, which supports the conveyance of Mg2+ and provide a definite direction for material preparation. Based on the important principle of designing battery materials [70], the aforesaid precise density functional theory (DFT) calculation results above indicate that designing MgWO4 electrode material with high exposure (001) crystal plane is the most promising, which is conducive to the rapid migration of Mg2+, thereby achieving superior electrochemical performance and safety of MIBs. Concurrently, it further verifies the magnesium storage mechanism of MgWO4 electrode material, which is in good agreement with the electrochemical performance analysis results.
Figure 1
Figure 1.
The optimized structures of Mg-MgWO4 and the corresponding schematic energy profile: (a) Models A-J reflect the process of Mg2+ insertion and extraction in three planes: (001), (010), and (100). The brown, gray, and red spheres represent the Mg, W and O atoms, respectively. Models A, D, and G show the complete configurations of MgWO4 when Mg2+ respectively located outside (001), (010), and (100) aspects. Model B, E and H illustrate the insertion of Mg2+ from the surfaces to bulks phase of (001), (010) and (100) planes, respectively. Model C, F and I respectively indicate the migration of Mg2+ from the interior to the surfaces of (001), (010) and (100) planes. (b) The bar chart of energy values required for Mg2+ insertion from the surfaces of (001), (010), and (100) planes to the bulk phase with 0.53, 1.34 and 0.27 eV, respectively. (c) The histogram of energy values needed for the migration of Mg2+ from the interior to the surface across (001), (010), and (100) aspects with 1.84, 2.53 and 2.44 eV, respectively.
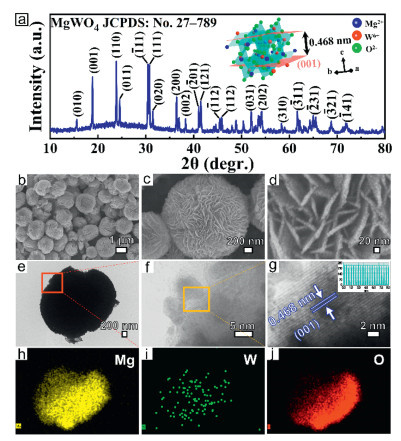
The structure and microtopography of the representative MgWO4 microflowers (Sample 1) were carefully examined through X-ray powder diffraction (XRD), field-emission scanning electron microscopy (FE-SEM), transmission electron microscopy (TEM) and high-resolution transmission electron microscopy (HRTEM) in the Fig. 2. Fig. 2a exhibits the typical XRD pattern of the MgWO4 microflowers obtained through a highly efficient microwave irradiation process at a concentration of 1.000 mmol Mg(NO3)2 and 1.000 mmol Na2WO4 under a dwell time for 30 min. From the pattern, all the diffraction peaks match well with the pure monoclinic phase with cell parameters of a = 4.9288 Å, b = 5.6751 Å, and c = 4.6879 Å, which are corresponding well to the standard values [JCPDS-ICDD card No. 27–789, space group: P2/a (No. 13)]. The main diffraction peaks at 2θ = 15.6°, 18.9°, 23.8°, 24.6°, 30.4°, 30.7°, 31.4°, 36.4°, 38.3°, 41.1°, 41.5°, 45.4°, 45.9°, 52.0°, 54.3°, 58.4°, 61.7°, 65.0°, 68.7° and 72.0° can be indexed to (010), (001), (110), (011), (1¯11), (111), (020), (200), (002), (2¯01), (121), (1¯12), (112), (031), (202), (310), (3¯11), (2¯31), (3¯21) and (1¯21) and (1¯41) planes of pure MgWO4, respectively. Obviously, peaks from impurities were not observed, demonstrating that flower-like MgWO4 was successfully prepared after irradiating for 30 min. Meanwhile, the highly pure monoclinic MgWO4 phase was reconfirmed. The shapes of the characteristic peaks are relatively sharp and extended, indicating high crystallinity and small grain size on the outer surfaces of the as-prepared product, along with its intrinsic properties of ultrafine nanocrystals. The inset of Fig. 2a clarifies that the crystal structure of MgWO4 displays a wolframite-type monoclinic configuration. One W atom is encircled by six O atoms, forming a WO6 octahedral unit. Similarly, one Mg atom is surrounded by six O atoms, constituting an MgO6 octahedron [71]. Consequently, the material consists of alternating layers of WO6 and MgO6 octahedral units, arranged in an alternating fashion along the c-axis and interconnected at their edges, forming a network of serrated chains [72,73]. The structural distortions and charge transfers within the WO6 and MgO6 octahedral units in MgWO4 microflowers facilitate swift ion emigration [74,75].
Figure 2
Figure 2.
Structural characterizations of the flower-like MgWO4 material (Sample 1): (a) Representative XRD pattern of MgWO4 (inset: crystal structure of MgWO4, Mg, W and O atoms are indicated by blue, red and green balls, respectively). (b-d) FE-SEM images of Sample 1 at different magnifications. (e) TEM and images of an individual MgWO4. HRTEM images of an individual MgWO4: (f) An amplification of the area in the red square in (e). (g) The enlargement of the area in the yellow square in (f) and provides the data of inter planar spacing. The inset in (g) explains the interplanar distance profile of the MgWO4. (h-j) The elemental mappings of the single MgWO4 in (e). Mg, W, and O elements in the figure correspond to yellow, green, and red in sequence.
Figs. 2b-d exhibit the FE-SEM images with various magnifications of as-fabricated pure MgWO4 (Sample 1). The low-magnification FE-SEM image in Fig. 2b delivers an overall morphology, indicating that the uniform distribution of multiple microflower structures with diameters between 0.84 and 2.05 μm throughout the whole view of MgWO4 (Fig. S1a in Supporting information). To further elucidate the microstructure of MgWO4, the more amplified images shown in Figs. 2c and d were analyzed. The higher-magnification image (Fig. 2c) further displays that flower-like structures consist of numerous ordered nanosheets with a thickness ranging from 10 nm to 21 nm (Fig. S1b in Supporting information). Most interestingly, these nanosheets have relatively rough surfaces, and assembled by ordered nanoparticles with a diameter of 4–15 nm (Fig. S1c in Supporting information) as illustrated in Fig. 2d. Moreover, the nanosheets interweave with each other at a certain angle to form complex reticulated structures with a large number of pores, which can promote ion transport in cell reaction. Furthermore, the surface morphology and structure of MgWO4 were estimated via the TEM, HRTEM and elemental mappings, as illustrated in Figs. 2e-j. The TEM image of Figs. 2e and f (the enlarged view of the selected red area in Fig. 2e) clearly show the MgWO4 microflower comprised of nanosheets. Additionally, Fig. 2g presents a HRTEM image that provide more details of MgWO4 microflowers (marked by a yellow area). The observable lattice fringes of the monoclinic crystal exhibit a d-spacing of 0.468 nm, corresponding to the neighboring (001) planes of MgWO4, which correlates well with the XRD result (Fig. 2a). The high crystallinity of MgWO4 microflowers aligns well with the profile data (the inset of Fig. 2f). Notably, the data further verified the good crystallization and size homogeneity of microstructures in Sample 1. Moreover, the elemental mapping images clearly indicate that the spatial distribution of Mg, W, and O elements in MgWO4 microflowers, with no unexpected elements detected, hence confirming the purity of the as-obtained product (Figs. 2h-j).
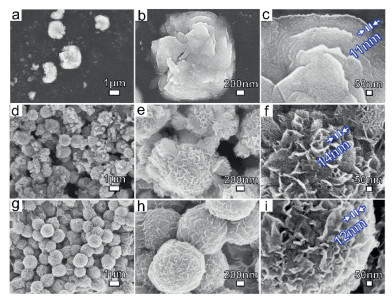
To further investigate the influence of reaction kinetics on the morphology and size of MgWO4 products, the concentrations of Na2WO4 and Mg(NO3)2 were gradually increased from 0.250 mmol to 4.000 mmol while maintaining the Mg/W molar ratio constant. Fig. 3 indicates the FE-SEM images of MgWO4 synthesized through the microwave radiation at varying concentrations of raw materials with 0.250, 2.000 and 4.000 mmol for Sample 2, 3, and 4, respectively (Table S1 in Supporting information). The histogram and fitted normal curves of size distribution of the as-prepared samples are summarized in Figs. S2-S5 (Supporting Information). The FE-SEM images of Sample 2 (Figs. 3a-c) reveal that MgWO4 microspheres with initial persimmon like morphology obtained at the dense of 0.250 mmol. Concurrently, it can be noticed that the MgWO4 micropersimmon (diameter: 1.69–2.32 μm, Fig. S2a in Supporting information) are composed of numerous ultrathin nanosheets with an average thickness of only 11 nm stacked layer by layer together (Fig. S4a in Supporting information). The micropersimmons are present in lower quantities and loosely distributed within the area (Fig. 3a). It is difficult for products to form regular morphologies within a certain reaction time under low reactant concentration conditions. As the concentration increases to 2.000 mmol (Figs. 3d-f), the Sample 3 comprise by many cambered nanosheets aligned in an intersect way, constructing the highly aggregated flower-like microspheres. The individual microsphere has an average diameter of approximately 1.00–1.92 μm (Fig. S2b in Supporting information), which smaller than diameters displayed in Figs. 3a-c. Further surface observation shown in Fig. 3f suggests that the dense nanosheets with a mean thickness of 14 nm (Fig. S4b in Supporting information) lightly extend from the outside of the microspheres. When the concentration of the products extends to 4.000 mmol (Figs. 3g-i), the uniform microspheres are found to share the sizes with a diameter of 0.60–1.61 μm (Fig. S2c in Supporting information). More interestingly, the multilayer nanosheets on the surface of nanospheres become smaller in sizes with the thickness of about 12 nm (Fig. S4c in Supporting information). The thickness of nanosheets decreases as the concentration of reactants rises because the formation of crystal nuclei can be inhibited by the increase in nucleation rate. In summary, the concentration of reactants significantly influences the shape of the products. As the concentration continue to increase, the diameter of MgWO4 microspheres (Figs. 3a, d, and g) were decreased from 1.57 μm to 1.26 μm (Figs. S2 and S3 in Supporting information) by reason of the precipitation reaction kinetics, and the thickness of the nanosheets that make up the microspheres (Figs. 2c, f, and i) first increased and then decreased owing to the competition and limitations between nucleation rate and crystal growth rate (Figs. S4 and S5 in Supporting information).
Figure 3
Figure 3.
The FE-SEM images of exploration on the development process of the MgWO4 microstructures with different concentrations of raw materials with the same concentration ratio (Na2WO4·2H2O: Mg(NO3)2·6H2O = 1:1) (Sample 2–4): (a-c) Sample 2: 0.250 mmol, persimmon-like microspheres. (d-f) Sample 3: 2.000 mmol, flower-like micropheres. (g-i) Sample 4: 4.000 mmol, microflowers.
From the above analyses in Figs. 2 and 3, the optimal conditions for the synthesis of flower-shaped MgWO4 can be selected at a concentration of 1.000 mmol. Driven by the microwave irradiation, the Sample 1 has an excellent flower-like superstructure with uniform sizes and morphologies attributed to the faster nucleation and oriented crystal growth. The regulation of reactant concentration during the synthesis process is crucial for the morphology control of micro/nanomaterials, which is conducive to the rapid synthesis of MgWO4 materials with uniform morphology and high crystallinity, and significantly improves the yield.
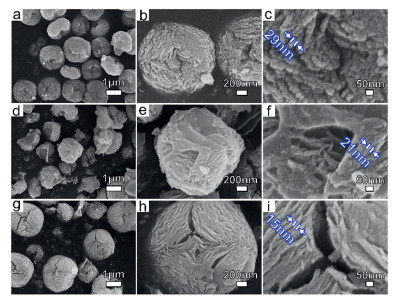
A set of parallel experiments controlled by increasing dwell time of microwave irradiation treatment at the Mg(NO3)2 and Na2WO4 concentrations of 1.000 mmol while other conditions remain unchanged were conducted to deeply understand the entire growth process of the MgWO4 microflowers. The samples at different dwell time stages were continuously inspected and monitored their morphologies via ex-situ FE-SEM technology. Fig. 4 exhibits the high and low-magnification images of MgWO4 microflowers (Samples 5–7) synthesized at different reaction times range from 1 min to 60 min. The normal size distribution curves of the MgWO4 microspheres, nanosheets and the nanoparticles summarized in Figs. S6-S12 (Supporting information). At the beginning microwave irradiation process for only 1 min, as depicted in Figs. 4a and b, MgWO4 microspheres (Sample 5) with a mean diameter of 1.31 μm (Fig. S6a in Supporting information) present the persimmon-shaped structures with rough surface and are dispersed uniformly over the whole view area. The persimmon-shaped microsphere outer surface consists of rough nanosheets. While, the nanosheets (thickness: 29 nm, Fig. S8a in Supporting information) are built from numerous tightly and orderly arranged nanoparticles with an average diameter of 21 nm (Fig. 4c and Fig. S11a in Supporting information). The result further illustrates the MgWO4 microspheres has been rapidly and successfully prepared. When the reaction time extends to 15 min, as presented in Figs. 4d-f, the morphology of MgWO4 (Sample 6) with a mean size of 1.40 μm (Fig. S6b in Supporting information) appears as irregular persimmon-shaped architecture, mainly comprised by the nanosheets with a thickness of about 21 nm (Fig. S8b in Supporting information). The nanosheets are formed by modest amount of ultrafine nanoparticles (size: 19 nm, Fig. S11b in Supporting information). The products exhibit structures with thin micro/nano slices through the "dissolution-recrystallization" process. As the reaction prolongs to 60 min, all the MgWO4 samples show the microsphere structures with smooth surfaces in Figs. 4g-i (diameter: 1.80 μm, Sample 7, Fig. S6c in Supporting information). The microspheres self-organized by closely interwoven multilayered ordered thin nanosheets with a mean thickness of only 15 nm (Fig. S8c in Supporting information). In addition, tightly bundled nanosheets are composed by nanoparticles with a diameter of about 8 nm (Fig. S11c in Supporting information).
Figure 4
Figure 4.
Morphological evolution of MgWO4. Typical FE-SEM images of products prepared via a high-efficient microwave irradiation method with different reaction times: (a-c) 1 min for Sample 5, persimmon microspheres. (d-f) 15 min for Sample 6, irregular persimmon-like microspheres. (g-i) 60 min for Sample 7, microspheres.
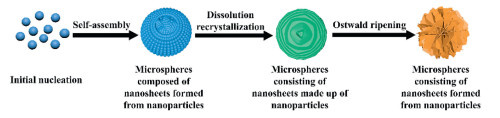
On the basis of monitoring the compositions and morphologies changes at different reaction time (Figs. 4a, d and g), "self-assembly" and "dissolution-recrystallization" courses are proposed to understand the transformation from micropersimmons to flower-like structures. Meanwhile, the thickness of nanosheets composed these microspheres decreased continuously when the reaction time sustained to increase (Figs. 4f and i, Figs. S9 and S10), possibly due to the occurrence of Ostwald ripening. Furthermore, Fig. 5 gives a schematic illustration to explain the whole process. The above-proposed mechanism of assembled flower-like structures was related to the concentration and the duration of microwave irradiation treatment, which can be extended to the design and fabrication of micro/nanomaterials with multicomponent and complex structures with a high efficiency.
Figure 5
Figure 5.
Schematic diagram of the formation process for MgWO4 microflowers with layer structure.
Compelling evidence was provided for explaining the formation of the MgWO4 microflowers according to the above experimental results on crystal structure and morphologies evolution under the condition of constant reaction concentration and continuous reaction for 30 min, as schematically illustrated in Fig. 3. Fig. 5 shows that a "self-assembly-dissolution-recrystallization-Ostwald ripening" synthesis mechanism was utilized to described the possible synthesis route of the MgWO4 microflowers. The microwave-assisted process with an output power of 700 W and a reaction temperature maintained at 100 ℃ provides a large amount of energy to achieve rapid heating, thereby promoting the uniform nucleation and formation of primary nanoparticles. The occurrence of this phenomenon based on the interaction between materials and electromagnetic radiation in microwave heating [76]. The energy from microwave radiation supplies a substantial amount of heat for the reaction, quickly elevating the temperature of the reactants and substantially reducing the reaction time [77]. Under the influence of microwave radiation, these nanoparticles undergo a tight arrangement and self-assembly into MgWO4 microspheres within the reaction time for only 1 min, aiming to minimize their surface energy [78,79]. Concurrently, numerous nanoparticles aggregate and organize in an orderly fashion to form nanosheets. The crystal structure of MgWO4 microspheres exhibited thermodynamic instability under this state, and required convert into more stable structure. By subjecting the material to ongoing microwave irradiation and leveraging its outstanding dielectric traits to generate "hot spot effect", which greatly influences the growth process and governs the resulting size, appearance, and crystalline structure [80]. As the reaction time prolongs, the size of microspheres continues to increase, while the diameter of nanoparticles gradually decreases. When the reaction proceeds for 15 min, small particles with high surface energy inside the product gradually dissolve and redeposit onto larger surface particles layer by layer to form rough nanosheets, which conforms to the dissolution recrystallization mechanism. More interestingly, the nanosheets gradually became smaller and thinner, pores begin to appear between them, and the microsphere morphology becomes irregular. This phenomenon once again indicates that the MgWO4 microspheres have undergone the kinetically controlled dissolution and recrystallization via the high-temperature of microwave function [81]. Under the orientation effect of microwave electromagnetic field, the nanosheets undergo Ostwald ripening process and grow along the dominant direction, gradually decreasing in thickness, and finally forming microflowers composed of smooth nanosheets at a reaction time of 30 min. MgWO4 materials with microwave dielectric properties can absorb more microwaves and convert them into thermal energy. Heat released from the inside of the material to the outside. Some areas of the material will experience overheating, which can be selectively heated to induce and control the morphological changes of the material [82], ultimately obtaining MgWO4 microflowers. The pores on the surface of nanoflower microspheres were evolved from numerous nanoparticles through a thermodynamically controlled "Ostwald ripening" process. As a result, it is worthy of mentioning that microwave radiation technology provides a reliable approach for designing and manufacturing MgWO4 microspheres with the unique microflower structure.
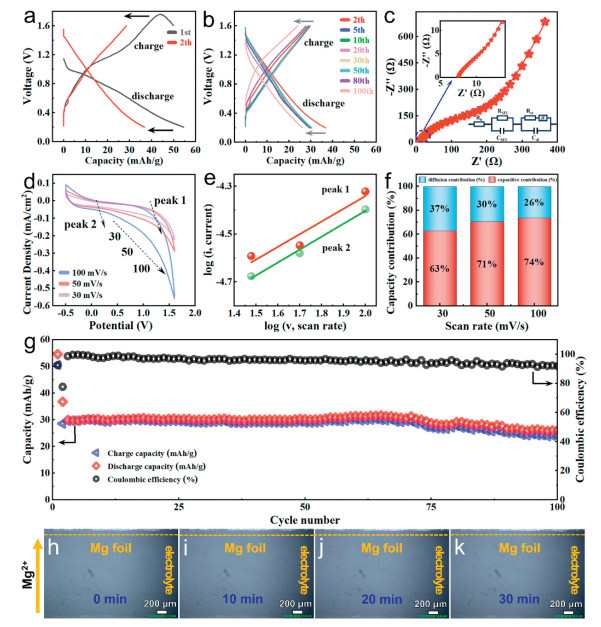
To evaluate the electrochemical performance of MgWO4, the CR2032 coin cells were assembled utilizing magnesium metal and MgWO4 as counter and working electrodes, respectively. The electrochemical tests were carried out at a potential window with 0.20–1.60 V and a current density of 10 mA/g. An excellent reversible capacity of 54.6 mAh/g and an initial coulombic efficiency of 92.6% were obtained in the initial cycle as shown in Fig. 6a. From the galvanostatic charge-discharge (GCD) curves in the Fig. 6a, the discharge plateau appeared at 0.95 V during the initial cycle, and disappeared in the second cycle, indicating irreversible reactions on the electrode surface and the formation of an SEI layer between electrodes. Discharge specific capacity of the second cycle dropped to 36.8 mAh/g. In addition, specific capacity of discharge in the third cycle continued to decline to 30.0 mAh/g, and the specific capacity remained relatively stable. The changes in the discharge curves of the initial three cycles are related to the surface energy changes caused by morphological evolution. At the same time, the GCD curves of MgWO4 exhibit a well reversible charge storage process under 3–100 cycles (Fig. 6b). It can be clearly seen from the graph that the specific capacities of 3–70 loops periods remain relatively stable. Subsequently, the specific capacity showed a slow downward trend. Remarkably, at the current density of 10 mA/g, MgWO4 still able to deliver the capacity of 26.1 mAh/g after 100 cycles, showing the excellent capacity retention of 70.9% compared to the second cycle and the coulomb efficiency remains about 92% (Fig. 6g). The unique structure of MgWO4 can increase the region of contact between the electrode and electrolyte, buffer volume expansion, and thus enhance their cycling stability. At the same time, the (001) facet of MgWO4 with a low energy barrier provided short insertion/extraction pathways for Mg2+ and had active sites to contact with the electrode sufficiently and effectively, greatly reduced polarization. The comparative analysis between metallic vanadate materials with analogous physicochemical properties and crystal structures to tungstate because of the lack of research on tungstate in the field of MIBs (Table S2 in Supporting information). Remarkably, the MgWO4 material developed in this work demonstrates exceptional capacity retention of 70.9% after 100 cycles. When holistically evaluated against critical performance indicators, the material exhibits superior overall metrics. The results underscore significant potential of material for practical application in high-performance MIB systems, warranting further investigation and development.
Figure 6
Figure 6.
Electrochemical properties of MgWO4 in Mg-ion batteries. (a, b) The typical charge/discharge curves of MgWO4 for Sample 1 at a current density of 10 mA/g at 25 ℃. The mass of active material for MgWO4 electrode is 1.32 mg. (c) EIS spectra of MgWO4. (d) CV profiles of MgWO4 at different scan rates from −0.50 V to 1.60 V. (e) The log(i) and log(v) plots of the current response at the two peaks shown in (d). (f) Normalized contribution plots of capacitance and diffusion controlled charge storage at scan rates of 30, 50, and 100 mV/s. (g) Cycling performances of the MgWO4 for 100 cycles between 1.60 V and 0.20 V. (h-k) The cross-section schematic diagram of Mg||MgWO4 battery during a continuous charging process for 30 min.
In addition, the safety of the MIBs was evaluated by monitoring the cross-section of Mg foil in Mg||MgWO4 battery utilizing a dendritic observation microscope. Figs. 6h-k manifested the images of the battery at the 0, 10, 20 and 30 min during charging process, respectively. Fig. S14 (Supporting information) also shows the continuous time image corresponding to the discharge process. Mg foil exhibits excellent stability after 30 min with a dendrite-free platting morphology under the protection of the high exposed (001) crystal facet with the voltage platform of 0.20–1.60 V, as Movies S1 and S2 (Supporting information) display, for the dynamic plating/stripping evolution process corresponding to continuous charging-discharging process for 30 min.
The correlation between MgWO4 morphology/structure and its electrochemical properties was further systematically investigated via SEM observations (Figs. S15–30 in Supporting information). Figs. S15, S19, S23, and S27 show the surface morphology of MgWO4 electrode plates in the initial state, after 1st, 10th, and 20th charge-discharge cycles, respectively. The corresponding elemental mapping images (Figs. S16, S20, S24 and S28) demonstrate homogeneous distribution of Mg, W, O, and C elements across all stages. Pristine MgWO4 electrode exhibit carbon uniformly embedded on the surface of MgWO4 (Figs. S17 and S18). After the first cycle, the MgWO4 remained preserved structural integrity without significant morphological alterations (Fig. S21). Remarkably, the microstructure remains intact after 10 and 20 cycles, demonstrating exceptional structural stability during prolonged electrochemical cycling (Figs. S25 and S29). Comparative analysis shows similar morphology and structure between 20th cycled and pristine electrodes. The elemental mapping images further revealed that the active substance retained throughout the entire electrochemical cycles, thereby confirming excellent cycling stability (Figs. S22, S26, and S30). The nanoscale and unique layered pore structure of MgWO4 provide numerous active sites, which facilitate shorten the diffusion path, expand the contact area between the electrode and electrolyte, and consequently improve the electrochemical kinetics and rate performance.
The resistance of these batteries was assessed in order to further comprehend the electrochemical performance of MgWO4 materials. EIS tests were conducted in the frequency range of 0.01–100 kHz (Fig. 6c). The EIS curve consists of four parts: The real axis intercept in high-frequency region (where the EIS curve intersects with the horizontal axis), the semicircle in the high-frequency region (illustrated above the curve in Fig. 6c), the semicircle in the mid frequency region, and the diagonal line in the low-frequency range. The illustration below the curve in Fig. 6c reflects the equivalent circuit diagram of the MIB system fitted through Z-view software. The high-frequency cross-section related to the solution resistance (Rb) of the system, with a resistance value of 7.95 Ω. The semicircle represents the impedance that arises during the charge transfer process. Among them, the diameter of the semicircle in the high-frequency region corresponds to the resistance (RSEI) of the SEI film, with a resistance value of 3.12 Ω. RSEI generally formed by the oxidation and reduction products of electrolytes that hinders the insertion and extraction of ions between the electrode and electrolyte, resulting in irreversible consumption of Mg2+. This verifies that irreversible reactions occur due to the formation of SEI film in Fig. 6a, leading to the disappearance of discharge plateau and a decrease in specific capacity. The diameter of the semicircle in the intermediate frequency region corresponds to the charge transfer resistance (Rct), which was 294.9 Ω. Generally, the radius of a semicircle in an impedance plot correlates with its resistance value, and a smaller radius indicates a lower resistance. The CSEI and Cdl symbolize the constant phase elements of capacitance caused by SEI film and charge transfer. The low-frequency straight line corresponds to the Warburg impedance (Zw) generated by the diffusion process of Mg2+ in MgWO4 material, and its slope is related to the coefficient of ion diffusion. The larger slope leads to the faster the ion diffusion. To calculate the diffusion coefficient of Mg2+, the following (1), (2) can be used [83,84]:
D0=R2T22A2n2F4C2Aw2
(1)
Z′=R0+RSEI+Rct+Awω−1/2
(2)
In Eq. 1, R is the gas constant (8.314 J/mol), T is the absolute temperature, A (cm2) is the electrode surface area, n is the number of electrons, F represents the Faraday constant, C is the Mg2+ concentration, and Aw is the Warburg coefficient. According to Eq. 2, the Warburg coefficient can be obtained by Z’ and ω−1/2. Figs. S31 and S32 (Supporting information) show the relationship diagram between Z’ and ω−1/2 (overall and diagonal). After calculation, the diffusion coefficient of Mg2+ in MgWO4 material is 1.059 × 10⁻¹³ cm2/s. Based on the analysis of the above results, it can be concluded that the MgWO4 microflower material distinguished by an exposed (001) plane, ultra small grain size of about 9 nm and nanosheets with an average thickness of 16 nm provides a large amount of active surface area for the electrolyte and high porosity is provided between layers. These characteristics make Mg2+ have a shorter reversible insertion and extraction path, thereby achieving better ion diffusion.
In order to further understand the electrochemical kinetics of MgWO4 microflowers as electrodes, CV tests conducted at different scan rates within the potential range of 1.60~−0.50 V vs. Mg/Mg2+. As depicted in Fig. 6d, a pair of oxidation and reduction peaks are observed at various scan rates of 30, 50, and 100 mV/s, which are 1.18 V/0.40 V, 1.19 V/0.41 V, and 1.23 V/0.44 V, respectively, corresponding to the charge-discharge curves in Fig. 6b. The above results can be observed that as the scanning rate increases from 30 mV/s to 100 mV/s, the peak values of each CV curve gradually widen, while the shapes remain similar without significant shifts. This phenomenon suggests the occurrence of reversible electrochemical reactions, the fast kinetics and small polarization. The area under the CV curve depicted in Fig. 6d indicates that capacitance increases as the scanning rate increases. The general method for analyzing the electrochemical kinetics process based on the test data of scanning rate is shown in the following (3), (4) (assuming that the current (i) and scanning rate (v) follow a power law relationship) [85,86]:
i=avb
(3)
log(i)=blog(v)+log(a)
(4)
where i is the current (A), v is the scan rate (mV/s), a and b are variable parameters. Usually, a is a constant, and the coefficient b varies between 0.5 and 1.0. When b is at 0.5, it represents a diffusion limited process; while b reaches 1.0, it indicates a capacitive behavior. The b-value is mainly determined by the slope of the log(i) and log(v) lines. Fig. 6e shows the relationship between log(i) and log(v). The b values determined by the slopes of the oxidation peak (peak 1) and reduction peak (peak 2) at three different scanning rates are 0.53 and 0.54, respectively.
In addition, the contribution of capacitance and diffusion control to the overall capacity was further quantified by using the analysis proposed by Dunn and colleagues [87,88]. The total current response (i) at a fixed potential (v) can be divided into two parts: capacitance effect (k1v) and diffusion control effect (k2v1/2), as described in the following Eq. 5:
i=k1v+k2v1/2
(5)
In the formula, at a specific voltage, k1 and k2 separately represent capacitance and diffusion control. The contribution rate of the capacitance mechanism was calculated at scan rates of 30, 50, and 100 mV/s from this formula (Fig. 6f). According to the above dynamic analysis (Figs. 6e and f), the contribution of capacitance dominates the total capacity, accounting for 63%, 71%, and 74% respectively, which achieved an extended cycle life. Furthermore, with an increase in the scanning rate, the contribution of capacitance gradually amplifies, indicating a diminishing diffusion restriction. The unique MgWO4 microflower structure composed of stacked nanosheets, with numerous gaps between the nanosheets, provides a large number of active sites for accelerating Mg2+ diffusion and shortening the diffusion pathway of Mg2+. From the above comprehensive analysis results concluded that MgWO4 microflower with (001) facet has excellent electrochemical performance, cycling stability and safety. The favorable performances can be attributed to the exposed (001) crystal plane with the relatively low energy barriers, nanoscale dimensions of thickness, and distinctive layered pore structure, which offer numerous active sites and short ion diffusion distances in cells. Consequently, MgWO4 material has great potential for application as a new reversible MIB electrode material.
In summary, DFT calculation guided the successful preparation of MgWO4 microflowers with exposed (001) plane (diameter: 0.84–2.05 μm) via a high-efficient microwave radiation strategy, systematically investigated as a novel electrode material for MIBs. DFT calculations indicate that Mg2+ tends to transport from the (001) crystal plane with lower diffusion barriers, in comparison to the (100) and (010) planes. By precisely modulating the reactant concentration and reaction time, MgWO4 microflower was obtained under the conditions of reactant concentration of 1.000 mmol (Na2WO4·2H2O: Mg(NO3)2·6H2O = 1:1), heating power of 700 W and dwell time for 30 min. The MgWO4 microflower contains 2D nanosheets with a thickness of only 10–21 nm composed of numerous nanoparticles (size: 4–15 nm), and the pore structure formed by stacking layers between nanosheets. Furthermore, the evolution process of the MgWO4 microflower morphology was elucidated, and proposed "self-assembly-dissolution-recrystallization-Ostwald ripening" synthesis mechanism. Electrochemical tests demonstrated that the MgWO4 material manifests a good reversible capacity of 54.6 mAh/g at a current density of 10 mA/g and an impressive lifespan with a capacity of 26.1 mAh/g after 100 cycles. Such a structure offers abundant active sites for Mg2+ transport, provides a large contact area between the electrode and the electrolyte, and promotes rapid electrochemical kinetics, rendering MgWO4 a highly promising candidate for MIB electrodes. This research provides a novel prospect on MIB energy-storage mechanisms and contributes to the design and development of high-performance MIBs.
Declaration of competing interest
The authors declare that they have no known competing financial interests or personal relationships that could have appeared to influence the work reported in this paper
This work was financially supported by the National Natural Science Foundation of China (No. 22379103), the Science and Technology Projects of Suzhou City (No. SYC2022043), the Qing Lan Project of Jiangsu Province (2022), the Joint Funds of Advanced Functional Membrane Materials for the Natural Science Foundation of Anhui Province of China (No. 2408055UM003), and Open Project of State Key Laboratory of Inorganic Synthesis and Preparative Chemistry (2025–17). In addition, the authors are very grateful for the assistance provided by the Bianshui Riverside Supercomputing Center (BRSC) in chemical calculations.
Supplementary materials
Supplementary material associated with this article can be found, in the online version, at doi:10.1016/j.cclet.2025.111181
V. Augustyn, P. Simon, B. Dunn, Energy Environ. Sci. 7 (2014) 1597–1614. doi: 10.1039/c3ee44164d
Figure 1
The optimized structures of Mg-MgWO4 and the corresponding schematic energy profile: (a) Models A-J reflect the process of Mg2+ insertion and extraction in three planes: (001), (010), and (100). The brown, gray, and red spheres represent the Mg, W and O atoms, respectively. Models A, D, and G show the complete configurations of MgWO4 when Mg2+ respectively located outside (001), (010), and (100) aspects. Model B, E and H illustrate the insertion of Mg2+ from the surfaces to bulks phase of (001), (010) and (100) planes, respectively. Model C, F and I respectively indicate the migration of Mg2+ from the interior to the surfaces of (001), (010) and (100) planes. (b) The bar chart of energy values required for Mg2+ insertion from the surfaces of (001), (010), and (100) planes to the bulk phase with 0.53, 1.34 and 0.27 eV, respectively. (c) The histogram of energy values needed for the migration of Mg2+ from the interior to the surface across (001), (010), and (100) aspects with 1.84, 2.53 and 2.44 eV, respectively.
Figure 2
Structural characterizations of the flower-like MgWO4 material (Sample 1): (a) Representative XRD pattern of MgWO4 (inset: crystal structure of MgWO4, Mg, W and O atoms are indicated by blue, red and green balls, respectively). (b-d) FE-SEM images of Sample 1 at different magnifications. (e) TEM and images of an individual MgWO4. HRTEM images of an individual MgWO4: (f) An amplification of the area in the red square in (e). (g) The enlargement of the area in the yellow square in (f) and provides the data of inter planar spacing. The inset in (g) explains the interplanar distance profile of the MgWO4. (h-j) The elemental mappings of the single MgWO4 in (e). Mg, W, and O elements in the figure correspond to yellow, green, and red in sequence.
Figure 3
The FE-SEM images of exploration on the development process of the MgWO4 microstructures with different concentrations of raw materials with the same concentration ratio (Na2WO4·2H2O: Mg(NO3)2·6H2O = 1:1) (Sample 2–4): (a-c) Sample 2: 0.250 mmol, persimmon-like microspheres. (d-f) Sample 3: 2.000 mmol, flower-like micropheres. (g-i) Sample 4: 4.000 mmol, microflowers.
Figure 4
Morphological evolution of MgWO4. Typical FE-SEM images of products prepared via a high-efficient microwave irradiation method with different reaction times: (a-c) 1 min for Sample 5, persimmon microspheres. (d-f) 15 min for Sample 6, irregular persimmon-like microspheres. (g-i) 60 min for Sample 7, microspheres.
Figure 6
Electrochemical properties of MgWO4 in Mg-ion batteries. (a, b) The typical charge/discharge curves of MgWO4 for Sample 1 at a current density of 10 mA/g at 25 ℃. The mass of active material for MgWO4 electrode is 1.32 mg. (c) EIS spectra of MgWO4. (d) CV profiles of MgWO4 at different scan rates from −0.50 V to 1.60 V. (e) The log(i) and log(v) plots of the current response at the two peaks shown in (d). (f) Normalized contribution plots of capacitance and diffusion controlled charge storage at scan rates of 30, 50, and 100 mV/s. (g) Cycling performances of the MgWO4 for 100 cycles between 1.60 V and 0.20 V. (h-k) The cross-section schematic diagram of Mg||MgWO4 battery during a continuous charging process for 30 min.


 DownLoad:

 下载:
下载:


 下载:
下载:

