
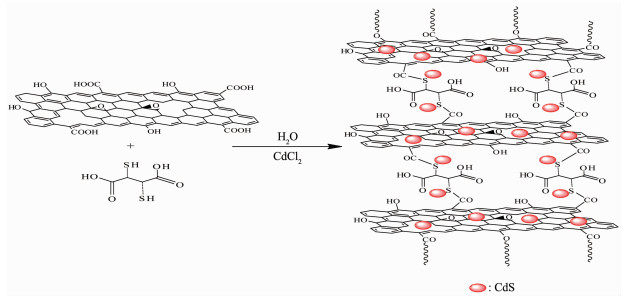
Scheme 1.
Synthesis of three-dimensional CdS@DMSA-GO composites


Visible-light-driven semiconductors capable of efficient solar harvesting have been regarded as the most promising materials in the photocatalytic field, especially for the application in degradation of organic contaiminants and the conversion of solar energy[1-3]. Numerous effective studies have been conducted by different researchers using materials such as hybrid layered hydroxides[4-6], bismuth oxides heterojunction composites[7], copper sulfide nanoparticles[8], and copper sulfide-reduced grapheme oxide composites[9].
Since the conduct band is more negative than the reduction potential for O2/·O2-, cadmium sulfide has acted as an excellent photocatalyst for the degradation of organic dyes[10-11]. However, bulk CdS suffers some serious problems, such as low quantum yield and photocorrosion of S2-, which seriously limit its further utilization in practical wastewater remediation[12]. Composite is a suitable strategy to stabilize the structure and improve the photocatalytic activity of CdS. The incorporation of grapheme oxide (GO) with CdS suppressed the recombination of electron-hole pairs in the semiconductor and favored the separation from wastewater. To date, the fabrications of various CdS-GO composites with 2D structure have been reported, which exhibited excellent photocatalytic activity and stability[13-20].
Organic molecules usually used as cross-linker to improve the structural stability of GO through tuning the interactions between the GO nanosheets[21-22]. The assemble of two-dimensional (2D) graphene nanosheets into a three-dimensional (3D) stereoscopic structure can lead to outstanding adsorption ability due to large specific surface area, facilitate connection between the contaminants and the photocatalytic sites, and enhance the degradation activity[23]. Some works have been done to form thiol functionalized graphene oxide[24-26]. Meso-2, 3-dimercaptosuccinic acid (DMSA), is a molecule with dithiol and carboxylic group, which makes it a well binder to connect two or more GO sheets together. To the best of our knowledge, the incorporation of GO with the molecular containing dithiol and carboxylic has not been reported.
Herein, three dimensional composites CdS@DMSA-GO have been synthesized (Scheme 1), in which DMSA used as a linker to construct 3D structure with GO and as sulfur source for the synthesis of CdS quantum dots in situ. The experimental results indicate that the temperature has an important influence on the structure and properties of the materials. CdS@DMSA-G-100 ℃ composites show the best photocatalytic activity for the degradation of rhodamine B (RhB) and Congo red (CR) under visible light. The possible reaction mechanism for degradation organic dye has also been investigated using the radical scavenger technique. It is hoped that our work could promote further interest in fabrication of various 3D-based composites and their application to visible-light-driven photocatalytic reaction.
All solvents and reagents were analytical grade and used without further purification. DMSA and graphite were obtained from Macklin Biochemical Co., Ltd., China. Tertbutyl alcohol (TBA), ammonium oxalate (AO), benzoquinone (BQ), CdCl2, NH2CSNH2, NaNO2, KMnO4, H2O2, H3PO4, H2SO4, ethylene glycol, RhB, CR was purchased from Shanghai Lingfeng Chemical Reagent Co., Ltd., China.
Fourier transform infrared spectra (FTIR) were recorded on a Shimadzu FTIR-8400S spectrometer with a KBr pellet technique. Ultraviolet-visible (UV-Vis) spectra experiments were performed on a Yuanxi UV-Vis 8000A spectrophotometer. The scanning electron microscopy (SEM) images were taken with a Hitachi S-4800 scanning electron microscope operating at an accelerating voltage of 5.0 kV. The transmitting electron microscopy (TEM) images were recorded on a JEOL-2011 transmission electron microscope at an accelerating voltage of 200 kV. X-ray photoelectron spectra (XPS) experiments were obtained on a Thermo Scientific Esca lab 250XI multifunctional imaging electron spectrometer. The XRD patterns were recorded on a Shimadzu XRD-6000 diffractometer with Cu Kα radiation (λ=0.154 06 nm, voltage of 40 kV, and current of 40 mA, scan range of 2θ=5°~80°).
Graphite oxide (GO) was prepared following Hummer′s method[27] as follows: 1.0 g of graphite powder added to 150 mL of H2SO4 (18.4 mol·L-1) and 20 mL H3PO4 (14.6 mol·L-1) in an ice bath and under stirring. Then, 5.0 g of KMnO4 was slowly added to the suspension, and the temperature was maintained below 10 ℃. Subsequently, the resulting dark green suspension was removed from the ice bath, and its temperature increased to 50 ℃, and maintained at that temperature for 12 h. The synthesis was finished by adding 280 mL of water and 30 mL of H2O2 (30%(w/w)). Finally, the resulting brown colored mixture was washed with diluted HCl (10%(w/w)), ethanol, and water, and then the mixture was dried in a vacuum oven for 12 h at 60 ℃.
10 mg of GO powder was added into 1 000 mL H2O, followed by ultrasonication for 1 h to obtain a homogeneous dispersion of GO (10 mg·L-1). This GO dispersion was used for subsequent synthetic steps. 1 mL 0.1 mol·L-1 of cadmium chloride and 5 mg of DMSA were added to the GO dispersion (50 mL, 10 mg·L-1) under stirring. Transfer the mixture to a Teflon-lined autoclave and heated at 80, 100, 120 ℃, respectively, 8 h. The as-prepared composites (CdS@ DMSA-GO-80 ℃, CdS@DMSA-GO-100 ℃, CdS@ DMSA-GO-120 ℃) were soaked at ethanol and water three days, respectively, for the removing of unreacted substance. Then, the samples were obtained with freeze-dried. In addition, CdS@DMSA-GO-100 ℃ composites were calcined at 200 ℃ in nitrogen to compare the effects of photocatalytic degradation of dyes.
For comparative photocatalytic studies, CdS were separately synthesized using the hydrothermal method. CdCl2 and NH2CSNH2 were used as precursors[28]. Preparation was started by dissolving both the precursors separately in ethylene glycol and then mixing them together by using magnetic stirring. The obtained reaction mixture was then transferred into a 50 mL Teflon stainless-steel autoclave. The autoclave was kept in an oven and heated at 180 ℃ for 2 h and subsequently air cooled naturally. The obtained yellow precipitate was collected after centrifugation at 6 000 r·min-1. The precipitate was washed many times with H2O and absolute C2H5OH thoroughly. Then, the obtained yellow product was placed in an oven for drying at 80 ℃.
Dye adsorption on the CdS@DMSA-GO compo-sites were performed in a batch system at room temp-erature. The experiments were conducted individually for two dyes (RhB and CR), but the same procedure was used for them, detailed as below: the composites (10 mg) added into a dye solution which initial concentration was 10~100 mg·L-1, respectively. At various time intervals, the solution was centrifuged for 2 min at 7 000 r·min-1. Afterwards, supernatant liquid was drawn off and measured using a UV-Vis spectrophotometer at maximum adsorption wavelength of dye. The dye removal efficiency was determined using the follow expression:
|
$ {\rm{Dye}}\;{\rm{removal}}\;{\rm{efficiency}} = \frac{{\left( {{C_0} - {C_{\rm{f}}}} \right)}}{{{C_0}}} \times 100\% $ |
(1) |
where C0 and Cf are the initial and final concentration of dye, respectively. The dye uptake capacity, qe, at equilibrium of the composites was calculated from the following mass balance relationship:
|
$ {q_{\rm{e}}} = \frac{{\left( {{C_0} - {C_{\rm{e}}}} \right)V}}{W} $ |
(2) |
where C0 and Ce are the initial and residual concentra-tion (mg·L-1) of the dye in solution, respectively; and V and W are the solution volume (L) and mass (g) of the composites used for test, respectively.
The photocatalytic activities of the composites were evaluated by the degradation of RhB and CR. The sample powders (10 mg) were dispersed in 50 mL of RhB and CR aqueous solution (50 mg·L-1) in the dark for 200 min to establish the adsorption-desorption equilibrium. Subsequently, the dispersion solution was kept on a magnetic stirrer under a xenon lamp (300 W) equipped with a running water cooling system to keep stable temperature. At an interval of 10 min, the suspension (5 mL) was extracted and filtrated to remove the catalyst particles. The characteristic absorption peak of the supernatants was measured using a Yuanxi UV-Vis 8000A spectrophotometer. The photocatalytic efficiency rate was calculated by the formula as follows:
|
$ {\rm{Efficiency}} = \frac{{{C_{\rm{e}}} - C}}{{{C_{\rm{e}}}}} \times 100{\rm{\% }} $ |
(3) |
where Ce and C represent the concentration of dyes before and after irradiated.
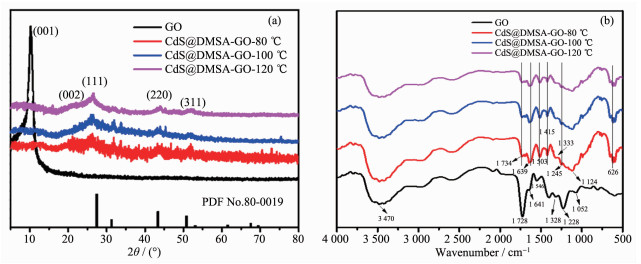
The crystal structures of the CdS@DMSA-GO powders prepared at different temperature were investigated by means of XRD. As shown in Fig. 1a, GO presented a clear diffraction peak around 11.00°, which was indexed to the (001) plane. For the composites samples, a new broad diffraction peak at 21.00°~25.00° appeared, reflecting the (002) plane of graphite, whereas the peak at 11° disappeared. The three samples prepared at different temperature exhibited similar diffraction peaks and the intensities enhanced with the increasing of temperature. All the diffraction peaks could be indexed to at 51.8°, 44.1° and 26.6°, corresponding to the diffractions (311), (220) and (111) lattices planes of isolated cubic phase CdS nanoparticles (PDF No.80-0019), respectively[29-33].
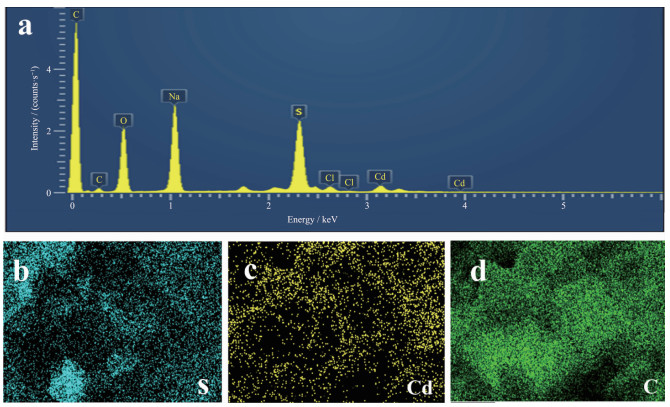
Fig. 1b shows the FT-IR spectra of GO and CdS@DMSA-GO composites. For GO sheets, the broad absorption band at around 3 470 cm-1 corresponded to the stretching vibrations of hydroxyls, and the band at ~1 641 cm-1 was related to the O-H bending modes of residual water molecules. The bands at 1 228 and 1 328 cm-1 were ascribed to the C-O stretching vibra-tions in phenolic hydroxyl groups and tertiary C-OH groups, respectively. The absorption peaks at ~1 052 (C-O stretching vibrations) and 1 728 cm-1 (C=O stret-ching vibrations of COOH groups) were characteristic of the GO sheets. For the composites, absorption bands centered at 1 734 and 1 245 cm-1 weaken, indicating the elimination of C-OH groups and COOH groups during the DMSA reduction process. A new peak located at 1 639 cm-1 emerges, which can be indexed to the skeletal vibration of the graphene sheets[34-36]. Two other weak characteristic bands at 1 333 and 1 124 cm-1 can be attributed to the Cd-S bond, confirming that the composites photocatalyst was composed of DMSA-GO and CdS[24]. Energy-dispersive X-ray spectroscopy (EDX) was performed on the CdS@DMSA-GO composites which determined the elemental composition to comprise Cd (16.8%, w/w) S (29.3%, w/w), O (17.4%, w/w) and C (36.5%, w/w) (Fig. 2a). Fig. 2(b~d) are the elemental mapping diagrams of S, Cd, C in CdS@DMSA-GO composites, respectively. It can be seen from the figures that these elements were evenly distributed on the material. These findings suggest that DMSA-GO is a good supporting matrix for CdS quantum dots.
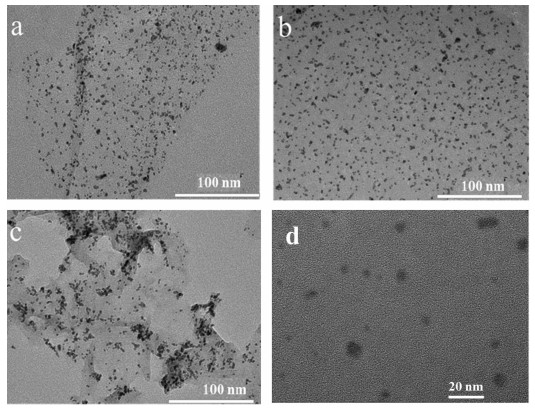
TEM was operated with the samples prepared at 80, 100 and 120 ℃, respectively. As shown in Fig. 3(a~c), there were numerous CdS quantum dots embedded in the DMSA-GO matrix. The synthesized nanoparticle are predominantly spherical, with an average diameters of 2~10 nm (Fig. 3d).
In the SEM images, it could be found that all the CdS@DMSA-GO samples showed an interconnected 3D porous structure (Fig. 4(a~e)). The pores of the 3D network were bounded by walls consisting of thin graphene layers; this indicates the efficient self-assembly of GO with DMSA through the hydrothermal process. Moreover, it could be seen from the SEM images that there were many wrinkles on graphene nanosheets that might be due to the defective structure formed upon exfoliation. CdS quantum dots are distributed uniformly in DMSA-GO matrix (Fig. 4(b~f)).
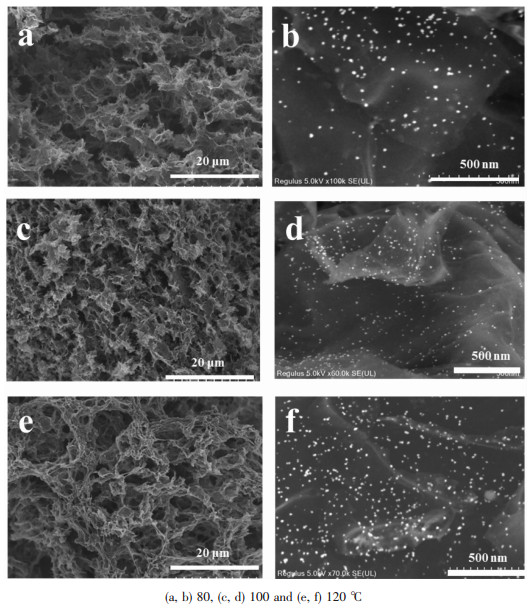
(a, b) 80, (c, d) 100 and (e, f) 120 ℃
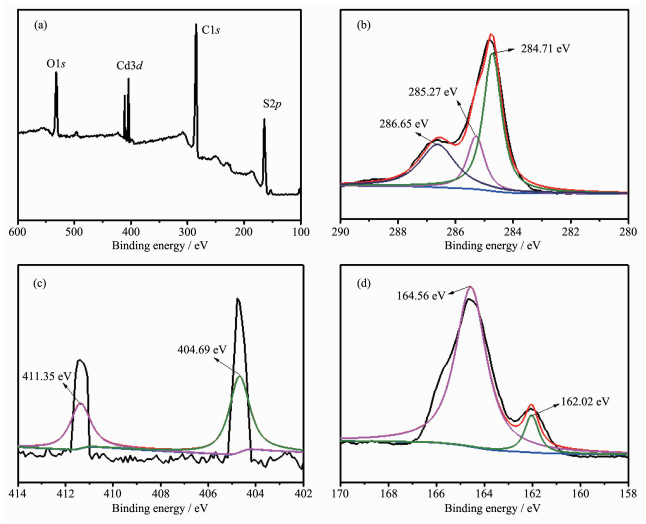
To further analyze and identify surface chemical composition and chemical status of CdS@DMSA-GO, XPS analysis was carried out as shown in Fig. 5. Fig. 5a shows a typical full scanning spectrum of CdS@DMSA-GO samples, and binding energies of C1s, Cd3d, S2p, and O1s appear at corresponding photoelectron peaks, respectively. Three peaks were observed in the spectrum of C1s, in which two peaks corresponding to C-C/C=C (284.7 eV) and C=O (286.65 eV), respectively (Fig. 5b)[37]. The peak at 285.27 eV was attributed to C-S, which indicates that DMSA connect with GO in the composites[34]. In Fig. 5c, the two binding energy peaks at 404.69 and 411.35 eV were ascribed to Cd3d5/2 and 3d3/2 for Cd2+ in CdS[38-39], respectively. XPS spectrum of S2p in Fig. 5d indicates the peaks at 162.02, 164.56 eV, which are corresponding to the binding energy of S2p for S2- in CdS[40].
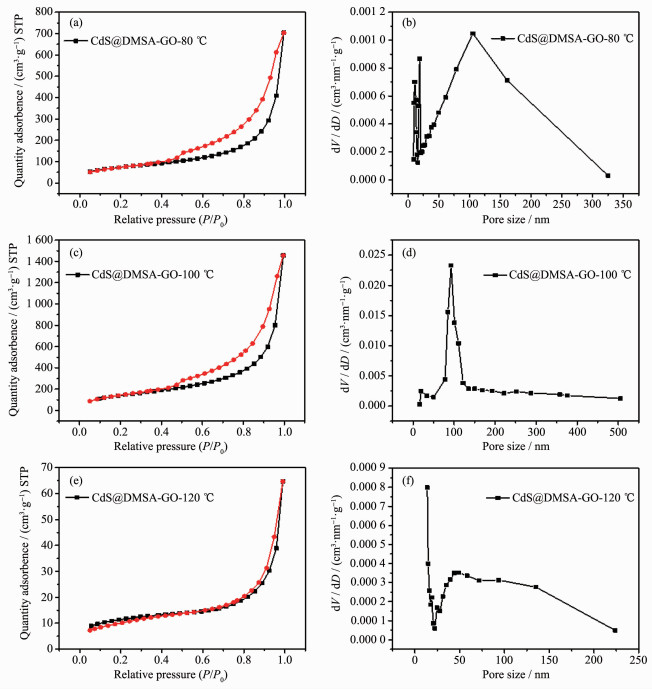
Nitrogen adsorption and desorption measurements were performed to validate the inner architecture of the CdS@DMSA-GO. The nitrogen adsorption-desorption isotherms and the pore size distribution curve are shown in Fig. 6. The BET (Brunauer-Emmett-Teller) surface area was calculated as 476, 874, 28 m2·g-1 for the composites prepared at different temperature of 80, 100, 120 ℃, respectively). As the temperature rised from 80 to 100 ℃, the specific surface area of the composites increased. It may attribute to the loss of solvent in the composites. However, higher temperature (120 ℃) results in the specific surface area of composites decreased. It may due to the more solvent volatilize, the closer the composites packed and the smaller the volume decreased. In addition, the isotherm of CdS@DMSA-GO-80 ℃ and CdS@DMSA-GO-100 ℃ exhibited a hysteresis loop in the P/P0 range of 0.48 to 0.98, and CdS@DMSA-GO-120 ℃ shows a narrow loop. The composites exhibited a large structural porosity. As shown in Fig. 6b and 6f, the pore size distributions of the CdS@DMSA-GO-80 ℃ and CdS@DMSA-GO-120 ℃ show a broad peak in region of 25~300 nm. CdS@DMSA-GO-100 ℃ exhibited the uniform pore size distribution around 100 nm (Fig. 6d).
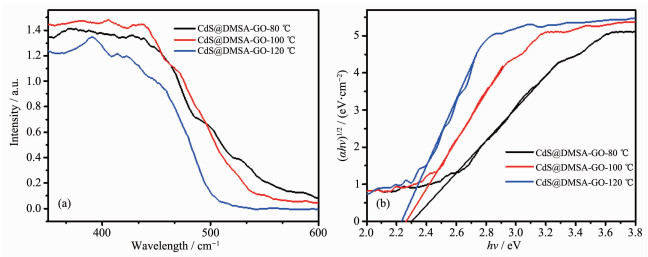
The optical absorption property of semiconductors was characterized by an UV-Vis spectrophotometer. Fig. 7a shows the UV-Vis diffuse reflectance spectra (DRS) of CdS@DMSA-GO composites. For comparison, a simple mixture of CdS and DMSA, GO with the same ratio was also investigated comparatively. All materials exhibited a strong absorption in UV-Vis light region. CdS@DMSA-GO shows a wider absorption region than pristine one, which is probably due to the intrinsic absorption of black colored GO and the possible electronic transition between GO and CdS[27, 29]. In contrast, the absorption region of CdS/DMSA/GO mixture was narrower than CdS@DMSA-GO composites. It can be attributed to the poor interaction between CdS and GO for the simple mixture, which inhibits the electronic transition[19]. The absorption edge for pristine CdS lies on around 530 nm, responsive to visible light. Comparatively, the DRS of CdS@DMSA-GO composites exhibited obvious red shifts, and the visible light absorptions also gradually enhanced with the increasing temperature. Thereby, the deposition CdS into GO extended the absorption range of the composites and promotes visible-light harvesting, which are crucial for superior photocatalytic performance.
The accurate estimation of semiconductor photocatalyst band gap is significantly important for the photocatalytic activity. The optical band gap of photocatalyst was calculated using the following expression equation[41]:
|
$ {\left( {\alpha hv} \right)^{1/n}} = A\left( {hv - {E_{\rm{g}}}} \right) $ |
(4) |
where A is a constant, α is the absorption coefficient, h is the Planck constant, ν is the frequency of vibration, Eg is the band gap of material, and n symbolizes the type of the electronic transition. For direct transition, n=2, and indirect transition, n=1/2. CdS is reported to be a direct band gap semiconductor and the value of n is 2 for the equation[42]. A linear extrapolation of (αhν)1/2 to abscissa at zero provides an estimation of band gap. As shown in Fig. 7b, the band gaps of the samples were determined to be 2.21 (CdS@DMSA-GO-80 ℃), 2.22 (CdS@DMSA-GO-100 ℃), 2.30 eV (CdS@DMSA-GO-120 ℃), respectively. Compared with the traditional materials (hν(TiO2)=3.0 eV, hν(ZnO)=3.2~3.4 eV), the composites we prepared have narrower energy bandwidth and could to absorb more visible light, which is conducive to improving the photocatalytic efficiency.
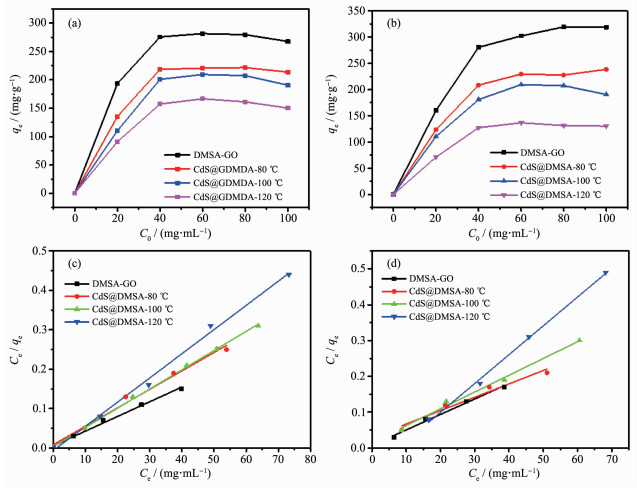
It is well known that the adsorption ability of photocatalyst toward organic pollutants significantly influences photocatalytic activity. Fig. 8 shows the adsorption activities of RhB and CR adsorbed by the as-synthesized composites. All samples displayed similar trends of adsorption, during which the adsorbed amount increased sharply at low initial concentration and then gradually reached a plateau (Fig. 8a and 8b). At the beginning of adsorption, there were adequate surface for RhB and CR molecules to adhere to; hence, almost the entire dyes were removed. With the increase in initial concentration, the dyes molecules were densely packed on the adsorbent surface, leading to desorption. Moreover, increase in concentration provided more force for dye molecules to transfer from solution to the adsorbent surface. Finally, a balance was reached and the composites were saturated. It can be seen that the adsorption capacities of RhB and CR for the samples prepared at 80, 100, 120 ℃ were 220, 209, 166 mg·g-1 (RhB) and 239, 190, 129 mg·g-1 (CR), respectively. The result showed a decreasing trend with the increase in hydrothermal temperature, which might be ascribed to the enhanced overlap of GO nanosheets at high temperature. In contrast, the isothermal adsorption for RhB and CR on DMSA-GO were also measured and the capacity was about 282 and 319 mg·g-1. It was presumed that the formation of CdS quantum dots decreased the porosities of composites.
The Langmuir model was adopted to study the adsorption behavior of the solid-liquid system. The following is the linearized form of the Langmuir equation[43]:
|
$ \frac{{{C_{\rm{e}}}}}{{{q_{\rm{e}}}}}{\rm{ = }}\frac{1}{{{q_{\rm{m}}}k}} + \frac{{{C_{\rm{e}}}}}{{{q_{\rm{m}}}}} $ |
(5) |
where Ce is the equilibrium concentration, qe is the corresponding adsorption capacity, qm is the theoretical maximum adsorption capacity and k is the Langmuir constant related to adsorption energy. Fig. 8c and 8d shows the fitting line based on experimental data while the calculated parameters were listed in Table 1. It can be seen that the value Ce/qe displayed a good linear relationship with qe and the fitting residual squares (R) were all higher than 0.99. The theoretical maximum adsorption capacities were very close to the experimental data. The results confirmed that the adsorption process occurring on the surfaces of the composites belongs to the typical Langmuir type. It was supposed to have a number of active sites on the surface, and once all the active sites are occupied, the composites would form a homogeneous monolayer of dye molecules, with no interaction between each other[44].

 下载:
导出CSV
下载:
导出CSV
| Sample | qm/(mg·g-1) | k/(L·mg-1) | R | qe/(mg·g-1) |
| DMSA-GO (RhB) | 275 | 0.094 | 0.991 4 | 282 |
| CdS@DMSA-GO-80 ℃(RhB) | 238 | 0.142 | 0.983 9 | 220 |
| CdS@DMSA-GO-100℃ (RhB) | 212 | 0.217 | 0.993 7 | 209 |
| CdS@DMSA-GO-120 ℃ (RhB) | 157.7 | 0.451 | 0.998 1 | 166 |
| DMSA-GO (CR) | 298 | 0.154 | 0.991 4 | 319 |
| CdS@DMSA-GO-80 ℃ (CR) | 231 | 0.233 | 0.983 9 | 239 |
| CdS@DMSA-GO-100 ℃ (CR) | 208 | 0.347 | 0.993 7 | 190 |
| CdS@DMSA-GO-120 ℃ (CR) | 122 | 0.556 | 0.998 1 | 129 |
The photocatalytic performances were assessed through photodegradation of the dyes RhB and CR irradiated with visible light. As shown in Fig. 9a and 9b, the decrease in concentrations of RhB and CR were observed for three samples prepared at different temperatures. Blank-CdS, DMSA-GO and CdS@ DMSA-GO-calcined was also used as photocatalyst for comparison. Before photodegradation started, adsorption in the dark was employed for 1 h. It can be seen that the as-prepared composites show excellent adsorption properties and photocatalytic activities. About 96%~98% of dyes were removed by the composites. DMSA-GO exhibited adsorption abilities but poor photocatalytic activities, and only 50%, 40% of RhB and CR are removed, respectively, which result from the rapid recombination of photoexcited charges. The experimental result also shows that blank-CdS has little ability to absorb dye molecules. It exhibited remarkably much lower catalytic activity than CdS@DMSA-GO composites under visible light. It follows that CdS quantum dots combined with DMSA-GO make the photodegradation rate for the composites prominently increased. There is an optimum synergistic interaction between CdS and DMSA-GO for the best photocatalytic performance. However, calcined the CdS@DMSA-GO composites in nitrogen at 200 ℃ result in a dramatic decrease in their photocatalytic capacity. Presumably, high temperature made the material decompose and 3D structure collapse. Therefore, the temperature plays a key role for the formation of CdS quantum dots and the construct the 3D structure of the desired materials, too high or too low temperature decreased the adsprotion and photocatalytic efficiency of the as-synthesized composites. The material obtained at 100 ℃ shows high adsorption capacity and the best photocatalytic ability. It may due to the precursor DMSA connected with GO insufficient at lower temperature and it decomposed at higher temperature.
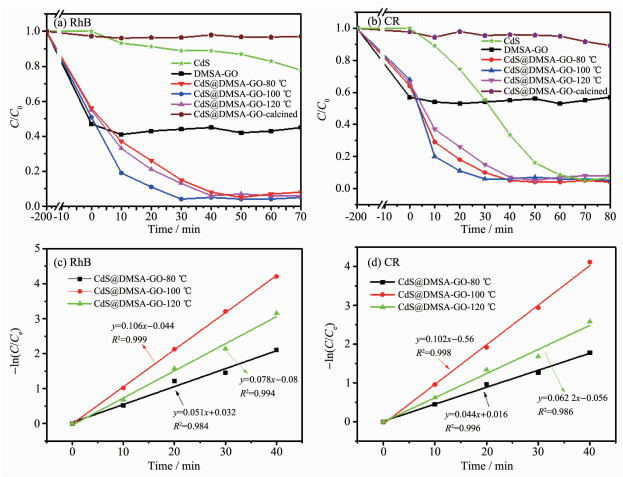
Dye concentration, 50 mg·L-1; catalyst suspended, 10 mg·L-1; duration, 60 min
Kinetic analysis of degradation was performed to investigate the photocatalytic efficiency through a pseudo-first-order reaction model[45]. The equation is given as follows:
|
$ \ln \frac{C}{{{C_{\rm{e}}}}} = - kt $ |
(6) |
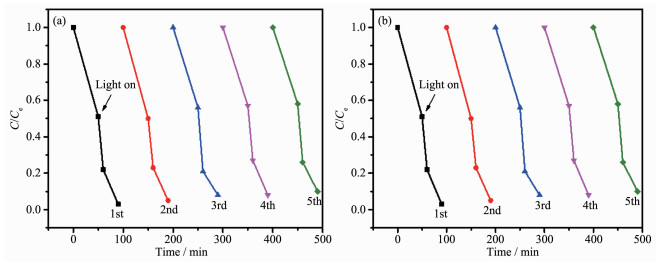
where t is the irradiation time, k is the first-order rate constant, and C and Ce are the concentrations of dye when time is t and at the beginning of irradiation (that is residual concentration after adsorption), respectively. As depicted in Fig. 9c and 9d, all the decomposition rate curves showed good linear relationships, demonstrating that the pseudo-first order model was appropriate. The rate constant of the CdS@DMSA-GO-100 ℃ sample was the best among three samples, showing a great advantage as the photocatalyst.Moreover, the result also indicated that too high or too low temperature decreased the efficiency of the as-synthesized composites. The stability of the composites was evaluated by five cycles of successive photodegra-dation for RhB and CR using the CdS@DMSA-GO-100 ℃ sample.
As shown in Fig. 10, the RhB and CR were successfully photodegraded for five cycles without apparent loss in catalytic activity. After 500 min irradiation for 5 runs, the photocatalytic efficiency of CdS@DMSA-GO composites remained at a high level. The slightly decreased activity may be attributed to the small loss of composites during the cycling reaction. Hardly any Cd2+ was detected in solution after photodegradation. In order to further understand the photocatalytic degradation property of the composites for RhB and CR, we compared its efficiency with other different catalysts reported in the literature as shown in Table 2 and 3. Apparently, the composites we prepared exhibits higher efficiency than other catalysts at the same condition.
 下载:
导出CSV
下载:
导出CSV
下载:
导出CSV
下载:
导出CSV
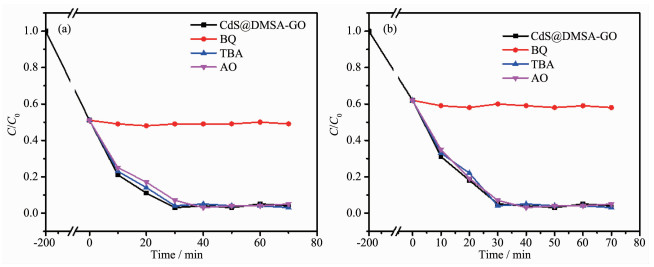
In order to further investigate the main reactive species involved in the photodegradation over the composites, the radical trapping test was performed. Tertbutyl alcohol (TBA, 1.0 mg·mL-1), ammonium oxalate (AO, 1.0 mg·mL-1) and benzoquinone (BQ, 0.1 mg·mL-1) were added to the reaction solution as ·OH, hole and ·O2- radical scavengers, respectively. Different trapping agents were dissolved in the CdS@DMSA-GO-100 ℃ composites solution during the process of degradation of RhB and CR. According to Fig. 11, the addition of BQ greatly suppressed the photocatalytic activity of CdS@DMSA-GO-100 ℃. The addition of h+ (AO) and OH (TBA) scavenger have no apparent effects on the photocatalytic efficiency. The experimental results confirm that the ·O2- radicals are the dominant active oxygen species in the CdS@DMSA-GO photocatalytic process. The possible process of the photocatalytic RhB and CR degradation over CdS@ DMSA-GO composites can be depicted as follows:
|
$ \text{CdS+hv}\to \text{CdS}\left( {{\text{e}}^{-}}_{\text{CB}}\cdots {{\text{h}}^{+}}_{\text{VB}} \right) $ |
|
$ \text{CdS}\left( {{\text{e}}^{-}}_{\text{CB}} \right)\text{+DMSA}-\text{GO}\left( \text{e} \right)+\text{CdS} $ |
|
$ \text{DMSA}-\text{GO}\left( \text{e} \right)+{{\text{O}}_{2}}\to \cdot \text{O}_{2}^{-}\text{+DMSA}-\text{GO} $ |
|
$ \cdot \text{O}_{2}^{-}+\text{dye}\to \text{Degradation}\ \text{products} $ |
|
$ {{\text{h}}^{+}}_{\text{VB}}+\text{dye}\to \text{Degradation}\ \text{products} $ |
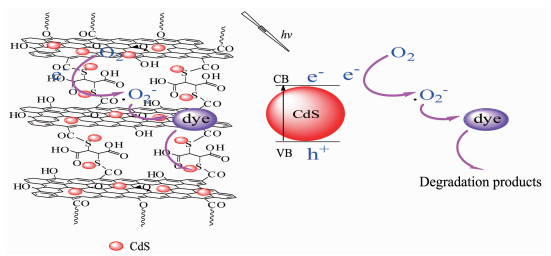
On the basis of the above experiments, a tentative photocatalytic reaction mechanism for dye degradation over CdS@DMSA-GO composites can be schematically proposed in Fig. 12. Under the irradiation of visible light, the electrons are excited from the valence band (VB) of CdS quantum dots in the composites to its conduction band (CB), thereby forming the photoactive electron-hole pairs. Simultaneously, the photogenerated electrons can fleetly transfer to DMSA-GO, which can be further trapped by molecular oxygen absorbed in the composites to activate oxygen and form superoxide radicals, thus efficiently inhibiting the recombination of electron-hole pairs and prolonging the lifetime of electron carriers. The dye can be rapidly adsorbed on the CdS@DMSA-GO composites owing to the large surface area and adsorption capacity and then oxidized and decomposed by the activated oxygen. The hydroxyl groups of DMSA-GO may accept photogenerated holes[34, 38], and thereby inhibit the photocorrosion of CdS resulting from the accumulation of photogenerated holes. Moreover, the strong interactions between CdS and DMSA-GO could decrease the distance between oxide species and contaminant molecules and thus account for the high photocatalytic performance. Hence, the enhancement of photocatalytic performance and stability of CdS@DMSA-GO composites is owing to the involving of DMSA-GO, leading to the efficient charge transfer and the high adsorption capacity of the composite towards organic contaminants. The three-dimensional structure led to a large specific surface area, endowing the composites excellent adsorption abilities. The large adsorption capacities endowed the photocatalyst more opportunities to degrade organic pollutants on the surface. Meanwhile, the DMSA-GO recombined with CdS could also facilitate the catalyst recovery by simple filtration, which is beneficial for the potential applications in water treatment.
In summary, we have synthesized three dimensional CdS@DMSA-GO composites via a one-pot method during which the formation of 3D-DMSA-GO and CdS quantum dots, simultaneously. The material exhibited remarkably high visible light photocatalytic activity for the degradation of organic dye. The 3D architecture led to high absorption ability which benefit to harvest dye molecular close to reaction sites. CdS quantum dots formed in situ and wrapped by the 3D-DMSA-GO provide efficient charge transfer direct to dye molecular and increase catalytic efficiency for the degradation reaction. It is expected that this work could pave the way for developing new challenging photocatalytic materials.
Acknowledgements: We acknowledge financial support from the Natural Science Fund of Education Department of Anhui Province (Grant No.KJ2017A314), Scientific Innovation and Practice Project for the Graduate Student of Anhui Normal University (Grant No.2018kycx041).
Yang X G, Wang D W. ACS Appl. Energy Mater., 2018, 1(12):6657-6693 doi: 10.1021/acsaem.8b01345
Wenderich K, Mul G. Chem. Rev., 2016, 116(23):14587-14619 doi: 10.1021/acs.chemrev.6b00327
Zhu X L, Wang P, Li M M, et al. Catal. Sci. Technol., 2017, 7:2318-2324 doi: 10.1039/C7CY00393E
Meng Y, Zhang X F, Pan G X, et al. J. Hazard. Mater., 2018, 350:144-153 doi: 10.1016/j.jhazmat.2018.02.021
Xia S J, Liu F X, Ni Z M, et al. J. Colloid Interface Sci., 2013, 405:195-200 doi: 10.1016/j.jcis.2013.05.064
孟跃, 夏盛杰, 薛继龙, 等.无机化学学报, 2018, 34(9):1632-1640 doi: 10.1016/S1872-5813(17)30064-6MENG Yue, XIA ShengJie, XUE Ji-Long, et al. Chinese J. Inorg. Chem., 2018, 34(9):1632-1640 doi: 10.1016/S1872-5813(17)30064-6
Wang L, Min X P, Sui X Y, et al. J. Colloid Interface Sci., 2020, 560:21-23 doi: 10.1016/j.jcis.2019.10.048
Chen L H, Li G H. ACS Appl. Nano Mater., 2018, 1(9):4587-4593 doi: 10.1021/acsanm.8b00893
Dutta S, Biswas S, Maji R C, et al. ACS Sustainable Chem. Eng., 2018, 6(1):835-845 doi: 10.1021/acssuschemeng.7b03186
Wang B, Feng W H, Zhang L L, et al. Appl. Catal. B, 2017, 206:510-519 doi: 10.1016/j.apcatb.2017.01.047
Zhu C, Liu C G, Zhou Y J, et al. Appl. Catal. B, 2017, 216:114-121 doi: 10.1016/j.apcatb.2017.05.049
Zhou F Q, Fan J C, Xu Q J, et al. Appl. Catal. B, 2017, 201:77-83 doi: 10.1016/j.apcatb.2016.08.027
Gao P, Liu J C, Sun D D, et al. J. Hazard. Mater., 2013, 250-251:412-420 doi: 10.1016/j.jhazmat.2013.02.003
Gao Z Y, Liu N, Wu D P, et al. Appl. Surf. Sci., 2012, 258:2473-2478 doi: 10.1016/j.apsusc.2011.10.075
Kaveri S, Thirugnanam L, Dutta M, et al. Ceram. Int., 2013, 39(8):9207-9214 doi: 10.1016/j.ceramint.2013.05.025
Liu X J, Pan L K, Lv T, et al. Chem. Commun., 2011, 47:11984-11986 doi: 10.1039/c1cc14875c
Zou L, Wang X, Xu X, et al. Ceram. Int., 2016, 42(1):372-378 doi: 10.1016/j.ceramint.2015.08.119
Mondal S, Sudhu S, Bhattacharya S. et al. J. Phys. Chem. C, 2015, 119(49):27749-27758 doi: 10.1021/acs.jpcc.5b08116
Jia L, Wang D H, Huang Y X, et al. J. Phys. Chem. C, 2011, 115(23):11466-11473 doi: 10.1021/jp2023617
Bera R, Kundu S, Patra A. ACS Appl. Mater. Interfaces, 2015, 7(24):13251-13259 doi: 10.1021/acsami.5b03800
Hu H, Zhao Z B, Wan W B, et al. Adv. Mater., 2013, 25(15):2219-2223 doi: 10.1002/adma.201204530
Wang Y, Wei Z D, Nie Y, et al. J. Mater. Chem. A, 2017, 5:1442-1445 doi: 10.1039/C6TA09734K
Chen C, Zhu X Y, Chen B L. Chem. Eng. J., 2018, 354:896-904 doi: 10.1016/j.cej.2018.08.034
Ma W, Soroush A, Luong L T A, Rahaman M S. J. Colloid Interface Sci., 2017, 501:330-340 doi: 10.1016/j.jcis.2017.04.069
Zhou H, Wang X, Yu P, et al. Analyst, 2012, 137:305-308 doi: 10.1039/C1AN15793K
Yari M, Rajabi M, Moradi O, et al. J. Mol. Liq., 2015, 209:50-57 doi: 10.1016/j.molliq.2015.05.022
Hummers W S, Offeman R E. J. Am. Chem. Soc., 1958, 80:1339-1339 doi: 10.1021/ja01539a017
Singh A P, Kumar S, Thirumal M. ACS Omega, 2019, 4(7):12175-12185 doi: 10.1021/acsomega.9b01133
Teoa P S, Limb H N, Huanga N M. Ceram. Int., 2012, 38(8):6411-6416 doi: 10.1016/j.ceramint.2012.05.014
Wu J L, Shen X P, Jiang L, et al. Appl. Surf. Sci., 2010, 256:2826-2830 doi: 10.1016/j.apsusc.2009.11.034
Bai H, Xu Y X, Zhao L, et al. Chem. Commun., 2009, 45:1667-1669 doi: 10.1074/jbc.C109.022384
Chen F J, Cao Y L, Jian D Z. Ceram. Int., 2013, 39(2):1511-1517 doi: 10.1016/j.ceramint.2012.07.098
Samadi-Maybodi A, Sadeghi-Maleki M R, et al. J. Inorg. Organomet. Polym. Mater., 2018, 28(6):2620-2632 doi: 10.1007/s10904-018-0918-4
Lv J X, Zhang Z M, Wang J, et al. ACS Appl. Mater. Interfaces, 2019, 11(3):2655-2661 doi: 10.1021/acsami.8b03326
Yang K, Chen B L, Zhu X Y, et al. Environ. Sci. Technol., 2016, 50:11066-11075 doi: 10.1021/acs.est.6b04235
Wang J, Chen B L. Chem. Eng. J., 2015, 281:379-388 doi: 10.1016/j.cej.2015.06.102
Shen Y, Zhu X Y, Chen B L. J. Mater. Chem. A, 2016, 4:12106-12118 doi: 10.1039/C6TA04112D
Zhong Y Y, Zhao G, Ma F K, et al. Appl. Catal. B, 2016, 199:466-472 doi: 10.1016/j.apcatb.2016.06.065
Yu G Y, Geng L L, Wu S J, et al. Chem. Commun., 2015, 51:10676-10679 doi: 10.1039/C5CC02249E
Zheng X L, Song J P, Ling T, et al. Adv. Mater., 2016, 28(24):4935-4942 doi: 10.1002/adma.201600437
Bjelajac A, Djokic V, Petrovic R, et al. Appl. Surf. Sci., 2014, 309:225-230 doi: 10.1016/j.apsusc.2014.05.015
Mali S S, Desai S K, Dalavi D S, et al. Photochem. Photobiol. Sci., 2011, 10:1652-1658 doi: 10.1039/c1pp05084b
Tanhaei B, Ayati A, Lahtinen M, et al. Chem. Eng. J., 2015, 259:1-10 doi: 10.1016/j.cej.2014.07.109
Cheah W, Hosseini S, Khan M A, et al. Chem. Eng. J., 2013, 215-216:747-754 doi: 10.1016/j.cej.2012.07.004
Wu Q, Zhou M, Gong Y, et al. Catal. Sci. Technol., 2018, 8:5225-5235 doi: 10.1039/C8CY01522H
Surikanti G R, Bajaj P, Sunkara M V. ACS Omega, 2019, 4(17):17301-17316 doi: 10.1021/acsomega.9b02031
Lee Y Y, Moon J H, Choi Y S, et al. J. Phys. Chem. C, 2017, 121(9):5137-5144 doi: 10.1021/acs.jpcc.7b00038
Natarajan T S, Thomas M, Natarajan K, et al. Chem. Eng. J., 2011, 169:126-134 doi: 10.1016/j.cej.2011.02.066
Liu S Y, Cai Y, Cai X Y, et al. Appl. Catal. A, 2013, 453:45-53 doi: 10.1016/j.apcata.2012.12.004
Zhao X L, Su Y C, Qi X D, et al. ACS Sustainable Chem. Eng., 2017, 5(7):6148-6158 doi: 10.1021/acssuschemeng.7b01040
Zhu H Y, Jiang R, Xiao L, et al. J. Hazard. Mater., 2009, 169:933-940 doi: 10.1016/j.jhazmat.2009.04.037

Figure 2 (a) EDX spectra and the elemental mappings of (b) S, (c) Cd and (d) C of CdS@DMSA-GO-100 ℃ composites

Figure 3 TEM images of CdS@DMSA-GO composites prepared at different temperature of (a) 80, (b) 100 and (c) 120 ℃, and (d) CdS quantum dots in the composites

Figure 4 SEM images of CdS@DMSA-GO composites prepared at different temperatures
(a, b) 80, (c, d) 100 and (e, f) 120 ℃

Figure 5 XPS spectra of CdS@DMSA-GO-100 ℃ composite: (a) full scanning spectrum; (b) C1s; (c) Cd3d5/2; (d) S2p

Figure 6 (a, c, e) Nitrogen adsorption-desorption isotherms and (b, d, f) pore size distribution curves of CdS@DMSA-GO composites prepared at different temperatures

Figure 7 (a) UV-Vis DRS of CdS@DMSA-GO; (b) Kubelka-Munk polts for CdS@DMSA-GO composites band-gap estimation

Figure 8 Adsorption activities of (a) RhB and (b) CR adsorbed by the as-synthesized composites; Adsorption isotherm for the adsorption of (c) RhB and (d) CR on CdS@DMSA-GO composites

Figure 9 (a, b) Time-dependent photodegradation of RhB and CR over the composites photocatalyst and (c, d) the corresponding degradation kinetics
Dye concentration, 50 mg·L-1; catalyst suspended, 10 mg·L-1; duration, 60 min

Figure 10 Cycling runs of the photocatalysts CdS@DMSA-GO-100 ℃ in the photodegradation under simulated sunlight irradiation: (a) Rh B and (b) CR

Figure 11 Time-dependent photodegradation of dyes: (a) RhB and (b) CR over CdS@DMSA-GO-100 ℃ composites in the presence of different scavengers

Figure 12 Proposed mechanism for the photodegradation of dye over CdS@DMSA-GO-100 ℃ composites under the visible light irradiation
Table 1. Parameters of Langmuir adsorption isotherms for the removal of RhB and CR by CdS@DMSA-GO composites
| Sample | qm/(mg·g-1) | k/(L·mg-1) | R | qe/(mg·g-1) |
| DMSA-GO (RhB) | 275 | 0.094 | 0.991 4 | 282 |
| CdS@DMSA-GO-80 ℃(RhB) | 238 | 0.142 | 0.983 9 | 220 |
| CdS@DMSA-GO-100℃ (RhB) | 212 | 0.217 | 0.993 7 | 209 |
| CdS@DMSA-GO-120 ℃ (RhB) | 157.7 | 0.451 | 0.998 1 | 166 |
| DMSA-GO (CR) | 298 | 0.154 | 0.991 4 | 319 |
| CdS@DMSA-GO-80 ℃ (CR) | 231 | 0.233 | 0.983 9 | 239 |
| CdS@DMSA-GO-100 ℃ (CR) | 208 | 0.347 | 0.993 7 | 190 |
| CdS@DMSA-GO-120 ℃ (CR) | 122 | 0.556 | 0.998 1 | 129 |
 下载: 导出CSV

 扫一扫看文章


扫一扫关注我们


 下载:
下载: