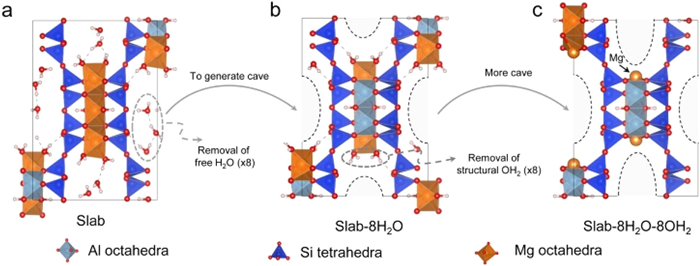
Figure 1.
(a) ATP structure. (b) ATP removing free water (8H2O). (c) ATP removing free water (8H2O) and structured water (8OH2).
Chloride molten salt derived attapulgite with ground-breaking electrochemical performance
Kailong Zhang , Chao Zhang , Luanhui Wu , Qidong Yang , Jiadong Zhang , Guang Hu , Liang Song , Gaoran Li , Wenlong Cai

Currently, commercially available lithium-ion batteries (LIBs) predominantly utilize graphite as the negative electrode material, owing to its good conductivity, high-capacity retention during long-term charge and discharge cycles, and minimal volume change [1,2]. However, as the demand for higher energy density in lithium-ion batteries continues to rise, the relatively low theoretical specific capacity of graphite (372 mAh/g) is gradually becoming insufficient [3–5].
Since the identification of electrochemically active LiFePO4 by Goodenough et al. in 1997 [6], extensive research has been dedicated to transition metal and polyanion compounds ([(XO4)n–, X = P, S, Si…]) as either cathode or anode materials for LIBs or sodium-ion batteries (SIBs) [7–9]. Masquelier et al. conducted a comprehensive review of polyanionic-framework materials, including phosphates, silicates, and sulfates, as electrodes in 2013 [10]. They observed that, although the inclusion of polyanions [(XO4)n–] may reduce the theoretical gravimetric capacity, the associated stable frameworks contribute to the overall durability during the insertion and extraction of "guest" ions. These polyanionic materials exhibit versatility, serving not only as cathode materials but also, in certain instances, undergoing investigation as anode materials, owing to their lower potential and the presence of stable ion channels. Specifically, lithium silicates have been strategically incorporated into the design of advanced silicon based and lithium metal anodes, functioning to mitigate the substantial volume changes and mitigate undesired surface reactions experienced by these anodes during cycling [11–14]. Exemplary anode electrode materials or anode protection materials with low potential include Li4SiO4, Li2SiO3, Li2Si2O5, and Li6Si2O7. These lithium silicates can be co-utilized during the charge/discharge cycles, particularly below 1 V [15].
Slightly different from other clay mineral materials, layered attapulgite ((Mg, Al)2[(OH)2(OH2)4Si8O20]·4H2O) is a natural one-dimensional magnesium-aluminum silicate nanoclay material, composed of Si-O tetrahedral and Al-O octahedral platelets, forming a unique one-dimensional nanochannel structure [16–18]. The presence of crystalline water and exchangeable cations between these layers results in weak interactions, facilitating their easy movement [19]. Its unique structure has attracted researchers to explore its lithium storage properties, such as pre-oxidation and carbonization processes synthesized ATP/polyacrylonitrile aerogel. The carbonized ATP-based aerogel exhibits promising performance as an active negative electrode material for LIBs, demonstrating an average specific capacity of 534.6 mAh/g at a current density of 0.1 A/g after 50 cycles, with a Coulombic efficiency exceeding 97%. On the other hand, researchers have also investigated the utilization of ATP for preparing aerogel anode electrode materials. Namely, Lan et al. [20] developed ATP aerogels doped with silver nanoparticles. Compared to pure ATP aerogels, the composite ATP/Ag aerogels exhibit a significantly increased specific surface area, and the silver nanoparticles provide high conductivity. After 50 cycles at a current density of 0.1 A/g, the discharge capacity of the nanocomposite material is measured to be 133.0 mAh/g. These examples imply the potential application of ATP in lithium storage as a polyanionic type negative electrode material. Notwithstanding the lithium storage properties of ATP that have been tentatively explored, experimental results have shown values significantly lower than its theoretical lithium storage capacity.
Various from traditional material modification methods, this work used molten salt as both the medium of the reaction system and the source of metal cations, aiming to enhance the lithium storage capacity of ATP. More precisely, using the part of I family metal ions present in the molten salt to selectively remove other metal ions that are coordinated with the ATP, such as iron and calcium ions. Meanwhile, the adsorbed water, free water, and structural water would be vaporized with the temperature increasing and the metal ions would occupy the appropriate sites and make the structure more stable, achieving the main skeleton interaction at a certain temperature to induce the phase transformation of the ATP. Based on these advantages, the molten salt-modified ATP retains its original morphology and structural integrity while maximizing its lithium storage capabilities. Such as LiCl molten salt-modified ATP (Li-ATP) exhibited a nearly 7-fold increase in lithium storage capacity (498 mAh/g).
Density functional theory (DFT) calculations were first performed to calculate the theoretical lithium storage capacity of ATP by the Vienna Ab initio Simulation Package [21,22]. The optimized lattice parameters of ATP crystal {Mg6Al4Si16O40(OH)4(OH2)8·8H2O} are as follows: a = 13.81 Å, b = 18.05 Å, c = 5.33 Å, V0 = 1277.65 Å3, and β = 106.09° (Fig. S1 in Supporting information), which are in good agreement with experimental results of a = 13.29 Å, b = 17.85 Å, c = 5.24 Å, V0 = 1185.04 Å3, and β = 107.56° [23]. Some experimental and optimized bond lengths are listed in Table S1 (Supporting information).
Fig. 1a shows the optimized structure of ATP. The structure of ATP, devoid of 8 free water molecules, is referred to as the Slab, as shown in Fig. 1b. To establish a stable Mg octahedron, Mg1 and Mg3 atoms interact with oxygen atoms of the structural water (OH2) in ATP crystal. However, upon the removal of the structural water, the Mg octahedral structure is broken, leading to the exposure of Mg1 and Mg3 atoms (Fig. 1c).
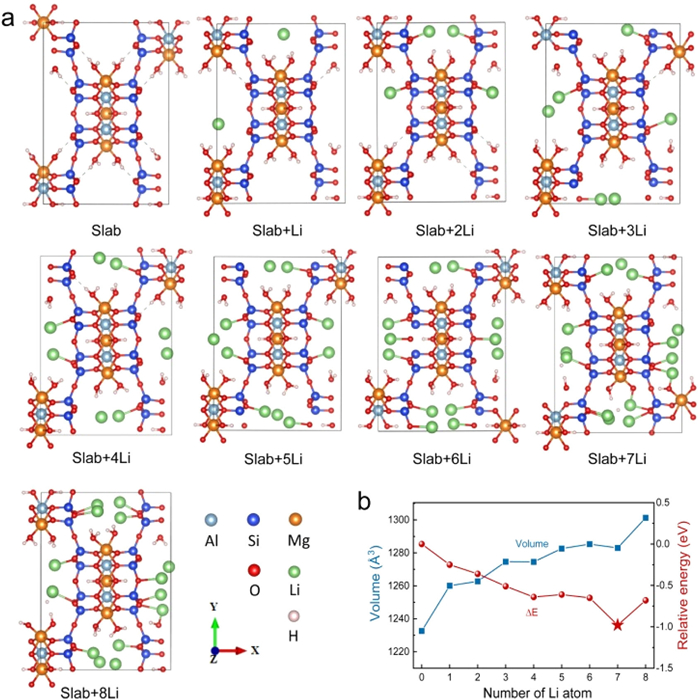
Then, the optimized configurations of filling 1 to 8 lithium atoms in the cave of the Slab were simulated in Fig. 2a. When each cave accommodates 1 Li atom, the Li atom bonds with the O atom. The Si tetrahedral and Al/Mg octahedral structures remain unchanged when each cave is filled with 2–8 Li atoms. Li atoms tend to adsorb on O atoms of Si tetrahedrons. Table S2 (Supporting information) lists the lattice parameters and relative energies (ΔE = Etotal ‒ ESlab ‒ ELi) of the Slab filled with Li atoms. The structure exhibits the highest stability when each cave is filled with 7 Li atoms, as evidenced by the relative energy (Fig. 2b). In addition, a volume expansion of the Slab is observed after filling 8 Li atoms (Fig. 2). When 8 Li is added to each hole, the structure of the Slab undergoes significant deformation, resulting in a volume of 1361.13 Å [24]. Hence, the Slab structure filled with 7 Li atoms is the most stable.
In the calculation process, the premise of the removal of the adsorbed water especially structural water is to ensure that the structure of ATP will not collapse. So, the number of subtracted water molecules is 8, and the hydroxyl group (OH and OH2) in the structural skeleton does not disappear from the DFT simulation. So, the calculated results show that the theoretical specific capacity of ATP should be established on insertion of 14 Li into Mg6Al4Si16O40(OH)4(OH2)8 and the calculated result is 266.2 mAh/g.
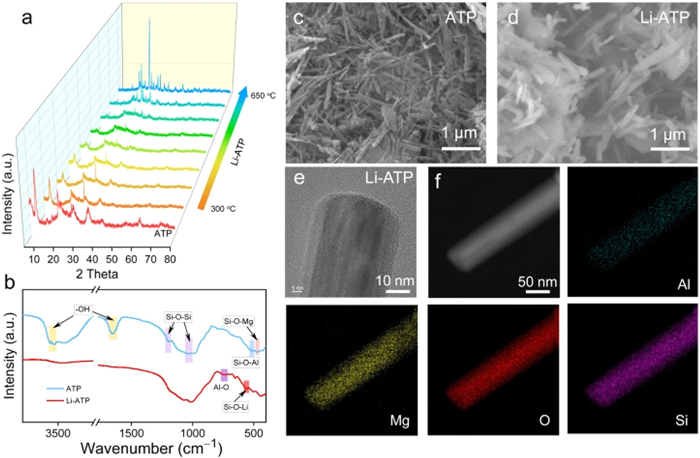
Leveraging the aforementioned theoretical calculations, conventional approaches, such as carbon material coating, encounter challenges in surpassing the theoretical capacity limit. A subtle modification of the molten salt system is anticipated to provide an avenue for augmenting the lithium-ion storage capacity, all the while preserving the structural framework and morphology of the material. This study focuses on lithium chloride molten salt-modified ATP, investigating its formation mechanism, physicochemical properties, and lithium storage capacity. To be first, Fig. S2a (Supporting information) illustrates the main phase of LiCl-modified ATP (650 ℃) is LiAlSi2O6 (PDF#76–0921). Additional peaks corresponding to orthorhombic MgSiO3 (PDF#73–1937) and orthorhombic Li2SiO3 (PDF#29–0828) are also observed. This indicates a significant phase transformation due to lithium ions occupying sites belonging to structural water and hydroxyl groups in ATP. The substitution of Li+ does disrupt the positions of silicon–oxygen tetrahedra, aluminum–oxygen octahedra, and magnesium–oxygen octahedra during the break of the structural water and hydroxyl groups. Similar results are observed in the XRD patterns of ATP modified with NaCl and KCl, resembling the outcomes of constructing MAlSi3O8 (M: Na, K) directly (Figs. S2b and c in Supporting information). In order to further understand the phase transition process of ATP in the molten salt system, XRD at the out-of-situ process temperature was performed. As depicted in Fig. 3a, the dehydration characteristics of ATP itself at different temperatures and the melting point of lithium chloride are examined. The XRD phases after 12 h of calcination at various temperatures during LiCl molten salt modification indicate that ATP's characteristic peak at 2θ = 8.9° remains intact at 300 ℃. Simultaneously, water adsorbed on pores and surfaces evaporates with increasing temperature. As the temperature rises, at 480 ℃, the ATP peak diminishes, and the LiAlSi2O6 crystalline phase gradually emerges, suggesting that, prior to reaching the melting point of LiCl (480 ℃), some lithium ions have already entered the ATP structure due to solid-state contact between LiCl and ATP. Subsequently, at 600 ℃, a substantial number of lithium ions participate in the internal restructuring of ATP, with completion occurring after 650 ℃ [25,26]. During this period, the introduction of molten lithium salt and the gradual disappearance of structural water on the Mg–O octahedra resulted in the generation of a significant amount of non-bridging oxygen. The unsaturated valence of non-bridging oxygen is neutralized through the interaction with lithium ions [23]. Fig. 3b illustrates the FTIR spectra of ATP and Li-ATP. Peak positions are observed at 3550–3610 cm−1, and 1660 cm−1, corresponding to the stretching vibration of the surface –OH groups [27,28]. Bands at 1200 cm−1 and 1050 cm−1, are the bending vibration of Si–O–Si groups and stretching vibration of connected two reverse tetrahedrons [29,30]. The peaks at 513 cm−1 and 471 cm−1 may be assignable to the Si–O–Al and Si–O–Mg stretch, respectively [31,32]. Meanwhile, the observed bands at 567 cm−1 and 750 cm−1 are characteristic of Si–O–Li and Al–O stretching vibration motion in the structure of Li-ATP [33]. The corresponding SEM images of ATP before and after LiCl molten salt modification are shown in Figs. 3c and d. In the images, the intrinsic ATP exhibits a one-dimensional stacked nanofibrous structure with nanoscale dimensions (diameter approximately 20–70 nm, length approximately 0.5–5 µm). After various LiCl molten salt modifications, the one-dimensional morphology is maintained. Similar SEM and TEM images of Na-ATP, and K-ATP are shown in Figs. S3c-f (Supporting information). Due to the mild nature of molten salts, the size of in-situ modified ATP undergoes minimal changes, with only a slight increase in diameter, and a partial alleviation of the stacking phenomenon compared to the pristine ATP. HR-TEM images and elemental distribution of Li-ATP in Figs. 3e and f indicate that Li-ATP maintains a rod-shaped structure with faint one-dimensional nanochannels, resembling ATP's inherent nanochannels. Elements such as Mg, Al, O, and Si are evenly distributed, with enriched content of O and Si on the Li-ATP surface.
Raman spectroscopy in Fig. S4a (Supporting information) was also employed to compare the differences between the two before and after molten salt treatment. The eigenmodes assigned to the most prominent peaks in the Raman spectra (before 700 cm−1) belong to ATP. As mode frequencies decrease, the corresponding eigenmodes evolve from more localized Mg–O (513 cm−1) stretch, O–Mg–O (637 cm−1) bend and O–Si–O (397 cm−1) bend motions to longer-range motions such as silicate sheet deformations caused by silicate tetrahedra rotation and silicate sheet shearing around the Mg octahedral sheets deforming the Mg octahedra [34,35]. The peaks at 491 cm−1 and 681 cm−1 are expected due to the Al–O–Al stretch. Bands at 771 cm−1 and 967 cm−1 are responses to the Si–O bend coming from Li-ATP [36]. Nitrogen adsorption isotherms were measured in Fig. S4b (Supporting information). The specific surface area of ATP and Li-ATP are about 208.89 m2/g and 14.2 m2/g, respectively. Fig. S4c (Supporting information) shows the mesoporous and macropores of the ATP and as-prepared Li-ATP. The main mesoporous scale is under 3.8 nm in ATP, and the distribution of gaps in Li-ATP is primarily in the microporous range. Compared to the original ATP, Li-ATP exhibits high air stability (Fig. S4d in Supporting information). The corresponding material composition is analyzed by XRF and XPS in Tables S3 and S4 (Supporting information), respectively.
Additionally, due to the complexity of the Li-ATP structure, we preliminarily explored the changes in the Mg–O bond lengths in the model where ATP, with eight structural water removed, further eliminates hydroxyl groups from the remaining structural framework. Fig. S5 (Supporting information) shows the structure of the Slab+7Li with the removal of 8 structural water molecules. Table S5 (Supporting information) provides the partial bond lengths of Slab+7Li and Slab+7Li-8OH2. The results after optimization show that the Mg1–O1 and Mg1–O2 bonds are cleaved, and the Mg3–O3 and Mg3–O4 bonds are elongated. However, the Al tetrahedral structure remains essentially unchanged. This also helps to illustrate that the production of non-bridging oxygen does not cause significant changes in the Al–O tetrahedra and Si–O tetrahedra when lithium ions are embedded. This is consistent with the phase characteristics of Li-ATP obtained after molten salt modification.
The electrochemical performance was then investigated. Fig. 4a compares the first charge-discharge curves of the first cycle, showing main capacities coming from below 1.0 V with Li+/Li. Fig. 4b and Fig. S6a (Supporting information) depict CV for Li-ATP and ATP electrodes within the voltage range of 0.01–3 V. Characteristic of silicate anode materials, the plateaus at 1.5 V and 0.75 V result from electrolyte decomposition and its interaction with the surface, leading to the formation of the solid electrolyte interface layer [37]. The EIS plots for ATP and Li-ATP anodes before cycling are illustrated in Fig. S6b (Supporting information). Both curves exhibit a semicircle in the high-to-medium frequency region and a sloped line in the low-frequency region, while the transfer resistance (Rct) for Li-ATP (68.3 Ω) is notably smaller than that of the ATP (159.5 Ω) [38]. The electrical conductivity was further compared in Table S6 (Supporting information), while the electrical conductivity of the original ATP was very poor (8.3 × 10⁻⁶ S/m) and Li-ATP possesses a relatively high electronic conductivity of 1.73 × 10⁻⁵ S/m. The accelerated kinetics processes were then analyzed. CV curves at various scan rates from 0.1 mV/s to 5.0 mV/s were conducted. As depicted in Fig. S7 (Supporting information), both samples exhibit a similar shape at identical scan rates. However, the capacitive contribution of the two samples at a scan rate of 0.2 mV/s is comparable. For the ATP electrode, capacitive behavior dominates in the voltage range of 0–1.0 V, consistent with in situ measurement results. It is confirmed that the excess capacitive capacity of ATP compared to the Li-ATP electrode mainly originates from adsorption in mesopores. Contribution ratios of adsorption capacity at different scan rates of the Li-ATP electrode are displayed in Figs. S7d and S8a (Supporting information). It can be concluded that the original ATP has limited lithium ions storage capacity and diffused performance. The value of b (i = avb, b = 1 for ideal capacitive behavior and b = 0.5 for the diffusion-limited process) is higher than that of Li-ATP at the voltage of peak current, further demonstrating the dominated diffusion of lithium ions with Li-ATP (Fig. S8b in Supporting information) [39,40].
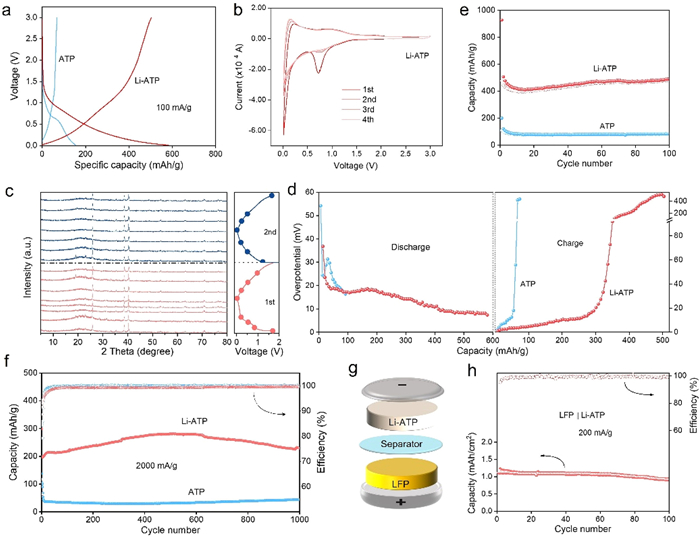
Leveraging the superior lithium storage capability, ex-situ XRD characterization of Li-ATP electrodes during the first two cycles was conducted at every 0.2 V in Fig. 4c. It reveals that within the charging and discharging range (0.01–1.7 V), which means minimal alteration of peak shifting in the crystalline phases of Li-ATP, and maintains the phase stability and low volumetric expansion during charge and discharge cycles [41]. To further understand the benefit of improved structural stability of Li-ATP, galvanostatic intermittent titration technique (GITT) experiments were finally conducted (Fig. 4d and Fig. S9 in Supporting information). Certainly, a higher capacity of 600 mAh/g is achieved at 50 mA/g for Li-ATP, with an ultra-small and diminishing overpotential of < 20 mV during the discharging process. Notably, Fig. 4e displays the cyclic capacity comparison at a low current density of 100 mA/g. The Li-ATP electrode exhibits a nearly 7-fold improvement in lithium storage capacity, reaching 498 mAh/g compared to pristine ATP (72 mAh/g) after 100 cycles at 100 mA/g. In order to reduce the influence of impurities, ATP and Li-ATP were treated with 2 mol/L HCl (Fig. S10a in Supporting information), and it was found that the treated material had little effect on the lithium storage properties. This surpasses the theoretical value of the currently commercialized graphite anode. Even at a high current density of 2000 mA/g, a high capacity of 229.1 mAh/g after 1000 cycles can still be maintained (Fig. 4f), indicating favorable cycling stability and capacity retention for Li-ATP. In order to understand whether this method is universally applicable in improving material properties, the corresponding lithium storage performance of Na-ATP and K-ATP at a current density of 200 mA/g is shown in Fig. S10b (Supporting information). Both of them demonstrate an increase in specific capacitance, but the performance improvement of K-ATP is not as pronounced as that of Li-ATP and Na-ATP. Furthermore, Fig. S11a (Supporting information) explores the charge-discharge specific capacities of Li-ATP and pristine ATP at varying rates. Remarkably, the Li-ATP electrode exhibits higher and reversible capacities across a current range from 100 mA/g to 2000 mA/g, whereas the rate-specific capacity of ATP is relatively lower. Fig. S11b (Supporting information) presents charge-discharge curves at various rates, indicating a decrease in specific capacity with increasing current density. However, the overall trend and plateau of the charge-discharge curves remain unchanged. With a sudden increase in the number of constant current charge-discharge cycles, weak polarization phenomena are observed in the corresponding charge-discharge curves (Fig. S11c in Supporting information). To assess its potential practical application, a coin-type full cell utilizing Li-ATP as the anode and commercial LiFePO4 (LFP) as the cathode was fabricated (Fig. 4g), maintaining an N/P area-capacity ratio of approximately 1.1–1.05:1. With the same loading of anode material, the full cell with Li-ATP presents a higher discharge platform and specific capacity than graphite during the first cycle (Fig. S12 in Supporting information). Fig. 4h shows that the cell achieves an initial discharge capacity of 1.11 mAh/cm2 at 200 mA/g, and maintains a reversible capacity of 0.93 mAh/cm2 after 100 cycles with a capacity retention of 97.7%. Subsequently, the Li-ATP electrode retrieved from the full cell after 100 cycles underwent further investigation to assess its real-world performance. The corresponding SEM image and XRD spectrum in Fig. S13 (Supporting information) underscore the structural and morphological stability of the Li-ATP anode during practical applications in LIBs.
In summary, the chloride molten salt treated method was introduced to enhance its lithium storage capacity of ATP. A detailed investigation was conducted on Li-ATP, including phase transition and physicochemical properties. Compared to the original ATP, an impressive ground-breaking lithium storage capacity (498 mAh/g) was achieved for Li-ATP. And also high phase stability during the repeated charge and discharge cycling was maintained, making it a promising polyanionic anode material. This research introduces a valuable, cost-effective, and scalable method for preparing stable ATP-reinforced nanocomposites as high-performance anodes for LIBs.
The authors declare that they have no known competing financial interests or personal relationships that could have appeared to influence the work reported in this paper.
This work was supported by the Natural Science Foundation of the Higher Education Institutions of Jiangsu Province (No. 22KJB510014), the Research Start-up Fund of Huaiyin Institute of Technology (No. Z301B20514), Foundation of Key Laboratory for Palygorskite Science and Applied Technology of Jiangsu Province (Nos. HPK202102, HPK202303, HPZ202201), Open Project Foundation of National & Local Joint Engineering Research Center for Mineral Salt Deep Utilization (No. SF202306), Postgraduate Research & Practice Innovation Program of Jiangsu Province (No. SJCX23_1851), Huaian Talent Funding for Outstanding Doctors in Universities (Nos. Z302J22517, Z302J22518).
Supplementary material associated with this article can be found, in the online version, at doi:
X. Lu, M. Lagnoni, A. Bertei, et al., Nat. Comm. 14 (2023) 5127. doi: 10.1038/s41467-023-40574-6
W. Cai, C. Yan, Y.X. Yao, et al., Angew. Chem. Int. Ed. 133 (2021) 13117–13122. doi: 10.1002/ange.202102593
C. Du, Z. Zhao, H. Liu, et al., Chem. Record 23 (2023) e202300004. doi: 10.1002/tcr.202300004
M.H. Hossain, M.A. Chowdhury, N. Hossain, et al., Chem. Eng. J. 16 (2023) 100569.
W. Cai, Y. Deng, Z. Deng, et al., Adv. Energy Mater. 13 (2023) 2301396. doi: 10.1002/aenm.202301396
A.K. Padhi, K.S. Nanjundaswamy, J.B. Goodenough, J. Electrochem. Soc. 144 (1997) 1188–1194. doi: 10.1149/1.1837571
Y. Liu, W. Li, Y. Xia, Adv. Funct. Mater. 31 (2020) 2006970.
K. Huang, B. Li, M. Zhao, et al., Chin. Chem. Lett. 28 (2017) 2195–2206. doi: 10.1016/j.cclet.2017.11.010
R. Chen, D.S. Butenko, S. Li, et al., Chin. Chem. Lett. 35 (2023) 108358.
C. Masquelier, L. Croguennec, Chem. Rev. 113 (2013) 6552–6591. doi: 10.1021/cr3001862
X.B. Cheng, R. Zhang, C.Z. Zhao, et al., Chem. Rev. 117 (2017) 10403–10473. doi: 10.1021/acs.chemrev.7b00115
T. Wang, X. Guo, H. Duan, et al., Chin. Chem. Lett. 31 (2020) 654–666. doi: 10.1016/j.cclet.2019.06.002
A. Bhat, P. Sireesha, Y.S. Chen, et al., ChemElectroChem 9 (2022) e202200772. doi: 10.1002/celc.202200772
P. Liu, B. Li, J. Zhang, et al., Chin. Chem. Lett. 34 (2022) 107946.
Y.-S. Su, K.C. Hsiao, P. Sireesha, et al., Batteries 8 (2022) 2. doi: 10.3390/batteries8010002
Q. Yu, J. Liu, Y. Liang, et al., Electrochim. Acta 422 (2022) 140515. doi: 10.1016/j.electacta.2022.140515
C. Yang, Y. Zhang, X. Dong, et al., J. Power Sources 585 (2023) 233669. doi: 10.1016/j.jpowsour.2023.233669
J.C. Chen, Y.P. Wang, H.D. Wang, et al., Chin. Chem. Lett. 21 (2010) 496–500. doi: 10.1016/j.cclet.2009.11.025
W. Sun, X. Sun, N. Akhtar, et al., J. Energy Chem. 48 (2020) 364–374. doi: 10.1016/j.jechem.2020.02.030
Y. Lan, D. Chen, J. Mater. Sci. Mater. El. 30 (2019) 10342–10351. doi: 10.1007/s10854-019-01372-3
G. Kresse, J. Furthmüller, Comput. Mater. Sci. 6 (1996) 15–50. doi: 10.1016/0927-0256(96)00008-0
J.P. Perdew, K. Burke, M. Ernzerhof, Phys. Rev. Lett. 77 (1996) 3865–3868. doi: 10.1103/PhysRevLett.77.3865
S. Ross, A.M. Welsch, H. Behrens, Phys. Chem. Chem. Phys. 17 (2015) 465–474. doi: 10.1039/C4CP03609C
J.E. Post, P.J. Heaney, Am. Mineral. 93 (2008) 667–675. doi: 10.2138/am.2008.2590
W. Hua, S. Wang, M. Knapp, et al., Nat. Commun. 10 (2019) 5365. doi: 10.1038/s41467-019-13240-z
W. Hua, X. Yang, N.P.M. Casati, et al., eScience 2 (2022) 183–191. doi: 10.1016/j.esci.2022.02.007
X. Zhang, Z. Deng, C. Xu, et al., Adv. Energy Mater. 13 (2023) 2302749. doi: 10.1002/aenm.202302749
C.X. Li, J.M. Pan, J. Gao, et al., Chin. Chem. Lett. 20 (2009) 985–989. doi: 10.1016/j.cclet.2009.03.020
Q. Deng, C. Chen, Q. Lei, et al., RSC Adv. 8 (2018) 23382–23389. doi: 10.1039/C8RA04143A
R. Al-Oweini, H. El-Rassy, J. Mol. Struct. 919 (2009) 140–145. doi: 10.1016/j.molstruc.2008.08.025
K. Peng, L. Fu, H. Yang, et al., Sci. Rep. 6 (2016) 19723. doi: 10.1038/srep19723
W. Xue, H. He, J. Zhu, et al., Spectrochim. Acta Part A 67 (2007) 1030–1036. doi: 10.1016/j.saa.2006.09.024
K. Pratibha, S. Gaurav, A.K. Dikshit, et al., J. Lumin. 260 (2023) 119881. doi: 10.1016/j.jlumin.2023.119881
Y. Wang, D. Liang, C. Wang, et al., Renew. Energy 160 (2020) 597–611. doi: 10.1016/j.renene.2020.06.126
D.A. Mckeown, J.E. Post, E.S. Etz, Clays Clay Miner. 50 (2002) 667–680. doi: 10.1346/000986002320679549
A.-M. Welsch, H. Behrens, I. Horn, et al., J. Phys. Chem. A 116 (2012) 309–318. doi: 10.1021/jp209319b
Y. Deng, S. Feng, Z. Deng, et al., J. Energy Chem. 87 (2023) 105–113. doi: 10.1016/j.jechem.2023.08.007
J. Du, R. Zhu, Q. Chen, et al., Appl. Surf. Sci. 617 (2023) 156566. doi: 10.1016/j.apsusc.2023.156566
H. Luo, X. Zhang, Z. Wang, et al., Chem. Eng. J. 469 (2023) 143677. doi: 10.1016/j.cej.2023.143677
W. Hua, J. Zhang, S. Wang, et al., Angew. Chem. Int. Ed. 62 (2023) e202214880. doi: 10.1002/anie.202214880
J. Chen, Y. Yang, Y. Tang, et al., Adv. Funct. Mater. 33 (2023) 2211515. doi: 10.1002/adfm.202211515

Figure 1 (a) ATP structure. (b) ATP removing free water (8H2O). (c) ATP removing free water (8H2O) and structured water (8OH2).

Figure 2 (a) Optimized structures of Li-filled attapulgite. Each cave in the Slab is filled with 1–8 Li atoms. (b) Volume and potential energy of Li-filled attapulgite.

Figure 3 (a) Ex-situ XRD pattern of the as-obtained Li-ATP material preparation process. (b) FTIR spectra of ATP and Li-ATP. SEM images of (c) ATP and (d) Li-ATP. (e) HR-TEM and (f) elemental mappings of Li-ATP.

Figure 4 (a) The first cycle discharge-charge curves of Li-ATP and ATP electrodes. (b) CV curves of Li-ATP electrodes. (c) Ex-situ XRD pattern of the Li-ATP electrode during charging and discharging process. (d) The overpotential from GITT profiles of the second cycle. (e) Cycling performances of the ATP and Li-ATP in lithium ion batteries at 100 mA/g. (f) Long-term cycling of the cell with Li-ATP and ATP electrodes. (g) Full battery assembly model of Li-ATP//LFP full cell and (h) the corresponding electrochemical performance at 200 mA/g.

 扫一扫看文章

扫一扫关注我们
 DownLoad:
 下载:
下载:
 下载:
下载: