Scheme 1.
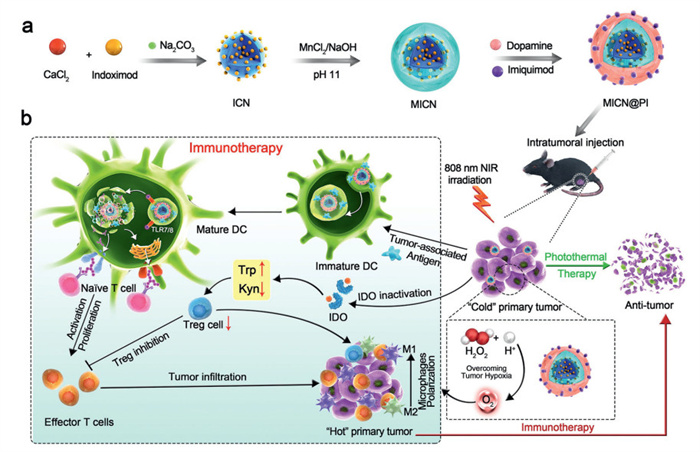
(a) The construction of multifunctional nanoadjuvant MICN@PI and (b) the mechanism of photothermal-immunotherapy for enhanced B16F10 tumor treatment.
Multifunctional nanoadjuvants-aided synergistic photothermal-immunotherapy of tumor
Kaiyue Yang , Yifan Zhang , Shamei Luo , Chenxi Yu , Lin Chen , Qingyu Yu , Chenlu Huang , Guilei Ma , Linhua Zhang , Dunwan Zhu

Cancer remains a severe global health challenge, characterized by high recurrence rates and metastatic potential [1,2]. This is particularly prominent in aggressive malignancies like melanoma, which accounts for the majority of skin cancer related deaths [3]. Melanoma is a lethal cutaneous malignancy driven by aberrant melanocyte proliferation coupled with metabolic and immune dysregulation [4,5], posing significant treatment obstacles. Although inhibitors targeting the indoleamine 2,3-dioxygenase (IDO) pathway, such as indoximod (IND), have demonstrated survival benefits in certain patient subgroups [6], the overall response rate remains suboptimal. More than half of patients fail to respond positively, and approximately one-third experience recurrence [7]. A central challenge in melanoma therapy stems from its distinctive tumor microenvironment (TME) [8,9], which features mild acidity [10], hypoxia [11], and elevated H2O2 levels [12]. These conditions collectively drive rapid tumor proliferation, disrupt metabolic homeostasis, and promote aberrant angiogenesis [13].
This unique TME exacerbates hypoxia induced immune escape and treatment resistance, hinders effective delivery of therapeutic agents to tumor tissue, and establishes an immunosuppressive milieu that suppresses adaptive immunity [14]. Specifically, hypoxia exacerbates acidosis within the TME [15] and directly impairs the function of critical immune effector cells, including natural killer (NK) cells, dendritic cells (DCs), CD8+ T cells, and CD4+ T cells, by suppressing their activation or cytotoxic activity [16]. Concurrently, it confers a survival advantage to regulatory T cells (Tregs) [17] and promotes tumor invasion and metastasis [18,19]. While these adverse properties challenge conventional therapies, they also provide opportunities for developing TME responsive nanoplatforms. Therefore, designing combination strategies that catalytically convert H2O2 to O2 within the TME to remodel immune homeostasis, coupled with the use of immune adjuvants like IDO inhibitors, represents a promising approach to overcome the limitations of current immunotherapies.
Furthermore, photothermal therapy (PTT) is a noninvasive modality that achieves local thermal ablation of primary tumors and releases tumor associated antigens (TAAs) [20,21]. However, monotherapy often fails to effectively suppress metastasis or establish durable antitumor immunity [22]. In this context, the combination of PTT with immunotherapy can activate a systemic T-cell response, ultimately inducing abscopal effects [23]. Recent studies further demonstrate that such a combination markedly improves therapeutic outcomes against distant tumors and lowers the risk of recurrence by remodeling the immunosuppressive TME [24,25].
To overcome these TME barriers, we design a multifunctional dual-modal nanoplatform (denoted MICN@PI). This platform comprises MnO2 driven hypoxia alleviation [26], polydopamine (PDA) mediated photothermal ablation, and the synergistic codelivery of immunomodulators imiquimod (IMQ, a Toll like receptor 7/8 agonist) [27-29] and IND (an IDO inhibitor) (Scheme 1a). The mechanisms of the MICN@PI nanoplatform integrate multifunctional components to enable synergistic antitumor effects (Scheme 1b): (1) CaCO3 nanoparticles facilitate pH-responsive drug release at the tumor site; (2) MnO2 catalytically decomposes excess H2O2 to generate O2, effectively alleviating hypoxia and reversing immunosuppression; (3) PDA mediates rapid hyperthermia under near-infrared (NIR) laser irradiation, inducing immunogenic cell death (ICD); (4) synergistic immune modulation is achieved through IMQ-activated DC maturation and IND-mediated blockade of IDO-dependent tryptophan catabolism, thereby converting immunologically "cold" tumors into "hot" immunogenic tumors. This platform demonstrated excellent performance in eradicating tumors, paving a new avenue for next generation melanoma immunotherapy.
The MICN@PI nanoparticles were synthesized using a stepwise approach. Firstly, in a closed ethanol system, CO2 released from the decomposition of ammonium bicarbonate reacted with Ca2+ to form a pH responsive calcium carbonate core loaded with IND. Subsequently, under alkaline conditions, Mn2+ was oxidized to deposit a catalytic MnO2 layer on the surface, resulting in MICN. Finally, a PDA shell was formed via the self-polymerization of dopamine under mild alkaline conditions, with simultaneous physical adsorption of IMQ, ultimately yielding the multifunctional nanoadjuvant MICN@PI. As shown in Fig. 1a, the average hydrodynamic diameter of ICN was 137.4 nm. After MnO2 coating, PDA modification, and IMQ encapsulation, the average sizes increased to 213.6 nm (MICN), 255.4 nm (MICN@P), and 255.6 nm (MICN@PI) (Figs. 1b-d), respectively. The corresponding zeta potential values were measured as −3.59 mV for ICN, −0.94 mV for MICN, −15.78 mV for MICN@P, and −19.92 mV for MICN@PI (Fig. S1 in Supporting information). Transmission electron microscopy (TEM) images revealed that MnO2 and the PDA layer were successfully coated onto the ICN nanoparticles, which displayed a spherical morphology (Figs. 1e-g). In an acidic environment, the ICN rapidly decomposed, accompanied by the generation of abundant CO2 bubbles (Fig. 1h).
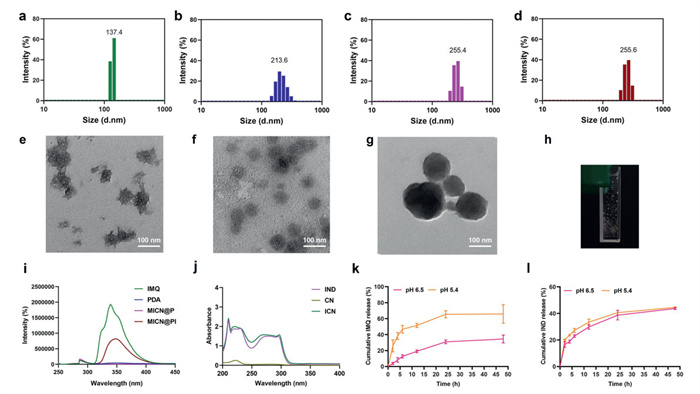
To verify the successful loading of the immunotherapeutic agents IND and IMQ, we examined the fluorescence spectra and ultraviolet visible (UV–vis) absorption spectra of different formulations. Under an excitation wavelength of 246 nm, both free IMQ and MICN@PI nanoparticles exhibited a distinct absorption peak at 348 nm (Fig. 1i). In contrast, no absorption signal was detected for MICN@P, confirming the successful loading of IMQ onto MICN@PI. Additionally, UV–vis absorption spectra showed that both free IND and ICN nanoparticles exhibited a similar absorption peak, whereas CN nanoparticles showed no absorption, further confirming the successful encapsulation of IND within the ICN nanoparticles (Fig. 1j).
The encapsulation efficiency of IND and IMQ was determined to be 87.21% ± 0.60% and 90.29% ± 0.24%, respectively. We next evaluated the release profiles of IND and IMQ from MICN@PI under different pH conditions. As shown in Fig. 1k, the release of IMQ was relatively slow at pH 6.5 (28.8% released). When the pH decreased to 5.4, the cumulative release increased to 60% within 48 h, indicating the acid-triggered sustained release capability of the nanoadjuvant. In contrast, the release of IND from the core structure was consistent at both pH 5.4 and 6.5, exceeding 40% within 48 h in both cases, suggesting that the presence of the PDA and MnO2 layers influenced the release kinetics.
As depicted in Fig. S2a (Supporting information), MICN exhibited a significant O2 generation effect in a H2O2 solution, producing approximately 11 mg/L of O2 within 2 min. In contrast, the phosphate-buffered saline (PBS) and ICN groups showed no notable change in dissolved O2 concentration over 9 min, indicating that the MnO2 component in MICN effectively catalyzes the decomposition of H2O2. Furthermore, as shown in Fig. S2b (Supporting information), cells co-incubated with MICN for 24 h showed a significant reduction in RDPP fluorescence intensity compared to the PBS-treated group. This result demonstrates that MICN can catalyze the conversion of intracellular H2O2 into O2, thereby alleviating tumor hypoxia.
Studies have shown that IDO acts as an immunomodulatory enzyme that suppresses T lymphocyte activity and induces immune tolerance toward tumor cells [30]. IDO, overexpressed in most tumors, facilitates immune escape by promoting the conversion of tryptophan (Trp) to kynurenine (Kyn) and other metabolites, thereby inhibiting effector T cell function. By inhibiting IDO enzymatic activity, the IDO inhibitor IND exerts its antitumor efficacy through reducing Trp degradation. As shown in Fig. S2c (Supporting information), high IDO expression was observed in the presence of interferon (IFN)-γ, but different concentrations of IND did not significantly alter IDO expression levels. Cells treated with ICN or MICN showed a significantly increased Trp/Kyn ratio in the supernatant (Fig. S2d in Supporting information). It is worth noting that due to the PDA coating, the release of IND was slower in the MICN@P and MICN@PI groups, leading to a less pronounced increase in the Trp/Kyn ratio compared to the ICN and MICN groups. These results indicate that the action mechanism of IND is primarily through inhibition of IDO enzyme activity rather than suppression of its expression.
To investigate the photothermal properties of the preformed formulations, the temperature changes of different formulations under 808 nm laser irradiation over time were monitored using an infrared thermal camera. Fig. 2a presented the temperature elevation profiles of different nanoparticles under identical power density and concentration. The results demonstrated that PBS and ICN exhibited negligible temperature changes over 5 min. In contrast, PDA-containing formulations (MICN@P and MICN@PI) displayed significant and cumulative photothermal effects, attributed to the excellent photothermal conversion efficiency of PDA. Subsequent analysis of MICN@PI's thermal profiles at varying power densities with fixed concentration (Fig. 2b) and different concentrations at fixed power density (Fig. 2c) revealed that both higher power densities and increased concentrations led to substantially elevated maximum temperatures within the irradiation period. Representative thermal images of PBS, ICN, MICN, MICN@P, and MICN@PI (Fig. 2d) captured at their peak temperatures under 808 nm laser irradiation provided direct visual evidence of the enhanced photothermal effect conferred by the PDA coating.
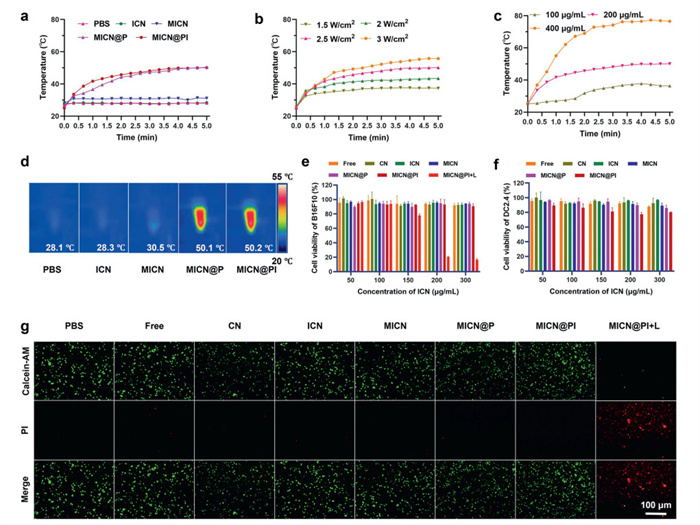
As shown in Figs. 2e and f, cell viability assays demonstrated that the survival rates of both B16F10 melanoma cells and DC2.4 cells remained above 80% after incubation with various concentrations of the formulations, confirming their good biocompatibility in the absence of laser irradiation. However, after laser irradiation, the viability of B16F10 cells treated with MICN@PI (200 µg/mL) dropped below 20%, demonstrating the potent tumor cell killing effect induced by PTT. Live/dead staining (Fig. 2g) further confirmed that laser-induced PTT effectively killed tumor cells.
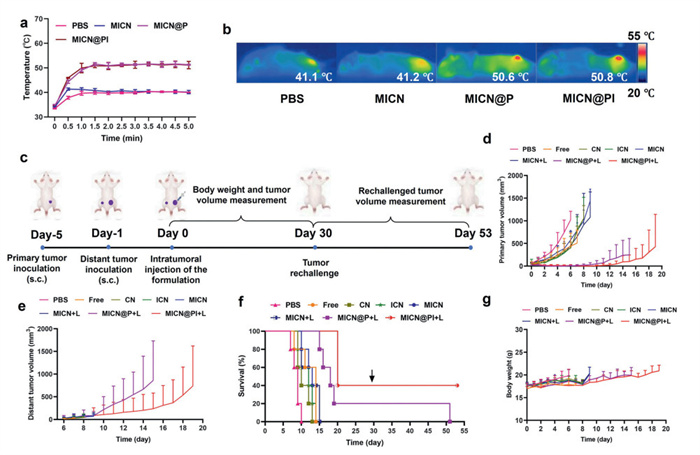
To assess the photothermal effect in mice, 808 nm NIR laser was performed after intratumoral administration. All animal experiments were conducted in accordance with the guidelines for the Animal Ethical and Welfare Committee of the Institute of Radiation Medicine, Chinese Academy of Medical Sciences (approval No IRM-DWLL-2021065). The local temperature changes of the tumor were monitored using an NIR thermal imaging device. Figs. 3a and b present the in vivo temperature elevation curves and representative thermal images of C57BL/6 mice. Notably, MICN@P and MICN@PI exhibited pronounced cumulative photothermal effects, consistent with their in vitro performance. Based on the in vitro and in vivo photothermal results, B16F10 bilateral tumor-bearing mouse model was established to further evaluate the antitumor efficacy (Fig. 3c). As shown in Figs. 3d and e, the tumor growth curves for different treatment groups revealed no significant tumor suppression without laser irradiation. Even with laser exposure, the MICN group showed rapid tumor growth, with the primary tumor volume exceeding 2000 mm3 by day 10. In contrast, the MICN@P + L and MICN@PI + L groups displayed significant inhibition of primary tumor growth, attributable to the photothermal effect of PDA under laser irradiation. Importantly, the MICN@PI + L group showed markedly slower growth of both primary and distal tumors compared to the MICN@P + L group. It may be due to the enhanced immune response triggered by the loaded TLR agonist IMQ. As depicted in Fig. 3f, all mice in the control groups had succumbed by day 15. In contrast, the commencement of mortality was delayed until day 15 in the MICN@P + L group and day 20 in the MICN@PI + L group, with one and two mice remaining alive. Upon tumor rechallenge on day 30, both surviving mice in the MICN@PI + L group resisted tumor growth and survived for the remainder of the study. Body weight data (Fig. 3g) indicated no significant weight loss in any group during the observation period, suggesting the treatments had no adverse effects on mouse health. To evaluate the potential systemic toxicity of our nanoplatform, histopathological analysis of major organs was performed. As shown in Fig. S3 (Supporting information), no significant lesions or signs of damage were observed in the heart, liver, spleen, lung, or kidney across all treatment groups, confirming the favorable biosafety of MICN@PI.
On day 7 post-treatment, tumor-draining lymph nodes (TDLNs) were harvested and processed into single-cell suspensions. Cells were stained with anti-mouse CD40 and anti-mouse CD11c antibodies followed by flow cytometry analyzation. As shown in Figs. 4a and e, the proportion of CD40-expressing DCs in the TDLNs was significantly elevated in the MICN@PI + L group (26.4%) compared to the PBS group (7.41%). Specifically, laser-induced tumor disruption released TAAs in concert with the immunostimulant IMQ promoted DC maturation. This finding suggests that MICN@PI + L successfully synergized PTT with immunotherapy.
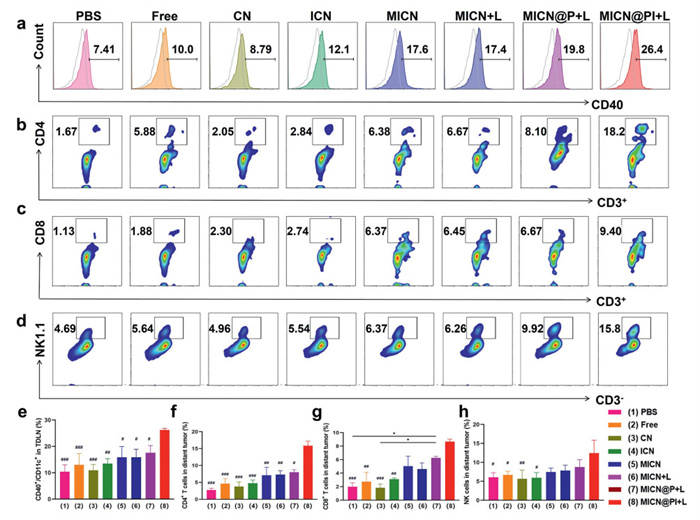
To further evaluate the immune response, we collected the distal tumor tissues and prepared them into single-cell suspension on the 7th day. The proportions of helper T cells (Ths) and cytotoxic T lymphocytes (CTLs) were detected by flow cytometry. The results showed a significant increase in Th infiltration within the distal tumors of MICN@PI + L-treated mice (reaching 18.2%) compared to the other groups (Figs. 4b and f). The CTL infiltration rate in the MICN@PI + L group was 9.4%, approximately 8 times that of the PBS group (Figs. 4c and g). Flow cytometry analysis further indicated a modest increase in the infiltration of NK cells (CD3−NK1.1+) into distal tumors, from 4.69% in the PBS group to a peak of 15.8% in the MICN@PI + L group (Figs. 4d and h).
On day 7 post-treatment, spleen tissues from each group were also processed into single-cell suspensions. Flow cytometry analysis revealed that the proportion of Ths in the spleens of MICN@PI + L-treated mice (25.4%) was significantly higher than that in other groups (Figs. S4a and e in Supporting information). Similarly, the proportion of CD3+CD8+ T cells in the MICN@PI + L group (13.8%) was also markedly increased compared to other treatment groups (Figs. S4b and f in Supporting information). These results indicate that the combined photothermal-immunotherapy successfully induced a systemic immune response, further confirming the activation of Ths and CTLs, which are crucial for effective antitumor immunity.
On day 7 post-treatment, splenocytes were stained with anti-mouse antibodies to detect the levels of myeloid-derived suppressor cell (MDSC) and macrophage subsets. The results showed that the MDSC infiltration rate was 31.0% in the PBS group (Figs. S4c and g in Supporting information). Notably, the most pronounced reduction observed in the MICN@PI + L group, where the proportion of MDSC decreased to 8.71%. Further analysis of macrophage subsets revealed a significant decrease in the proportion of M2 macrophages (F4/80+CD206+) in MICN@PI + L group (7.8%), demonstrating the polarization of macrophages from M2 type to M1 type (Figs. S4d and h in Supporting information).
On day 7 post-treatment, spleen tissues were harvested and processed into single-cell suspensions to assess T cell activation. As shown in Figs. S5a, b, e, and f (Supporting information), the expression levels of CD69 on the surface of CD3+CD4+ and CD3+CD8+ T cells were significantly elevated in the MICN@PI + L treatment group compared to the other groups, indicating that MICN@PI-based PTT combined immunotherapy induced potent T cell activation.
Cytokines secreted by T cells, such as IFN-γ and tumor necrosis factor (TNF)-α, play key roles in antitumor immunity. IFN-γ exerts direct cytotoxicity on tumor cells, while TNF-α promotes cell death and enhances immune responses. Flow cytometry analysis showed that the MICN@PI + L group exhibited the most prominent IFN-γ and TNF-α secretion by CD3+CD8+ T cells, indicating that the strategy effectively activated antigen-specific T cells and significantly enhanced the antitumor immune response (Figs. S5c, d, g, and h in Supporting information).
This study developed a multifunctional nanoadjuvant (MICN@PI) that addresses key bottlenecks in melanoma therapy by integrating MnO2-driven hypoxia alleviation, photothermal ablation, and synergistic immune activation mechanisms. The nanoplatform reverses the immunosuppressive status of the TME by catalytically converting overexpressed H2O2 into O2, while simultaneously utilizing PDA-mediated PTT under NIR irradiation to generate TAAs. The synergistic action elicits a robust systemic antitumor immune response, which is characterized by enhanced CTLs and Ths responses, increased secretion of IFN-γ and TNF-α, and a reduction in MDSCs and M2-polarized macrophages. In vivo experiments demonstrated primary tumor regression, significant inhibition of distant metastasis, and prolonged survival (100% survival rate after rechallenge). Overall, MICN@PI provides a rationally designed paradigm for synergistic photothermal-immunotherapy, offering a translatable therapeutic strategy for tackling aggressive malignancies beyond melanoma.
The authors declare that they have no known competing financial interests or personal relationships that could have appeared to influence the work reported in this paper.
Kaiyue Yang: Writing – original draft, Methodology, Investigation, Formal analysis, Data curation. Yifan Zhang: Investigation, Formal analysis, Data curation. Shamei Luo: Methodology, Investigation. Chenxi Yu: Formal analysis, Data curation. Lin Chen: Formal analysis, Data curation. Qingyu Yu: Resources, Methodology, Formal analysis. Chenlu Huang: Writing – review & editing, Supervision, Project administration, Funding acquisition. Guilei Ma: Supervision, Funding acquisition. Linhua Zhang: Writing – review & editing, Supervision, Project administration, Funding acquisition, Conceptualization. Dunwan Zhu: Writing – review & editing, Supervision, Project administration, Funding acquisition, Conceptualization.
This work was supported by National Natural Science Foundation of China (Nos. 82302390, 82172090 and 82172089); National Key R&D Program of China (No. 2024YFC2418700); Noncommunicable Chronic Diseases-National Science and Technology Major Project (No. 2023ZD0500800); CAMS Innovation Fund for Medical Sciences (Nos. 2021-I2M-1–058, 2022-I2M-3–003 and 2023-I2M-2–008); Natural Science Foundation of Tianjin Municipality (Nos. 24JCZDJC00270, 24JCZDJC00560, 24ZXZSSS00200 and 25JCYBJC00390).
Supplementary material associated with this article can be found, in the online version, at doi:
R.L. Siegel, T.B. Kratzer, A.N. Giaquinto, et al., CA Cancer J. Clin. 75 (2025) 10–45. doi: 10.3322/caac.21871
Y. Yin, J. Guo, S. Zhang, et al., Chin. Chem. Lett. 36 (2025) 110771. doi: 10.1016/j.cclet.2024.110771
X. Li, X. Zhang, S. Zhao, et al., Clin. Cancer Res. 31 (2025) 2478–2494. doi: 10.1158/1078-0432.ccr-24-2971
P.P. Centeno, V. Pavet, R. Marais, Nat. Rev. Cancer 23 (2023) 372–390. doi: 10.1038/s41568-023-00565-7
Y. Wu, R. He, B. Tan, et al., Chin. Chem. Lett. 37 (2026) 111339. doi: 10.1016/j.cclet.2025.111339
Z.Q. Liu, M.T. Ciudad, T.L. McGaha, Trends Cancer 11 (2025) 629. doi: 10.1109/isctis65944.2025.11065633
J. Choi, B. Park, J.Y. Park, et al., Adv. Mater. 36 (2024) e2405475. doi: 10.1002/adma.202405475
M. Wei, T. Yin, C. Chu, et al., ACS Nano 19 (2025) 25830–25850. doi: 10.1021/acsnano.5c04580
J. Sun, L. Huang, W. Jia, et al., Chin. Chem. Lett. 37 (2026) 112036. doi: 10.1016/j.cclet.2025.112036
H. Zhu, X. Peng, Y. Liu, et al., Adv. Funct. Mater. 35 (2025) 2420553. doi: 10.1002/adfm.202420553
X. Wu, J. Liang, J. Shu, et al., J. Am. Chem. Soc. 147 (2025) 15329–15343. doi: 10.1021/jacs.5c00843
A. Lequeux, M.Z. Noman, M. Xiao, et al., Oncogene 40 (2021) 4725–4735. doi: 10.1038/s41388-021-01846-x
E. Lanitis, M. Irving, G. Coukos, Nat. Rev. Immunol. (2025) 831–846. doi: 10.1038/s41577-025-01187-w
J. Wu, X. Xue, H. Qu, Nano Transmed 4 (2025) 100092. doi: 10.1016/j.ntm.2025.100092
J. Zhu, H. Cai, C. Xu, et al., Small 19 (2023) e2304058. doi: 10.1002/smll.202304058
A. Sattiraju, S. Kang, B. Giotti, et al., Immunity 56 (2023) 1825–1843. doi: 10.1016/j.immuni.2023.06.017
A.M. Chalepaki, M. Gkoris, I. Chondrou, et al., Comput. Biol. Med. 189 (2025) 110021. doi: 10.1016/j.compbiomed.2025.110021
S. Tan, J. Hao, J. Ge, et al., J. Exp. Med. 222 (2025) e20240445. doi: 10.1084/jem.20240445
M.W. Murrey, I.T. Ng, F.J. Pixley, Front. Immunol. 15 (2024) 1480084. doi: 10.3389/fimmu.2024.1480084
G. Zhong, Y. Miao, J. Zhou, et al., Bioact. Mater. 52 (2025) 182–199.
T. Hu, C. Shen, X. Wang, et al., Chin. Chem. Lett. 35 (2024) 109562. doi: 10.1016/j.cclet.2024.109562
Y. Xing, Y. Zhou, R. Wang, et al., Dev. Cell 61 (2026) 1–16. doi: 10.1109/tgrs.2025.3647015
J. Lan, R. Zeng, Z. Li, et al., Adv. Mater. 36 (2024) e2408511. doi: 10.1002/adma.202408511
B. Chen, R. Huang, W. Zeng, et al., Biomaterials 305 (2024) 122434. doi: 10.1016/j.biomaterials.2023.122434
Q. Chen, Y. Li, J. Hu, et al., Adv. Sci. 12 (2025) e2406328. doi: 10.1002/advs.202406328
Q. Li, S. Wu, B. Li, et al., Small 20 (2024) e2405321. doi: 10.1002/smll.202405321
M. Sanlorenzo, P. Novoszel, I. Vujic, et al., Nat. Cancer 6 (2025) 175–193. doi: 10.1038/s43018-024-00889-9
N. Wang, Y. Zuo, S. Wu, et al., Acta Pharm. Sin. B 12 (2022) 4486–4500. doi: 10.1016/j.apsb.2022.05.032
X. Yang, C. Huang, H. Wang, et al., ACS Nano 18 (2024) 18604–18621. doi: 10.1021/acsnano.4c04766
Y. Hui, X. Jiao, L. Yang, et al., Acta Pharm. Sin. B 15 (2025) 3404–3418. doi: 10.1016/j.apsb.2025.04.022

Scheme 1 (a) The construction of multifunctional nanoadjuvant MICN@PI and (b) the mechanism of photothermal-immunotherapy for enhanced B16F10 tumor treatment.

Figure 1 Physicochemical characterization of multifunctional nanoadjuvants. Particle size distribution of (a) ICN, (b) MICN, (c) MICN@P, and (d) MICN@PI. TEM images of (e) ICN, (f) MICN, and (g) MICN@PI. (h) Photograph of ICN dissolving in 1 mol/L HCl producing CO2 bubbles. (i) Fluorescence absorption spectra of different formulations under 246 nm excitation. (j) UV–vis absorption spectra of different formulations. (k) IMQ and (l) IND release curves from MICN@PI at pH 5.4 and 6.5. Data are presented as mean ± standard deviation (SD) (n = 3).

Figure 2 In vitro photothermal studies and cytotoxicity assessment. (a) Temperature profiles of various formulations (ICN concentration 200 µg/mL, power density 2.5 W/cm2). Temperature profiles of MICN@PI at (b) different power densities and (c) different concentrations. (d) Thermal images of PBS, ICN, MICN, MICN@P, and MICN@PI under 808 nm laser irradiation at their maximum temperatures (ICN concentration 200 µg/mL, power density 2.5 W/cm2). Histograms showing the viability of (e) B16F10 cells and (f) DC2.4 cells after 24 h incubation with the formulations. (g) Live/dead staining images of B16F10 cells observed by confocal laser scanning microscopy after incubation with various formulations (ICN concentration 200 µg/mL, power density 2.5 W/cm2). Scale bar: 100 µm. Green: live cells; Red: dead cells.

Figure 3 Therapeutic effect against tumors. (a) Local tumor temperature elevation curves (n = 3) and (b) thermal images of mice after intratumoral injection of PBS, MICN, MICN@P, and MICN@PI followed by laser irradiation (808 nm, 0.3 W/cm2, 5 min). (c) Schematic diagram of the B16F10 tumor-bearing mouse model and the dosing schedule for assessing antitumor efficacy. Growth curves of (d) primary tumors and (e) distal tumors in different treatment groups (n = 5). (f) Survival curves and (g) body weight changes of mice in different treatment groups (n = 5). Data are presented as mean ± SD.

Figure 4 Induction of immune responses in TDLNs and distant tumors. (a) Representative flow cytometry histograms and (e) quantitative analysis of CD11c+CD40+ DCs in the TDLNs of treated mice (n = 3). (b) Flow cytometry dot plots and (f) quantitative analysis of CD3+CD4+ T cell infiltration in distant tumors (n = 3). (c) Flow cytometry dot plots and (g) quantitative analysis of CD3+CD8+ T cell infiltration in distant tumors (n = 3). (d) Representative flow cytometry dot plots and (h) quantitative analysis of NK cells in distant tumors (n = 3). Data are presented as mean ± SD.

 扫一扫看文章

扫一扫关注我们
 DownLoad:
 下载:
下载:
 下载:
下载: