Synergistic disinfection by microwave electrodeless ultraviolet light and in situ generated O3: Characteristics of bacterial inactivation, reactivation and disinfection mechanism
Citation:
Jun-Jie Wang, Jue-Lin Xiang, Hai-Sheng Du, Jian Zhao, Li Li, Ming-Qi Ye, Ye Du. Synergistic disinfection by microwave electrodeless ultraviolet light and in situ generated O3: Characteristics of bacterial inactivation, reactivation and disinfection mechanism[J]. Chinese Chemical Letters,
2026, 37(6): 111984.
doi:
10.1016/j.cclet.2025.111984
Synergistic disinfection by microwave electrodeless ultraviolet light and in situ generated O3: Characteristics of bacterial inactivation, reactivation and disinfection mechanism
English
Synergistic disinfection by microwave electrodeless ultraviolet light and in situ generated O3: Characteristics of bacterial inactivation, reactivation and disinfection mechanism
Received Date:
12 June 2025 Accepted Date:
17 October 2025 Revised Date:
02 September 2025 Available Online:
15 June 2026
Abstract:
Ultraviolet (UV) disinfection has some disadvantages such as unstable disinfection effect and bacterial revival. The UV/ozone (O3) co-disinfection process can be capable of solving the above-mentioned problems, but the current technology has the disadvantages of high costs and high operational risk. In this study, a new type of simultaneous O3-producing microwave electrodeless UV lamp (O3−MWUVL) was developed. The device can emit 254 nm and 185 nm UV, which can produce O3 while disinfecting. The O3−MWUVL exhibited significant disinfecting effects against Escherichia coli (E. coli) and Bacillus subtilis (B. subtilis). The disinfection effect of MWUV/O3 was better than that of MWUV or O3. The inactivation rate of E. coli disinfected by MWUV/O3 can reach 3.44 log when the UV dose was 16 mJ/cm2, and the inactivation rate of B. subtilis disinfected by MWUV/O3 can reach 4.64 log when the UV dose was 30 mJ/cm2. At the same time, the MWUV/O3 treatment can effectively inhibit the photoreactivation of E. coli. The maximum photoreactivation rate of E. coli treated by MWUV/O3 was only 0.11%. Additionally, the disinfection efficacy of the O3−MWUVL on actual wastewater was investigated, revealing that O3 pretreatment enhanced the UV inactivation capacity significantly. Furthermore, it was found that sequential disinfection using O3−MWUV or MWUV/O3 synergistic approach yielded superior results compared to MWUV-O3 sequential disinfection. Finally, investigation into the disinfection mechanism in the MWUV/O3 disinfection process substantiated the generation of hydroxyl radicals (•OH) within the system, while observations from scanning electron microscopy and laser confocal scanning microscopy also demonstrated that O3 plays an important role in dismantling cellular structures.
The issue of water scarcity has become increasingly critical in contemporary society [1]. Wastewater recycling is an important way to solve the problem of water shortage [2,3]. However, the pathogenic microorganisms in wastewater are very likely to pose a threat to public health [4]. Strict disinfection is the key to ensure the safety of reclaimed water quality and protect human life and health [5].
Ultraviolet (UV) disinfection is widely used in wastewater treatment due to its lack of disinfection byproducts, lower operational risks, and broad-spectrum bactericidal efficacy [6,7]. However, conventional UV disinfection systems typically utilize low-pressure mercury lamp (LPUV), which depend on electrode excitation and are characterized by a short service life and low photoelectric conversion rate [8,9]. In addition, the single UV disinfection has high requirements on the influent water quality, and the high turbidity of the influent will seriously affect the UV disinfection effect. It has been reported that when effluent turbidity increased from 0.74 NTU to 207 NTU, UV penetration decreased from 97% to 20% [10]. Additionally, the presence of substances in wastewater that can absorb UV, such as humic acid and microplastics, further reduces the intensity of UV reaching microbial surfaces, thereby adversely affecting microbial inactivation rates [11–13]. Moreover, bacteria inactivated by UV will reactivate under light conditions which called photoreactivation. Photoreactivation is the process in which photolyase utilizes the energy of photons to repair pyrimidine dimers or pyrimidine-pyrimidone 6–4 photoproducts back to pyrimidine monomers [14,15]. It has been reported that Escherichia. coli (E. coli) can reach a maximum revival rate of 12.7% under light conditions after UV disinfection (UV intensity: 0.4 mW/cm2, UV dose: 20 mJ/cm2, visible light intensity: 1600 Lux) [16].
In order to solve the shortcomings of single UV disinfection method, it has been proposed that the combination of UV with other disinfection method can have a synergistic effect in the disinfection process [17–21]. Disinfection processes such as UV/ozone (O3) disinfection have been proposed. It is reported the disinfection effect of UV/O3 was better than that of UV/chlorine, UV/hydrogen peroxide (H2O2) and UV/persulfate (PS) [10,22]. In addition, O3 can also reduce the turbidity and color of the wastewater [23,24], which is conducive to increasing the UV penetration rate and enhancing the disinfection effect. As a powerful oxidant with an oxidation–reduction potential of 2.07 V, O3 degrades organic pollutants (the main substances causing color) or particles (the main substances causing turbidity) through two mechanisms: (1) Direct electrophilic attack by molecular O3; (2) indirect attack by hydroxyl radical (•OH) produced through the O3 decomposition process [25–27]. UV/O3 disinfection can generate •OH, which can destroy the cell membrane structure and effectively inhibit bacterial resurrection [28,29]. Current research on UV/O3 disinfection mainly uses LPUV, additional O3 generator and oxygen storage tank [24,30]. Although this way can achieve good disinfection effect but the cost of disinfection is greatly increased, and the operational risk is high.
A microwave discharged electrodeless ultraviolet lamp (MDEL) has attracted the attention of many scholars [16,31]. It is based on the microwave excitation of the filling gas in the electrodeless lamp and then emits UV light. This type of light source does not require electrode excitation, thus avoiding the problem of electrode aging. It has the advantages of long lifetime and stable light emission [31]. In one study, MDEL was combined with a low O3 concentration (0.4 mg/L) for disinfection, and it was found to be effective inactivating E. coli and Bacillus subtilis (B. subtilis) [32]. However, an additional O3 generator and an O2 tank were used in this study, which could increase the cost and operational risks.
To solve the problem of high cost and significant operational risks in the current UV/O3 disinfection technology, we propose a new type of simultaneous O3-producing microwave electrodeless UV lamp (O3−MWUVL). The UV emitted by the O3−MWUVL was denoted as MWUV. Dual-wavelength electrodeless lamps are applied in the O3−MWUVL, which can radiate UV at 254 nm and 185 nm simultaneously. The 254 nm UV has good disinfection effect; the 185 nm UV wavelength is vacuum UV, which can quickly decompose oxygen to generate O3 when it comes into contact with the air [1,33]. Then the O3 is collected and injected into the wastewater. No additional O3 generators and other equipment are required for the UV/O3 disinfection.
To support the practical application of the O3−MWUVL, this study investigated the disinfection characteristics of the O3−MWUVL for pathogenic microorganisms and the level of photoreactivation after disinfection by O3−MWUVL. The performance of the O3−MWUVL equipment on pathogenic microorganisms in actual wastewater under different O3 injection sequences was also investigated. In addition, the bactericidal mechanism of MWUV/O3 synergistic disinfection was investigated. Experiment details were listed in Texts S1-S9 (Supporting information).
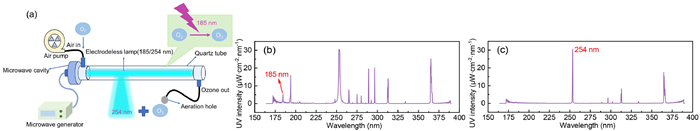
The O3−MWUVL equipment consisted of a microwave generator, a microwave cavity, an air pump, a dual wavelength electrodeless lamp, a quartz tube and an aeration hole, as shown Fig. 1a. The microwave was transmitted into the microwave cavity by the microwave generator and then excited the dual-wavelength electrodeless lamp, which emitted UV at 254 nm and 185 nm. The quartz tube on the outside of the dual-wavelength electrodeless lamp can expose the 254 nm UV but can shield the 185 nm UV, limiting the 185 nm UV to the cavity between the quartz tube and the lamp. By pumping air into the cavity, 185 nm UV converted oxygen in the air into O3 [1], which was then introduced into the disinfection water sample through the outlet aerator head.
Figure 1
Figure 1.
Schematic and spectral diagram of the O3−MWUVL: (a) Schematic diagram of the O3−MWUVL, (b) spectrogram of the bare dual-wavelength electrodeless lamp, (c) spectrogram of the dual-wavelength electrodeless lamp with an external quartz tube.
Emission spectra of the O3−MWUVL were shown in Figs. 1b and c. In the absence of an external quartz sleeve, the spectrum of the dual-wavelength electrodeless lamp was measured (Fig. 1b), and UV at 185 nm wavelength was detected. Because 185 nm UV will react with oxygen in the air and cause its decay faster [1], the detection peak was low. Compared with the spectrum measured under the condition of the lamp with an external quartz tube (Fig. 1c), there were many hybrid peaks (such as 193 nm, 275 nm and 333 nm) in the spectrum of the dual-wavelength electroless lamp without an external quartz tube, which may be due to the fact that the external quartz tube can effectively filter some UV wavelengths. Fig. 1c showed that the O3−MWUV can transmit 254 nm UV but no 185 nm UV when surrounded by quartz tube. The 185 nm UV was shielded by the quartz tube. Some special quartz materials can effectively eliminate 185 nm UV such as quartz doped with titanium dioxide [1].
The disinfection characteristics of E. coli and B. subtilis under different MWUV intensity were detected, and the results were shown in Fig. 2. The inactivation rate constant fitting curves was shown in Fig. S3 (Supporting information).
Figure 2
Figure 2.
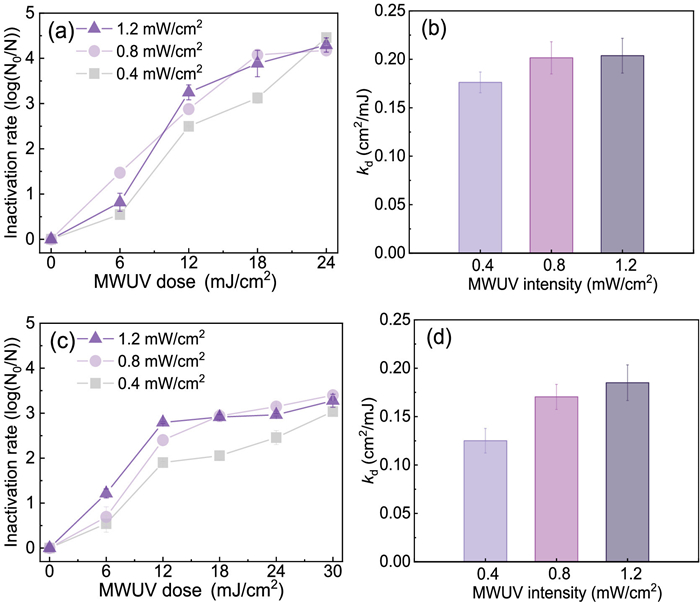
Disinfection characteristics of bacteria by MWUV: (a) The disinfection characteristic curve of E. coli, (b) comparison of inactivation rate constants of E. coli, (c) the disinfection characteristic curve of B. subtilis, (d) comparison of inactivation rate constants of B. subtilis.
Fig. 2a showed that the inactivation rate of E. coli increased with the increase of UV dose. At 1.2 mW/cm2, the inactivation rate of E. coli increased from 0.82 log to 4.30 log with the MWUV dose from 6 mJ/cm2 to 24 mJ/cm2. The UV resistance of E. coli can be expressed by the inactivation rate constant (kd), with a higher kd value indicating a higher sensitivity of E. coli [6]. The Fig. 2b showed that the kd of 1.2 mW/cm2 and 1.0 mW/cm2 were 0.203 cm2/mJ and 0.202 cm2/mJ respectively, which was higher than 0.176 cm2/mJ at 0.8 mW/cm2. This suggested that higher MWUV intensity may lead to faster inactivation effect. A higher UV intensity could cause more DNA damages and make repair enzymes more severely impaired [34].
The disinfection characteristics of B. subtilis were measured, and the results were shown in Figs. 2c and d. In Fig. 2c, after the MWUV dose reached 18 mJ/cm2, a "trailing" effect was observed in B. subtilis. The trailing effect also was found in some previous studies [35,36]. This phenomenon may be attributed to the existence of resistant sub-populations, the ability of bacteria to repair and be reactivated, the presence of particles, or bacterial aggregation [7,36–38]. The inactivation rate of B. subtilis was similar to E. coli. When the MWUV intensity was 1.2 mW/cm2, the inactivation rate of B. subtilis increased from 1.21 log to 3.28 log with the MWUV dose from 6 mJ/cm2 to 30 mJ/cm2. According to the fitted inactivation rate constant (Fig. 2d), the kd of 1.2 mW/cm2 and 0.8 mW/cm2 were similar, being 0.185 cm2/mJ and 0.170 cm2/mJ, respectively. These results were consistent with most previous research results of UV disinfection [16,32].
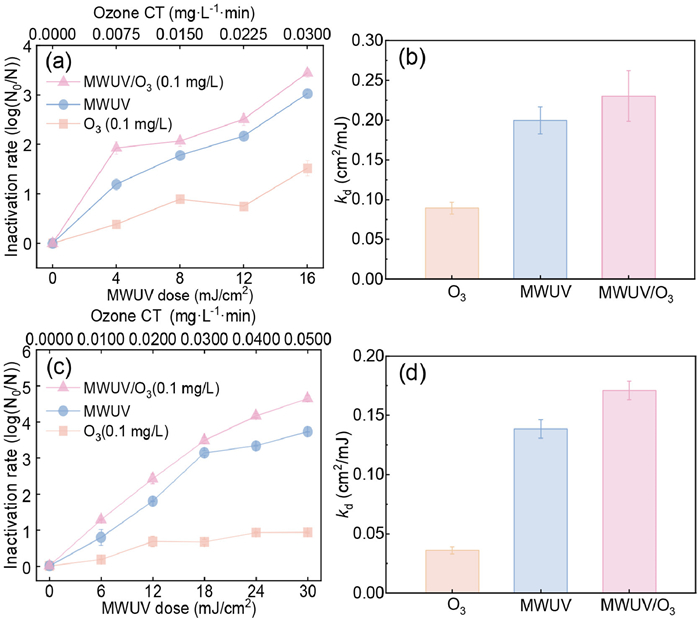
The MWUV/O3 disinfection experiment of the O3−MWUVL was carried out with a MWUV intensity of 1.0 mW/cm2 and an O3 concentration of 0.1 mg/L. The inactivation rate constant fitting curves was shown in Fig. S4 (Supporting information). The results of disinfection characteristics of E. coli by MWUV, O3 and MWUV/O3 were shown in Figs. 3a and b. The inactivation effect of O3 alone (0.1 mg/L) on E. coli was poor, and the inactivation rate was only 1.52 log when the O3 CT value was 0.03 mg L-1 min. The reason may be the ultra-low concentration of O3 we used. O3 disinfection experiments by additional O3 generator have used concentrations ranging from 1 mg/L to 4 mg/L [39,40]. The disinfection effect of MWUV and MWUV/O3 was significantly higher than that of O3 alone. The inactivation rate increased with the increase of UV dose. The inactivation rates of E. coli treated by MWUV and MWUV/O3 reached 3.03 log and 3.44 log respectively when the UV dose was 16 mJ/cm2. As can be seen from the inactivation rate constants obtained by fitting the kinetic model (Fig. 3b), the inactivation rate constants of MWUV/O3 and MWUV were 0.230 cm2/mJ and 0.200 cm2/mJ respectively, which also indicated that the presence of O3 made E. coli more sensitive to UV and easier to be inactivated. The possible reason was that when the E. coli treated by MWUV/O3, the O3 itself or the generated •OH first damage the cell membrane of E. coli [41–43], coupled with the damage of UV to DNA, so that E. coli was more thoroughly inactivated.
Figure 3
Figure 3.
Comparison of the disinfection characteristics of bacteria by MWUV/O3, MWUV and O3: (a) The disinfection characteristic curve of E. coli, (b) comparison of inactivation rate constants of E. coli, (c) the disinfection characteristic curve of B. subtilis, (d) comparison of inactivation rate constants of B. subtilis.
Figs. 3c and d showed the disinfection characteristics of B. subtilis by MWUV, O3 and MWUV/O3. O3 alone had poor inactivation effect on B. subtilis, and the inactivation rate was only 0.93 log when the CT value was 0.05 mg L-1 min. The inactivation rate of MWUV/O3 was significantly higher than that of MWUV alone, and the inactivation rate reached 4.64 log and 3.72 log, respectively, when the UV dose was 30 mJ/cm2. No significant "trailing" effect was observed. The kd of MWUV/O3 was 0.171 cm2/mJ, which was higher than that of 0.139 cm2/mJ for MWUV (Fig. 3d). In general, the kd of B. subtilis was lower than that of E. coli, which suggested that B. subtilis was more tolerant to MWUV and O3. This may be attributed to the presence of a thicker peptidoglycan layer in gram-positive bacteria than in gram negative bacteria [17,44,45].
One of the disadvantages of UV disinfection is the bacterial reactivation including photoreactivation and dark repair. In this study, dark repair was not considered because it was found in previous studies that the maximum dark repair rate in bacteria was very low (< 0.05%) [16]. On the contrary, the phenomenon of photoreactivation of bacteria was much more obvious than dark repair. It is reported that the percentage of photoreactivation and maximum survival rate for E. coli were 75.2% and 21.4% for UV disinfection (inactivated to 3.00 log by LPUV, UV intensity was 8.5 mW/cm2) [15]. Therefore, photoreactivation was considered to be one of the serious disadvantages of UV disinfection. This experiment explored the photoreactivation of E. coli and B. subtilis after disinfection by the O3−MWUVL, as shown in Fig. 4.
Figure 4
Figure 4.
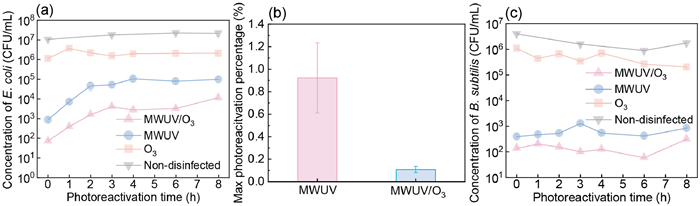
Inhibition characteristics of photoreactivation of bacteria by the O3−MWUVL: (a) Photoreactivation curve of E. coli, (b) maximum photoreactivation percentage of E. coli, (c) photoreactivation curve of B. subtilis.
Figs. 4a and b respectively showed the photoreactivation curves and maximum photoreactivation percentage of E. coli. The disinfection effect of O3 alone was low, and the photoreactivation of O3 was not significant. However, both the MWUV and MWUV/O3 treatment groups exhibited rapid bacterial reactivation within the first 2 h. The concentration of E. coli in the MWUV group increased from approximately 8.6 × 10² CFU/mL to 9.9 × 10⁴ CFU/mL, while the MWUV/O3 group showed an increase from 8.2 × 101 CFU/mL to 1.1 × 10⁴ CFU/mL. The addition of O3 treatment leaded to nearly a one-order-of-magnitude difference in the initial E. coli concentrations. After MWUV/O3 treatment and MWUV treatment, the maximum photoreactivation rates of E. coli was 0.11% and 0.92%, respectively, indicating the high efficiency of the combined action of MWUV and O3 in inhibiting the photoreactivation ability of E. coli. The photoreactivation level of the MWUV/O3 group was lower than that of the MWUV group. This phenomenon may be attributed to the lower initial concentration of E. coli after the addition of O3 treatment. However, the results of subsequent inactivation mechanism studies showed that the cell membranes of E. coli in the MWUV/O3 group were completely ruptured. The damage of the cell membrane can lead to the inactivation of intracellular enzymes, preventing photoreactivation [10]. This indicated that MWUV/O3 can effectively inhibit the photoreactivation of bacteria. These results align with previous findings in O3 disinfection studies, indicating that the synergistic use of O3 can control bacterial reactivation rates and suppress the photoreactivation effect [32,46]. The •OH generated by the combined action of UV and O3 possess potent oxidizing ability, which efficiently degrade the cell membrane. Although no other cellular structures were investigated for damage in this study, previous studies have demonstrated that O3 can damage proteins, intracellular enzymes, and other components within cells [47–49]. These injuries can prevent the recovery of bacterial viability.
The photoreactivation curve of B. subtilis was shown in Fig. 4c. It can be seen from the figure that the concentration of B. subtilis after inactivation changes slightly under light condition. No significant photoreactivation in B. subtilis was observed. In previous studies, there was also no significant photoreactivation in B. subtilis [50,51].
Actual wastewater exhibits complex compositions containing high levels of organic and inorganic substances that absorb UV irradiation or deplete O3, thereby compromising disinfection efficacy [22,52,53]. To evaluate the performance of O3 in complex disinfection scenarios, disinfection experiments under varied O3 application sequences were conducted on actual wastewater samples. The results, summarized in Fig. S5a (Supporting information), demonstrated that sequential O3−MWUV disinfection and combined MWUV/O3 processes achieved superior fecal coliform removal compared to the MWUV-O3 sequence. This enhanced performance suggested that O3 pretreatment amplifies the bactericidal effect of subsequent UV irradiation. Mechanistically, the O3 pretreatment step effectively reduced wastewater turbidity and chromaticity, improving UV transmittance [54]. Furthermore, the synergistic MWUV/O3 process likely enhanced disinfection efficiency through the generation of highly reactive •OH [55], which exhibit potent oxidative activity against fecal coliforms.
To elucidate the mechanistic roles of O3 in sequential O3−MWUV, MWUV-O3, and combined MWUV/O3 disinfection processes, O3 was introduced individually into real wastewater, with timed sampling and analysis conducted within 60 s. The measured turbidity and UV transmittance (UVT) data of the wastewater are presented in Fig. S5b (Supporting information). Turbidity primarily reflects the impact of non-dissolved substances on UV disinfection efficacy, where higher turbidity correlates with reduced microbial inactivation by UV irradiation [10]. Elevated turbidity induces refraction and scattering of UV light, diminishing the effective irradiance reaching microbial surfaces and thereby compromising disinfection performance [56]. UVT, a critical indicator of UV penetration capacity in water, integrates the effects of turbidity, chromaticity, particulate matter, metal ions, and organic compounds, serving as the most direct determinant of UV disinfection efficiency.
During O3 application, the turbidity decreased from 0.11 NTU to 0.02 NTU, while UVT increased from 80% to 83%. The increase in UVT was not significant. The reason might be that there were other O3-depleting substances in the actual wastewater, and the O3 concentration used in this experiment was relatively low. Mechanistically, O3 interacts with aromatic compounds and humic substances in water, oxidizing chromophores to reduce turbidity [57,58]. Concurrently, O3 facilitates the conversion of high-molecular-weight organic compounds into low-molecular-weight aliphatic derivatives, mitigating their UV absorption and further enhancing UVT [59]. These findings collectively demonstrate that O3 optimizes water quality by reducing turbidity, providing a rational basis for the superior efficiency of sequential O3−MWUV over MWUV-O3 processes.
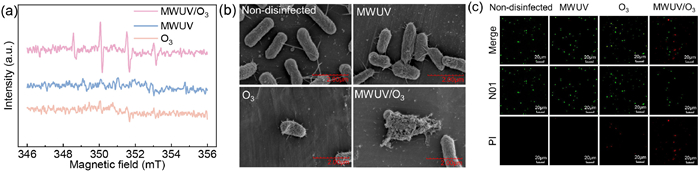
The generation of •OH was investigated by electron paramagnetic resonance (EPR) experiments using 5, 5-dimethyl-1-pyrroline N-oxide (DMPO) as a spin-trapping agent. EPR spectra obtained from the experiments are illustrated in Fig. 5a. The characteristic EPR signature of •OH exhibits a quartet pattern with an intensity ratio of 1:2:2:1. The signal amplitude, corresponding to the magnitude of DMPO—OH adduct peaks in the EPR spectra, reflects the quantity of •OH generated [60,61]. During the MWUV/O3 treatment, distinct characteristic signals were observed, confirming the formation of •OH. In contrast, neither individual MWUV nor O3 treatment displayed discernible characteristic signals, indicating negligible or undetectable •OH production. Although previous studies have reported •OH generation during ozonation processes [62], no significant •OH signals were detected in this study. The reason may be the ultra-low O3 concentration (0.1 mg/L) employed. The concentration of generated •OH was relatively low and difficult to be detected.
Figure 5
Figure 5.
Mechanism of bacterial damage during MWUV/O3 co-disinfection: (a) The signal strength of the DMPO—OH adduct was analyzed by EPR (DMPO—OH: 10 mmol/L), (b) scanning electron microscope (SEM) images of E. coli morphology during MWUV/O3 co-disinfection, (c) bacterial fluorescence staining for MWUV/O3 co-disinfection under laser confocal scanning microscopy.
•OH, as a significantly stronger oxidant than O3, markedly accelerate bacterial inactivation. The concurrent application of UV irradiation and ozonation not only induced DNA damage but also disrupted cell membrane, which may explain the suppressed bacterial reactivation observed after MWUV/O3 treatment [63]. The combined MWUV/O3 process accelerates membrane integrity disruption, thereby enhancing inactivation efficiency.
To validate this hypothesis, morphological changes in E. coli under different disinfection conditions were evaluated using SEM. Representative micrographs were shown in Fig. 5b. Untreated E. coli cells exhibited a short rod-shaped morphology with smooth surfaces and intact cell membranes. MWUV irradiation alone caused no discernible cellular damage. In contrast, ozonation induced morphological alterations, including cell deformation and shrinkage. Following MWUV/O3 treatment, severe structural damage was observed, characterized by ruptured cell walls and membranes, accompanied by cytoplasmic leakage. These phenomena likely result from reactive oxygen species (ROS)-mediated attacks on cell membranes, triggering cascading oxidative reactions that culminate in cell death [10]. These findings align with disinfection experimental results, wherein O3 pretreatment disrupts bacterial cell integrity, facilitating UV-induced DNA damage. Concurrently, compromised membranes enhance the penetration of •OH into intracellular compartments, amplifying disinfection efficacy.
Bacterial membrane integrity post-disinfection was assessed using live/dead BBcell-Probe N01/PI bacterial viability kits. Stained samples were observed via laser confocal scanning microscopy (LCSM), where intact membranes were labeled with N01 (green fluorescence), and compromised membranes were permeabilized by propidium iodide (PI, red fluorescence). As shown in Fig. 5c, the staining results aligned with scanning electron microscopy (SEM) observations. E. coli disinfected by MWUV alone displayed predominantly green fluorescence, indicating bacterial membrane integrity. In contrast, ozonation alone induced partial membrane rupture, evidenced by red fluorescence in a subset of cells. The MWUV/O3 disinfection caused extensive membrane disruption, with a majority of cells exhibiting red fluorescence. Membrane integrity is critical for bacterial viability and metabolic activity, and the change of cell structure is an important cause of bacterial inactivation [64,65]. These findings underscore the pivotal role of O3 in disrupting bacterial membranes, while UV irradiation exacerbates structural damage. This synergy may arise from enhanced •OH generation during MWUV/O3 treatment. Notably, membrane rupture-induced cell death is irreversible [66], consistent with photoreactivation, which revealed significantly lower photoreactivation percentage for MWUV/O3 treated E. coli compared to MWUV alone.
This study investigated the disinfection characteristics and disinfection mechanism of the O3−MWUVL. The device uses the synergistic effect of UV and O3 to enhance the disinfection effect. The main conclusions are as follows:
(1) The O3−MWUVL has a good disinfection effect. For MWUV disinfection alone, the inactivation rate of E. coli can be up to 4.30 log at 1.2 mW/cm2 and 24 mJ/cm2. Among the MWUV, O3, and MWUV/O3, the disinfection efficacy of MWUV/O3 is the most superior. For MWUV/O3 disinfection, the inactivation rate of E. coli can achieve 3.44 log at 1.0 mW/cm2, 16 mJ/cm2 and the O3 CT value of 0.03 mg L-1 min; the inactivation rate of B. subtilis can achieve 4.64 log at 1.0 mW/cm2, 30 mJ/cm2 and the O3 CT value of 0.05 mg L-1 min.
(2) The O3−MWUVL can effectively inhibit the photoreactivation of bacteria. Among the MWUV, O3, and MWUV/O3, MWUV/O3 has the best photoreactivation inhibition effect on E. coli, and the maximum photoreactivation percentage was only 0.11%.
(3) In the actual wastewater disinfection experiment, different O3 dosing sequence will affect the disinfection effect. The disinfection effect of the sequence of O3−MWUV and MWUV/O3 were superior to that of MWUV-O3.
(4) The formation of •OH in the MWUV/O3 synergistic system can accelerate the deactivation of bacteria. The low concentration O3 played a key role in bacterial cell damage, directly destroyed the cell membrane of bacteria, while promoting the entry of •OH into cells and enhancing the disinfection ability of MWUV.
Declaration of competing interest
The authors declare that they have no known competing financial interests or personal relationships that could have appeared to influence the work reported in this paper.
CRediT authorship contribution statement
Jun-Jie Wang: Writing – original draft, Visualization, Software, Data curation. Jue-Lin Xiang: Writing – original draft, Visualization, Software, Data curation. Hai-Sheng Du: Resources. Jian Zhao: Resources. Li Li: Resources. Ming-Qi Ye: Supervision, Resources. Ye Du: Writing – review & editing, Supervision, Resources, Methodology, Conceptualization.
Acknowledgments
This work was supported by National Natural Science Foundation of China (No. 52570044/52170044), Technology Innovation Research and Development Project of Chengdu Science and Technology Bureau (No. 2024-YF05–02626-SN), and Science and Technology Innovation Improvement Project of Sichuan University (No. 2024SCUQJTX019), and Sichuan University Postdoctoral Interdisciplinary Innovation Fund.
Supplementary materials
Supplementary material associated with this article can be found, in the online version, at doi:10.1016/j.cclet.2025.111984.
Z Yan, J. Liu, B. Zeng, Continuous disinfection and sterilization system based on ultra-strong ultraviolet electrodeless lamp, in: 2023 24th International Vacuum Electronics Conference (IVEC), Chengdu, 2023, pp. 1–2.
X. Zhai, Q. Wang, J. Ma, et al., Detection of hydroxyl radicals in catalytic ozonation by using ESR spectroscopy, in: 2009 International Conference on Environmental Science and Information Application Technology, Vol. 3, Wuhan, IEEE, 2009, pp. 358–361.
[62]
N. Hamdi El Najjar, A. Touffet, M. Deborde, et al., Sep. Purif. Technol. 136 (2014) 137–143. doi: 10.1016/j.seppur.2014.09.004
[63]
D. Wu, G. Lu, R. Zhang, et al., Water Sci. Technol. 16 (2016) 163–170.
[64]
M.K. Ramseier, U. von Gunten, P. Freihofer, et al., Water Res. 45 (2011) 1490–1500. doi: 10.1016/j.watres.2010.11.016
Y. Zhang, X. Chen, C. Gueydan, et al., Cell Res. 28 (2018) 9–21. doi: 10.1038/cr.2017.133
Figure 1
Schematic and spectral diagram of the O3−MWUVL: (a) Schematic diagram of the O3−MWUVL, (b) spectrogram of the bare dual-wavelength electrodeless lamp, (c) spectrogram of the dual-wavelength electrodeless lamp with an external quartz tube.
Figure 2
Disinfection characteristics of bacteria by MWUV: (a) The disinfection characteristic curve of E. coli, (b) comparison of inactivation rate constants of E. coli, (c) the disinfection characteristic curve of B. subtilis, (d) comparison of inactivation rate constants of B. subtilis.
Figure 3
Comparison of the disinfection characteristics of bacteria by MWUV/O3, MWUV and O3: (a) The disinfection characteristic curve of E. coli, (b) comparison of inactivation rate constants of E. coli, (c) the disinfection characteristic curve of B. subtilis, (d) comparison of inactivation rate constants of B. subtilis.
Figure 4
Inhibition characteristics of photoreactivation of bacteria by the O3−MWUVL: (a) Photoreactivation curve of E. coli, (b) maximum photoreactivation percentage of E. coli, (c) photoreactivation curve of B. subtilis.
Figure 5
Mechanism of bacterial damage during MWUV/O3 co-disinfection: (a) The signal strength of the DMPO—OH adduct was analyzed by EPR (DMPO—OH: 10 mmol/L), (b) scanning electron microscope (SEM) images of E. coli morphology during MWUV/O3 co-disinfection, (c) bacterial fluorescence staining for MWUV/O3 co-disinfection under laser confocal scanning microscopy.

 DownLoad:

 下载:
下载:


 下载:
下载:
