Figure 1.
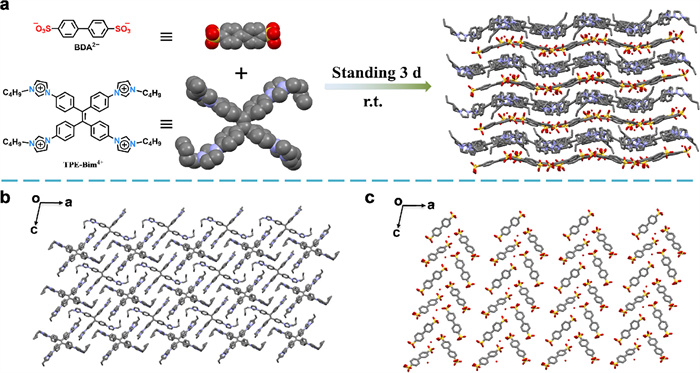
(a) Schematic of the synthesis of IOC by TPE-based TPE-Bim-Br4 and BDA. (b) The cationic layer formed by TPE-Bim4+. (c) The anionic layer formed by DBA2-.
Photochromic ionic self-assembled ionic-bonded organic crystals: Blue-shifted and enhanced luminescence
Juanjuan Wang , Yangxia Han , Qixia Guan , Jia Chen , Hongdeng Qiu

Photochromic materials exhibit remarkable emission color changes and visible color changes discernible to the naked eye in response to light [1–4], which have drawn wide range of attentions due to their applications in solar ultraviolet sensing, information storage, energy conversion, and ink-free printing [5–8]. Among these photochromic materials, most photochromic materials exhibit red-shifted and quenched emission as the light time increases [9–11]. In contrast, the blue shift and enhanced intensity of the photoluminescent (PL) spectra in response to extended UV-exposure time are seldom observed in luminescent materials. In particular, the remarkable enhancement of emission properties is predominantly observed in metal complexes [12,13], whereas it has not been documented in purely organic compounds.
On the other hand, organic building blocks play an important role in the properties of multifunctional materials, these building blocks not only serve as the foundation for constructing crystals [14], but also provide diverse properties, including optical properties [15,16]. Tetraphenylethene (TPE), a unique aggregation-induced emission (AIE) [17,18], exhibits a unique photochromic property [19–24], a series of the TPE-based materials exhibiting excellent photo response properties were obtained by modifying the structure of TPE molecules [2,25,26]. Moreover, planar TPE, which consists of four benzene rings, exhibits exceptionally high rigidity, which is advantageous for the preparation of optically active crystals [27,28].
Supramolecular chemistry has attracted considerable attention owing to their wide range of applications in preparing non-covalent bonding materials [29–33]. Compared with covalent bonding materials, supramolecular materials are the self-assembled aggregations of two or more organic building blocks that are held together with noncovalent interactions, such as hydrogen bonds, halogen bonds, ionic bonds, π-stacking, and van der Waals forces [34–36]. Ionic bonds, as a significant type of non-covalent interaction, is a crucial role in the assembly and construction supramolecular materials with interesting and tunable properties, they are so compact, and can be easily introduced into most molecules. However, ionic bonds are non-saturating and non-directional, therefore, they have much more limited in generating ordered supramolecular ionic organic molecules [37]. As far as we know, early works were mainly focused on synthesizing crystals of monovalent organic cations and anions [38–40]. Until recently, organic molecule-ionic solids have been reported by Wang's group, which formed from multiply changed organic cations and anions [41,42], and there is still a necessity to explore some special properties of ionic organic crystals. The reversibility and low energy nature of ionic bonds will enable ionic compounds to rapidly respond to external stimuli, such as pH, light and temperature, making them highly promising candidates as for constructing stimulus-responsive materials [43,44].
Hence, we designed and synthesized a new ionic-bonded organic crystal (IOC, Fig. 1a) using TPE-based tetraimidazolium multidentate salts (TPE-Bim-Br4) and 4,4′-biphenyldisulfonic acid (BDA) as organic building blocks via ionic self-assembly. Impressively, this IOC displayed a robust response to UV light in dilute solutions, characterized by photoinduced blue-shift and enhanced emission.
To achieve IOC, TPE-Bim-Br4 and BDA were selected as building blocks. BDA (0.04 mmol) and TPE-Bim-Br4 (0.02 mmol) were dissolved completely in 1 mL of methanol and 1 mL of H2O, respectively. The methanol solution was then slowly added to the aqueous solution, and the resulting mixture was allowed to stand at ambient temperature. The single crystal of IOC slowly crystallized out at ambient temperature for over a period of 3 days (Fig. 1a). Structural analysis by single crystal X-ray diffraction showed that the asymmetric unit is composed of two halves of TPE-Bim4+, one water molecule and two BDA2- (Fig. S1 in Supporting information), resulting in the monoclinic P21/c symmetry. The ionic crystal consists of TPE-Bim-Br4 and DBA molecules with a stoichiometric ratio of 1:2, ensuring electrical neutrality within the unit cell. TPE-Bim4+ and BDA2- form alternating layers of cations and anions, respectively (Figs. 1b and c). In a single crystal, it is observed that the molecular bonds appear disordered, which is attributed to bond vibrations. The lattice parameters were determined to be a = 22.3483 Å, b = 17.6377 Å, c = 19.2841 Å, and α = γ =90°, β = 101.3169° The crystal structure appears much more “crowded” as it adopts close packing (Fig. S2 in Supporting information), The water molecule forms a hydrogen bond with the oxygen atom of the nearby sulfonic acid group, and offset face-to-face π–π stacking interactions between aromatic rings and the imidazolium ring are observed in the structure (Fig. S3 in Supporting information). In addition, there are also hydrogen bonds between the oxygen atoms on sulfonic acids and the hydrogens atoms on imidazolium and benzene rings.
The morphology analysis by optical microscope displayed that IOC exhibits a blue polyhedral morphology (Fig. 2a). Under the microscope, parallelogram-shaped crystals with slightly greenish are observed, these crystals display a regular structure (Fig. S4 in Supporting information). Furthermore, the composition of IOC was characterized by 1H NMR spectroscopy. As illustrated in Fig. 2b, IOC is composed of BDA2- and TPE-Bim4+ in a molar ratio of 2:1. The crystallinity of IOC was studied through powder X-ray diffraction (PXRD) analysis. The PXRD pattern of IOC was in good agreement with the crystalline PXRD pattern (Fig. 2c), indicating that IOC possesses high crystallinity and phase purity. The presence of solvent within crystal pores or attached to crystal surfaces was evidenced by thermogravimetric analysis (TGA), where weight loss in IOC between temperatures ranging from 30 ℃ to 100 ℃ is attributable to the evaporation of solvents. Meanwhile, TGA analyses indicate that the IOC formed by ionic bonds has high thermal stability, with decomposition onset observed at temperatures up to 398 ℃ (Fig. 2d).
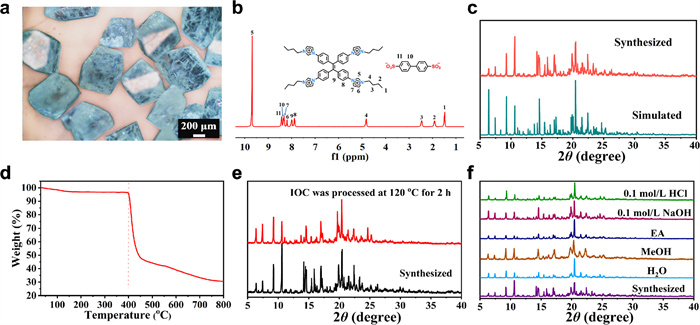
The Fourier transform infrared spectroscopy (FT-IR) analysis of IOC showed that the peaks at approximately 3400 cm-1 and near 3050 cm-1 are indicative of water molecules, and weak hydrogen bonds formed in IOC. Additionally, the peak around 1120 cm-1 corresponds to the asymmetric stretching vibration of the sulfonate anion, while the peaks in the range of 1075–1030 cm-1 are attributed to the symmetric stretching vibration of the sulfonic anion (Fig. S5 in Supporting information) [45]. The stability of IOC was investigated at high temperature by PXRD. The results indicated that IOC exhibits high stability at high temperatures (Fig. 2e). To investigate the stability of IOC in different solvents, samples were soaked in various organic solvents for 24 h and subsequently measured by PXRD (Fig. 2f), indicating that IOC remains stable in common solvents. These results suggested that hydrogen bonds with the crystal water likely stabilize the structure of IOC. The Brunauer-Emmett-Teller (BET) specific surface area of IOC, obtained from CO2 sorption analysis, revealed that a BET specific surface area of 7 m2/g (Fig. S6 in Supporting information), this result suggested an almost negligible specific surface area. This result aligns with the simulation of the single-crystal data, indicating that the internal pore is a sealed cavity (Fig. S7 in Supporting information). This prevents gas from entering the pore, consequently resulting in a low specific surface area. For comparative analysis with the theoretical surface areas, the Connolly surface area was calculated to be 386 m2/g (Fig. S8 and Table S2 in Supporting information), which is significantly higher than the experimental values. Despite IOC possessing a high Conolly surface area, the experimental surface area remains relatively low due to the lack of accessible pores for gas molecules.
As the TPE moiety exists in the IOC, its photoluminescence (PL) spectra were measured. It is well-established that solvent polarity and the local environment have a significant influence on the emission spectral properties of fluorophores [46]. So, the optical properties of IOC were investigated in various solvents. As shown in Figs. S9-S11 (Supporting information), the photo-physics in solution displayed irregular changes in different solvents, indicating that the fluorescence intensity is highly dependent on the nature of the organic solvent molecules. The peak shape and the intensity of the fluorescence emission spectra of IOC are optimal in methanol and water (2:3, v/v), indicating that IOC is best dispersed in these solvents. Unexpectedly, a photo-activated blue shift was observed in IOC when the excitation wavelength was changed (Fig. S12 in Supporting information). This phenomenon prompted us to investigate the photochromic properties of IOC, and the findings revealed that its photoluminescence (PL) exhibits distinct characteristics compared to those of the raw materials, which do not possess photochromism (Figs. S13 and S14 in Supporting information). Consequently, it is evident that IOC demonstrates a typical photo-activated blue shift [47–49]. In addition, we noticed a strong UV absorption peak at 270 nm. the emission wavelength when the excitation wavelength is 270 nm have been tested, which is located at 316 nm in the ultraviolet region, it is indeed different from the emission wavelength at 340 nm as the excitation wavelength, and the intensity is much stronger (Fig. S15 in Supporting information).
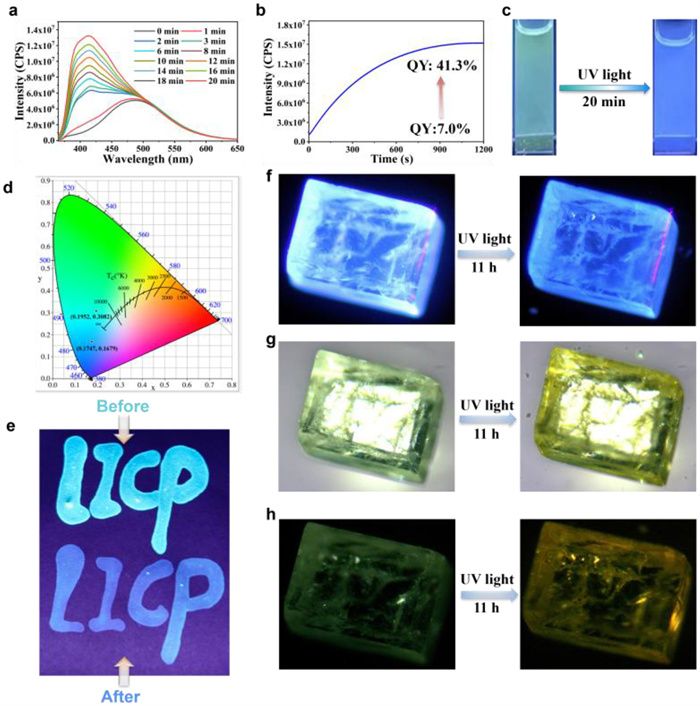
The photo-activated fluorescence enhancement and blue shift were observed at an excitation wavelength of 340 nm in the IOC solution, as shown in Fig. 3. Specifically, IOC demonstrated remarkable properties of blue shift and fluorescence enhancement. At an excitation wavelength of 340 nm, a new peak emerged at 415 nm, and the fluorescence intensity was more than twice that at 488 nm (Fig. 3a). Moreover, the corresponding fluorescence quantum yield (QY) was significantly enhanced with values increasing from 7.0% to 41.3% (Fig. 3b), resulting in a visible color change from green to blue under UV irradiation (Fig. 3c). In addition, we tested the changes in the emission wavelength of the IOC solution with an excitation wavelength of 270 nm after being exposed to UV light for different periods of time, the results showed that no blue or red shift occurred, but the strength was weakened (Fig. S16 in Supporting information). For IOC solids, the fluorescence QY and lifetime of the solid state were tested and the result reached 63% and 6.11 × 10⁻⁸ ns respectively (Fig. S17 in Supporting information). Notably, once the solution was exposed to UV light and subsequently to visible light for an extended period, the fluorescence did not revert to its original state (Fig. S18 in Supporting information), indicating that the photochromism exhibits irreversible behavior. Additionally, the chromaticity coordinates of IOC in the solution before and 20 min after exposure to UV light (Fig. 3d). The coordinates before and after irradiation are (0.1952, 0.3082) and (0.1747, 0.1679). Evidently, it exhibits a significant blue shift after exposure to UV light. When the IOC solution was used to write the words “LICP” on the filter paper, the writing initially appeared bright blue; however, after irradiation for 30 min, the writing appears dark blue (Fig. 3e). Based on this phenomenon, the IOC crystal was further tested. Upon irradiation for 11 h by a 10 W UV lamps at room temperature, under various lighting conditions, we captured images of the crystal both before and after UV light irradiation. The color changed from a bright green to dark blue under UV light (Fig. 3f). Under the incandescent light, the color changed from a pale green to a light yellow (Fig. 3g). When all the lights are turned off, the light green crystal visibly transition to a more pronounced yellow (Fig. 3h). When IOC powder is exposed to UV light, its color gradually changes from white to yellow over time. These color-changing behaviors not only demonstrates the unique response of IOC to UV light but also reveals its photosensitive properties. Specifically, as the irradiation time extends, the color change of the powder shows a clear gradual progression: initially remaining white, then slowly transitioning to light yellow, and finally becoming dark yellow (Fig. S19 in Supporting information).
To investigate the blue-shift and fluorescence enhancement mechanism of IOC, a series of control experiments were conducted. As shown in Fig. S20 (Supporting information) that there is no new absorption peak in the UV–vis absorption spectra. Furthermore, the hydrogen nuclear magnetic resonance (1H NMR) spectra, as well as PXRD patterns of IOC remained unchanged before and after 24 h of UV irradiation (Figs. S21 and S22 in Supporting information), indicating that UV irradiation did not alter the molecular structure of IOC.
On the other hand, there is charge transfer (CT) between an electron-rich group (sulfonate anion) and an electron-deficient group (imidazolium). X-ray photoelectron spectroscopy (XPS) was conducted to provide experimental evidence for this electron transfer process. As shown in Figs. 4a-d, before irradiation, the imidazolium cation exhibits a single N 1s core-level peak at 401.8 eV, including two peaks at 401.8 and 400.8 eV, which are attributed to C-N and C=N, while the oxygen atoms of the IOC exhibit strong peaks at 530.9 eV, which contains two peaks at 530.9 and 532.0 eV, these attributed to S-O and S=O. In the IOC, the sulfur atom in the IOC exhibits a pronounced peak at 167.4 eV, and two peaks at 167.4 and 168.6 eV, which are attributed to S-O and S=O. Following irradiation, the N 1s signal shifted to a lower binding energy (401.7 eV), and the peak of C=N shifts to 400.4 eV, whereas the O 1s and S 2p signals exhibited shifts to higher binding energies. More precisely, the O 1s signal shifted to 531.3 eV, the peak of C-O/C=O shifts to 531.4 and 532.7 eV, and the S 2p signal shifted to 167.6 eV, In addition, the characteristic peak of S-O/S=O shifts to 167.6 and 168.7 eV. This result proves that the electrons from the sulfonate are transferred to the nitrogen radical on the imidazole. The interactions in organic blocks and π-π stacking play a crucial role between electron donor and acceptor groups [50]. The weak interactions of ionic bonding and π–π stacking are well-organized in IOC. Furthermore, the continuous π–π stacking in the backbone may provide an electron transfer pathway. As is known, electron transfer can occur upon external light stimuli when the distance between donor and acceptor blocks is shorter than 3.7 Å in single-crystal data [51]. Notably, in the structure of IOC, the distance between the oxygen atom of the sulfonic acid and the nitrogen atom of the imidazole is shorter than the value of 3.7 Å (Figs. S23 and S24 in Supporting information), facilitating charge transfer (CT).
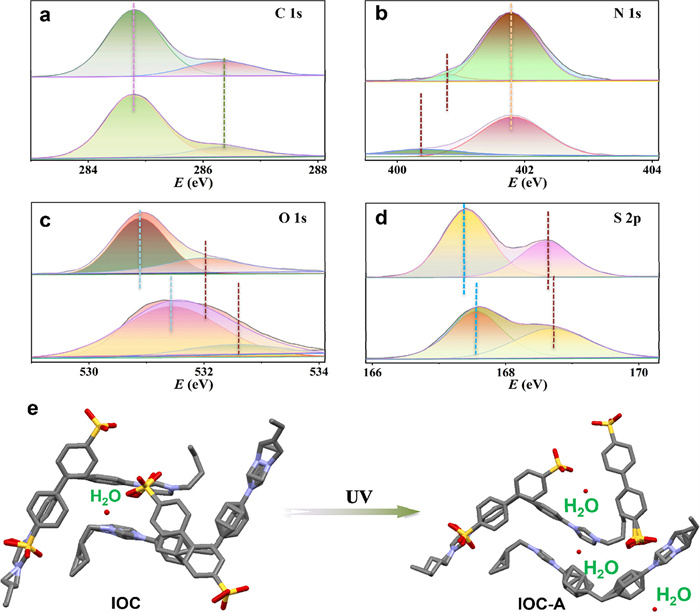
Generally speaking, the fluorescent intensity of materials is predominantly governed by non-radiative decay processes [52], a phenomenon frequently observed in carbon quantum dots [53]. The significant increase in the fluorescence emission and QY of IOC clearly indicates a reduction in non-radiative decay. The PL lifetime measurements confirm the reduction of non-radiative losses, the corresponding fluorescence lifetime was significantly elongated with values increasing from 3.92 × 10⁻⁹ ns to 1.24 × 10⁻⁸ ns (Fig. S25 in Supporting information), According to the previous reports [54,55], adding water molecules to optical materials can help reduce non-radiative losses. In addition, the hydrogen bonds between water molecules and sulfonic acid groups restrict intermolecular motions (RIM). In our experiment, SC-XRD analysis revealed that after 12 h of UV light exposure, two additional water molecules were incorporated into the asymmetric unit of the IOC single crystal. These two water molecules form hydrogen bonds with the oxygen atoms of the sulfonic acid group (Fig. 4e). The increase in hydrogen bonds enhances structural stability and may help reduce non-radiative decay. When IOC is dispersed in methanol and water, it absorbs water molecules more readily under UV irradiation compared to when it is in air, leading to a rapid increase in fluorescence intensity. Furthermore, hydrogen bonds between fluorescent molecules and water, along with van der Waals forces and electrostatic interactions among solvent molecules, can induce blue shifts in fluorescence emission peaks.
In conclusion, a new class of ionic-bonded organic crystal (IOC) has been successfully constructed using TPE-based multidentate ionic salt and multidentate sulfonic acids as customized monomers. The crystal was composed of anion, cation, and water molecules. The IOC exhibits a clear response to UV light, characterized by blue-shifted and enhanced emission in dilute solutions through the reduction of non-radiative processes, including RIM and CT. After irradiation, the QY increased from 7.0% to 41.3%. This study has potential applications in information storage, data encryption and anti-counterfeiting measures.
The authors declare that they have no known competing financial interests or personal relationships that could have appeared to influence the work reported in this paper.
Juanjuan Wang: Writing – original draft, Methodology, Formal analysis, Conceptualization. Yangxia Han: Writing – original draft, Formal analysis. Qixia Guan: Methodology, Formal analysis. Jia Chen: Writing – review & editing, Project administration, Formal analysis. Hongdeng Qiu: Writing – review & editing, Project administration, Formal analysis, Conceptualization.
The authors thank the Gansu Natural Science Foundation (No. 21JR7RA076) and LICP Cooperation Foundation for Young Scholars (No. HZJJ23-6) for financial support.
Supplementary material associated with this article can be found, in the online version, at doi:
Y. Kobayashi, J. Abe, Chem. Soc. Rev. 51 (2022) 2397–2415. doi: 10.1039/d1cs01144h
Z. He, L. Shan, J. Mei, et al., Chem. Sci. 6 (2015) 3538–3543. doi: 10.1039/C5SC00900F
T. Zhang, X.Y. Lou, X. Li, et al., Adv. Mater. 35 (2025) 2210551.
D.X. Xia, X. Wang, W.Q. Sun, et al., Chem. Eng. J. 484 (2024) 149551. doi: 10.1016/j.cej.2024.149551
B. Garai, A. Mallick, R. Banerjee, Chem. Sci. 7 (2016) 2195–2200. doi: 10.1039/C5SC04450B
Y.J. Ma, J.X. Hu, S.D. Han, et al., J. Am. Chem. Soc. 142 (2020) 2682–2689. doi: 10.1021/jacs.9b13461
L. Ma, C. Li, Q. Yan, et al., Chin. Chem. Lett. 31 (2020) 361–364. doi: 10.1016/j.cclet.2019.07.040
M. Hussain, Z. Ahmad, O. Ejeromedoghene, et al., Int. J. Biol. Macromol. 293 (2025) 139308. doi: 10.1016/j.ijbiomac.2024.139308
H. Liu, Y. Gu, Y. Dai, et al., J. Am. Chem. Soc. 142 (2020) 1153–1158. doi: 10.1021/jacs.9b11080
P.Q. Nhien, T.T.K. Cuc, T.M. Khang, et al., ACS Appl. Mater. Interfaces 12 (2020) 47921–47938. doi: 10.1021/acsami.0c12726
G. Huang, Q. Xia, W. Huang, et al., Angew. Chem. Int. Ed. 58 (2019) 17814–17819. doi: 10.1002/anie.201910530
Y. Hou, Z. Zhang, S. Lu, et al., J. Am. Chem. Soc. 142 (2020) 18763–18768. doi: 10.1021/jacs.0c09904
Y. Liu, Z. Guo, Y. Guo, et al., Chin. Chem. Lett. 34 (2023) 108531. doi: 10.1016/j.cclet.2023.108531
L. Feng, Y. Yuan, B. Yan, et al., Nat. Comm. 13 (2022) 1389. doi: 10.1038/s41467-022-29107-9
W. Tian, J. Zhang, J. Yu, et al., Adv. Funct. Mater. 28 (2018) 1703548. doi: 10.1002/adfm.201703548
S.L. Li, M. Han, Y. Zhang, et al., J. Am. Chem. Soc. 141 (2019) 12663–12672. doi: 10.1021/jacs.9b04930
X. Zhang, Y. Qin, H. Zhang, et al., Chin. Chem. Lett. (2024), Doi: https://doi.org/ 10.1016/j.cclet.2024.110715.
D. Yan, Q. Wu, D. Wang, B.Z. Tang, Angew. Chem. Int. Ed. 60 (2021) 15724–15742. doi: 10.1002/anie.202006191
X.Y. Lou, Y.W. Yang, Aggregate 1 (2020) 19–30. doi: 10.1002/agt2.1
D. Dai, J. Yang, Y.W. Yang, Chem. Eur. J. 28 (2022) e202103185. doi: 10.1002/chem.202103185
Y. Wang, J. Nie, W. Feng, et al., Chem. Rev. 120 (2020) 4534–4577. doi: 10.1021/acs.chemrev.9b00814
S. Liu, Y. Cheng, Y. Li, et al., ACS Nano 14 (2020) 2090–2098. doi: 10.1021/acsnano.9b08761
Y. Wang, Y. Hong, J. Deng, S. Cao, L.J. Fan, J. Colloid. Interf. Sci. 655 (2024) 622–633. doi: 10.1016/j.jcis.2023.11.024
Z. Xie, X. Zhang, Y. Xiao, et al., Adv. Mater. 35 (2023) 2212273. doi: 10.1002/adma.202212273
Y. Shen, Y. Le, Y. Wu, T. Chen, Chem. Soc. Rev. 20 (2024) 606–623. doi: 10.1039/d3cs00753g
Z. Zhao, H. Zhang, J.W.Y. Lam, B.Z. Tang, Angew. Chem. Int. Ed. 59 (2020) 9888–9907. doi: 10.1002/anie.201916729
J. Mei, N.L.C. Leung, R.T.K. Kwok, J.W.Y. Lam, B.Z. Tang, Chem. Rev. 115 (2015) 11718–11940. doi: 10.1021/acs.chemrev.5b00263
J.M. Lehn, Science 260 (1993) 1762–1763. doi: 10.1126/science.8511582
C. Yan, Q. Li, X. Miao, et al., Angew. Chem. Int. Ed. 62 (2023) e202308029. doi: 10.1002/anie.202308029
Q.Q. Xia, X.H. Wang, J.L. Yu, et al., Aggregate 4 (2023) e370. doi: 10.1002/agt2.370
R.S. Patil, D. Banerjee, C. Zhang, P. Thallappally, J. Atwood, Angew. Chem. Int. Ed. 55 (2016) 4523–4526. doi: 10.1002/anie.201600658
K. Zhang, X.Y. Lou, Y. Wang, W. Huan, Y.W. Yang, Chin. Chem. Lett. 36 (2025) 110464. doi: 10.1016/j.cclet.2024.110464
Y. Li, X. Lou, C. Wang, et al., Chin. Chem. Lett. 34 (2023) 107877. doi: 10.1016/j.cclet.2022.107877
W. Niu, Z. Li, F. Liang, H. Zhang, X. Liu, Angew. Chem. Int. Ed. 63 (2024) e202318434. doi: 10.1002/anie.202318434
L. Liu, M. Zhu, J. Feng, et al., Aggregate 5(2024): e494. doi: 10.1002/agt2.494
X. Dong, Z. Zhang, H. Xiao, et al., Angew. Chem. Int. Ed. 63 (2024) e202318368. doi: 10.1002/anie.202318368
S. Yu, G.L. Xing, L.H. Chen, T. Ben, B.L. Su, Adv. Mater. 32 (2020) 2003270. doi: 10.1002/adma.202003270
M. Wathier, M.W. Grinstaf, J. Am. Chem. Soc. 130 (2008) 9648–9649. doi: 10.1021/ja803248q
C.F.J. Faul, Acc. Chem. Res. 47(2014) 3428–3438. doi: 10.1021/ar500162a
H. Yan, L. Zhang, P. Yu, L. Mao, Anal. Chem. 89 (2017) 996–1001. doi: 10.1021/acs.analchem.6b04350
A. Gak, S. Kuznetsova, Y. Nelyubina, et al., Cryst. Growth Des. 21 (2021) 6364–6372. doi: 10.1021/acs.cgd.1c00838
J.B. Ming, X. Li, J. Li, W. Yu, W. Wang, Cryst. Growth Des. 22 (2022) 1212–1220. doi: 10.1021/acs.cgd.1c01162
L. Liu, Z. Liu, Y. Ren, et al., Angew. Chem. Int. Ed. 60 (2021) 8948–8959. doi: 10.1002/anie.202100984
M. Khorloo, Y. Cheng, H. Zhang, et al., Chem. Sci. 11 (2020) 997–1005. doi: 10.1039/c9sc04239c
J. Wang, W. Deng, Y. Han, J. Chen, H. Qiu, A.C.S. Appl. Nano Mater. 7 (2024) 19473–19480. doi: 10.1021/acsanm.4c03361
B. Ren, F. Gao, Z. Tong, et al., Chem. Phy. Lett. 307 (1999) 55–61. doi: 10.1016/S0009-2614(99)00495-9
G. Huang, B. Ma, J. Chen, et al., Chem. Eur. J. 18 (2012) 3886–3892. doi: 10.1002/chem.201103675
H. Ito, K. Mutoh, J. Abe, J. Am. Chem. Soc. 145 (2023) 6498–6506. doi: 10.1021/jacs.3c00476
J. Zou, Y. Fang, Y. Shen, et al., Angew. Chem. Int. Ed. 61 (2022) e202207426. doi: 10.1002/anie.202207426
J. Zhang, Y. Zeng, H. Lu, et al., Cryst. Growth Des. 20 (2020) 2617–2622. doi: 10.1021/acs.cgd.9b01736
S. Chen, Y. Ju, H. Zhang, et al., Angew. Chem. Int. Ed. 62 (2023) e202308418. doi: 10.1002/anie.202308418
M. Yuan, F. Ma, L. Chen, et al., J. Am. Chem. Soc. 146 (2024) 1250–1256. doi: 10.1021/jacs.3c10511
G. Gou, L. Fang, M. Wang, et al., Adv. Opt. Mater. 11 (2023) 2300489. doi: 10.1002/adom.202300489
H. Gao, B. Ding, C. Wang, et al., J. Mater. Chem. C 9 (2021) 16581–16586. doi: 10.1039/d1tc03740d
L. Jiang, H. Ding, S. Lu, et al., Angew. Chem. Int. Ed. 59 (2020) 9986–9991. doi: 10.1002/anie.201913800

Figure 1 (a) Schematic of the synthesis of IOC by TPE-based TPE-Bim-Br4 and BDA. (b) The cationic layer formed by TPE-Bim4+. (c) The anionic layer formed by DBA2-.

Figure 2 (a) The optical microscope image. (b) 1H NMR spectra of IOC dissolved in DCl and D2O at room temperature. (c) The PXRD analysis of single crystals and experimental PXRD patterns. (d) TGA profiles in nitrogen atmosphere. (e) The PXRD of IOC after treatment at 120 ℃ for 2 h. (f) The PXRD pattern of IOC after 24 h in various solvents.

Figure 3 (a) Emission spectra of IOC after UV-light irradiation for different periods of time. (b) Time-dependent PL intensity of IOC in solution at 415 nm. (c) Photographs of the crystal solution IOC before and after UV light irradiation (under a 365 nm UV lamp). (d) Corresponding 1931 CIE chromaticity diagram of IOC before and after UV light irradiation. (e) The pictures of the before and after irradiation using writable ink made of IOC. Time-dependent photographs of IOC crystals with UV irradiation: (f) under a 365 nm UV lamp, (g) under an incandescent light, (h) in the dark.

 扫一扫看文章

扫一扫关注我们
 DownLoad:
 下载:
下载:

 下载:
下载: