Citation:
XIE Ruirui, WANG Qian, XUE Dongxu, ZHANG Zonghui, ZHANG Yufeng, BAI Junfeng. A Photoluminescent Anionic Metal-Organic Framework with Oxalamide Groups for Selective Methylene Blue Adsorption[J]. Chinese Journal of Applied Chemistry,
2017, 34(9): 1066-1071.
doi:
10.11944/j.issn.1000-0518.2017.09.170179

草酰胺功能化的荧光阴离子骨架及其对亚甲基蓝的选择性吸附
English
A Photoluminescent Anionic Metal-Organic Framework with Oxalamide Groups for Selective Methylene Blue Adsorption
Abstract:
Adsorption of dyes has received wide attention due to its threat to human health and environment. In this work, a new oxalamide-functionalized anionic metal-organic framework {[(CH3)2NH2]2(CdL)}·x(Solvent)(1) has been successfully synthesized by virtue of a tetratopic ligand of 5, 5'-[oxalylbis(azanediyl)]diisophthalic acid (H4L). Single crystal X-ray diffraction reveals that compound 1 exhibits a 2-fold interpenetrated 3D framework and (3, 3, 4)-connected topological network with a new point(Schläfli) symbol of {83}2{86}. Interestingly, it displays not only selective adsorption capacity toward methylene blue(MB) over methyl orange(MO), but also the photoluminescence emission at visible region.
-
Key words:
- anionic framework
- / new topology
- / adsorption of methylene blue
-
Dyes used in the manufacturing process, such as inks, textiles, leathers, foods and pharmaceuticals, have been the human carcinogens and ecological threat for the preservation of human health and the protection of environment[1-5]. The removal of dyes from polluted water is greatly significant. Adsorption of them by porous solid materials appears to be an effective approach to remove the organic pollutants[1]. In comparison with traditional porous solid materials(i.e., zeolite, activated carbon), MOFs(metal-organic frameworks) with modular assembly, intriguing structures, tunable pore sizes and shapes, modifiable pore surfaces and so on, serve as a class of more promising porous materials[2-4]. In addition, MOFs display a potential application in the photoluminescence[6-9]. However, the report of MOFs combined with the properties of dye adsorption and photoluminescence is still less. We are interested in the design and construction of functional MOFs aiming at specific applications, i.e., dye adsorption and photoluminescence. Herein, we utilized an oxalamide-functionalized organic ligand of 5, 5′-[oxalylbis(azanediyl)]diisophthalic acid (H4L), reacting with the salt of Cd(NO3)2·4H2O, affording a 2-fold interpenetrated 3D MOF, {[(CH3)2NH2]2(CdL)}·x(Solvent)(1). Due to its anionic framework attribute, compound 1 exhibits selective adsorption toward cationic dye of methylene blue(MB) over anionic dye of methyl orange(MO). Additionally, compound 1 also displays interesting photoluminescence emission at visible region.
1 Experimental
1.1 Materials and methods
All reagents were obtained from commercial sources and used without further purification [Cd(NO3)2·4H2O(alfa, AR99%), 5-Aminoisophthalic acid(acros, AR98%) and Oxalyl chioride(Sinopharm Chemical Reagent, CP98%)]. H4L was prepared according to the previously reported procedure[10]. Fourier-transform infrared(FT-IR) spectrum(4000~400 cm-1, KBr pellet) was collected in the solid state on a Bruker EQUINOX-55 FT-IR spectrometer(Germany, Bruker, Co). Powder X-ray diffraction(PXRD)(Germany, Bruker, Co) measurements were performed on a D/Max2550VB+/PC diffractometer with CuKα(λ=0.15406 nm), and the X-ray tube was operated at 40 kV and 40 mA. High resolution thermogravimetric analysis(TGA)(US, TA instrument Co) were performed under a continuous N2 flow and recorded on a Q600SDT thermal analyzer with a heating rate of 5 ℃ per minute. The photoluminescence and phosphorescence spectra were recorded on a F-4600 fluorescence spectrophotometer(Japan, Hitachi, Ltd).
1.2 Synthesis of {[(CH3)2NH2]2 (CdL)}·x(Solvent)(1)
H4L(36.19 mg, 0.087 mmol), Cd(NO3)2·4H2O(13.42 mg, 0.0435 mmol), N, N-dimethylformamide(DMF, 1 mL), C2H5OH(0.5 mL) and CH3CN(0.5 mL) were combined in a 20 mL scintillation vial, sealed, and heated to 105 ℃ for 36 h and cooled to room temperature. The block crystals were collected and washed by DMF. IR(KBr), σ/cm-1:1681, 1642, 1565, 1488, 1372, 786, 728.
1.3 Crystal structure determination
Single-crystal X-ray diffraction data was collected using a Bruker D8 Venture diffractometer(CuKα, λ=0.154178 nm) for compound 1. Indexing was performed using APEX2(Difference Vectors method)[11]. Data integration and reduction were performed using SaintPlus 6.01[12]. Absorption correction was performed by multi-scan method implemented in SADABS[13]. Space groups were determined using XPREP implemented in APEX2[12]. Structures were solved using SHELXS-97(direct methods) and refined using SHELXL-97(full-matrix least-squares on F2) contained in Olex2[14]. For compound 1, the contribution of heavily disordered solvent molecules was treated as diffuse using Squeeze procedure implemented in Platon program[15-16]. Crystal data and refinement conditions are shown in Table 1. CCDC:1551383.
 Table 1.
Crystal data and structure refinement for compound 1
Table 1.
Crystal data and structure refinement for compound 1
Identification code Compound 1 Empirical formula C18H8CdN2O10 Formula mass 524.66 T/K 293(2) Wavelength/nm 0.154 178 Crystal system Monoclinic Space group P21/n Unit cell dimensions a=1.024 88(1) nmα=90° b=1.854 8(3) nmβ=108.074(3)° c=1.559 1(2) nmγ=90° Volume/nm3 2.817 6(7) Z 4 Density(calculated)/(mg·m-3) 1.237 Absorption coefficient/mm-1 6.603 F(000) 1 032 Crystal size/mm3 0.100×0.060×0.050 Identification code Compound 1 Theta range for data collection/(°) 5.176 to 72.368 Index ranges -12≤h≤12, -22≤k≤22, -19≤l≤19 Reflections collected 26302 Independent reflections 5 388 [R(int)=0.047 5] Completeness to theta=20.879° 96.7% Refinement method Full-matrix least-squares on F2 Data/restraints/parameters 5 388/0/290 Goodness-of-fit on F2 1.086 Final R indices [I > 2sigma(I)] R1=0.034 3, wR2=0.085 5 R indices(all data) R1=0.035 0, wR2=0.085 9 Largest diff. peak and hole/(e·nm-3) 813 and -907 2 Results and Discussion
2.1 Crystal structure of compound 1
Indeed, solvothermal reaction of Cd(NO3)2·4H2O and H4L in the presence of DMF/EtOH/acetonitrile afforded high yields of colorless block crystals of compound 1. Crystallographic data reveals that compound 1 crystallizes in monoclinic space group P21/n. In compound 1, each Cd2+ ion is coordinated by seven oxygen atoms from four different carboxylate groups, meanwhile, each ligand is linked by four Cd2+ ions, leading to the formation of a 3D anionic framework, which further takes place the 2-fold interpenetration giving the formation of the double-fold interpenetrated three-dimensional anionic porous compound 1(Fig. 1A, 1B). Along a-and c-axis, compound 1 exhibits the 1D channels with the pore size(determined by the van der Waals diameter of the inserted pseudo atom) of 0.36 and 0.33 nm, respectively. The total potential solvent accessible volumes in desolvated compound 1 calculated by the PLATON/SOLV program is ca. 44.5%.
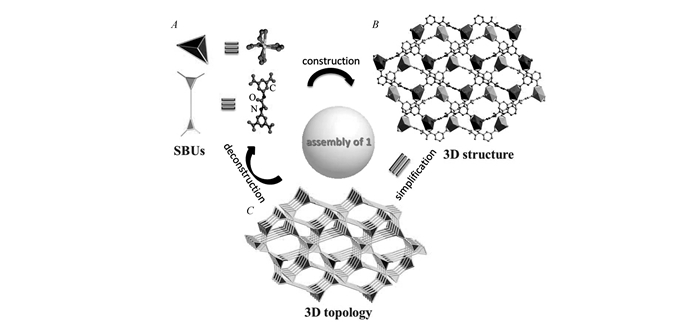 图1
(A)Inorganic and organic secondary building units(SBUs) in compound 1; (B)The 2-fold interpenetrated 3D porous anionic framework of compound 1 built from Cd2+ ion and H4L; (C)The topological network of compound 1 with a new point(Schläfli) symbol of {83}2{86} constructed from the SBUs in (A). Hydrogen atoms are omitted for clarity
Figure1.
(A)Inorganic and organic secondary building units(SBUs) in compound 1; (B)The 2-fold interpenetrated 3D porous anionic framework of compound 1 built from Cd2+ ion and H4L; (C)The topological network of compound 1 with a new point(Schläfli) symbol of {83}2{86} constructed from the SBUs in (A). Hydrogen atoms are omitted for clarity
图1
(A)Inorganic and organic secondary building units(SBUs) in compound 1; (B)The 2-fold interpenetrated 3D porous anionic framework of compound 1 built from Cd2+ ion and H4L; (C)The topological network of compound 1 with a new point(Schläfli) symbol of {83}2{86} constructed from the SBUs in (A). Hydrogen atoms are omitted for clarity
Figure1.
(A)Inorganic and organic secondary building units(SBUs) in compound 1; (B)The 2-fold interpenetrated 3D porous anionic framework of compound 1 built from Cd2+ ion and H4L; (C)The topological network of compound 1 with a new point(Schläfli) symbol of {83}2{86} constructed from the SBUs in (A). Hydrogen atoms are omitted for clarity
To better understand the structure, the Cd2+ ion is simplified as 4-connected node, and the organic ligand serve as two 3-connected nodes, then compound 1 may be described as a (3, 3, 4)-connected topological network with a new point(Schläfli) symbol of {83}2{86} (Fig. 1C).
2.2 Thermal stabilities and powder X-ray diffraction
The thermogravimetric analysis(TGA) of as-synthesized compound 1 was performed to confirm its thermal stability. As shown in Fig. 2, a large mass loss is observed before 300 ℃, which indicates the loss of solvent molecules in the pores. Then, a further mass loss is corresponding to the framework collapse around 370 ℃. Moreover, the TGA curves of solvent-exchanged compound 1 exhibit the similar profiles.
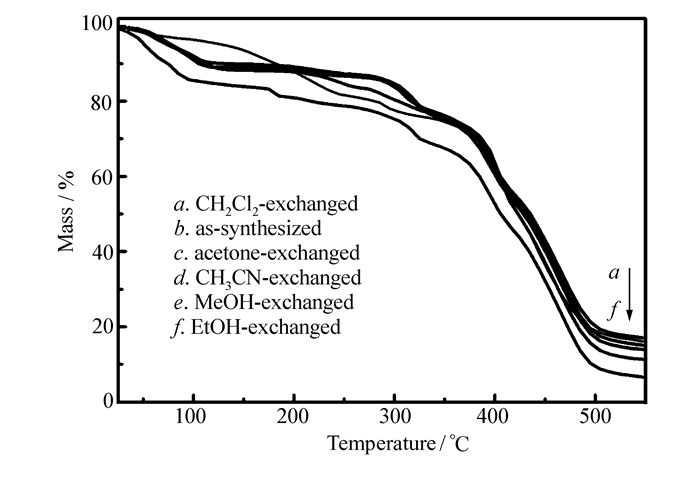 图2
TGA plots of the as-synthesized and solvent-exchanged compound 1
Figure2.
TGA plots of the as-synthesized and solvent-exchanged compound 1
图2
TGA plots of the as-synthesized and solvent-exchanged compound 1
Figure2.
TGA plots of the as-synthesized and solvent-exchanged compound 1
The powder X-ray diffraction(PXRD) has been measured to confirm the phase purity of the bulk samples(Fig. 3). The pattern of the as-synthesized sample is well coincident with the simulated one derived from the X-ray single crystal data, implying the phase purity of the bulk sample. In addition, the PXRD patterns of solvent-exchanged compound 1 that are also coincident with the as-synthesized one indicate the good stability of compound 1 in the different solvent of acetone, CH2Cl2, CH3CN, methanol and ethanol, respectively.
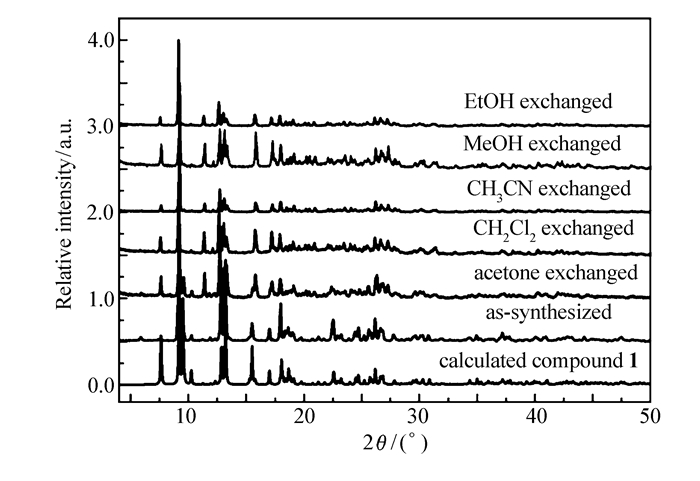 图3
PXRD patterns of the calculated, as-synthesized and solvent-exchanged compound 1
Figure3.
PXRD patterns of the calculated, as-synthesized and solvent-exchanged compound 1
图3
PXRD patterns of the calculated, as-synthesized and solvent-exchanged compound 1
Figure3.
PXRD patterns of the calculated, as-synthesized and solvent-exchanged compound 1
2.3 Selective adsorption of MB over MO
To evaluate the adsorption capacity of compound 1 for dyes of MB and MO, the UV/Visible absorption spectrum of cationic MB in DMF solution in the presence of compound 1 was monitored at room temperature. As shown in Fig. 4, the main absorption band of MB at 670 nm drops rapidly along with time and completely vanishes after 74 h, which indicates the certain adsorption capacity of MB by compound 1 and simultaneously confirms the inherent anionic framework of compound 1. Meanwhile, the UV/Visible absorption spectrum of anionic MO in DMF solution in the presence of compound 1 was also monitored at room temperature, resulting in negligible change of the main absorption band of MO at 430 nm.
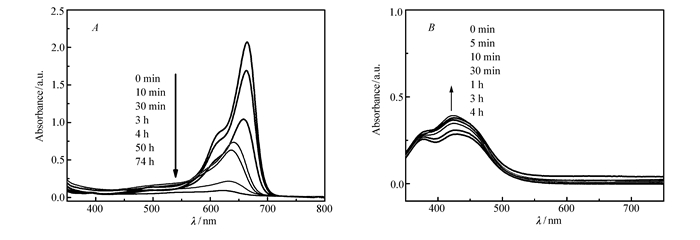 图4
Sequential UV-Vis spectra changes of MB(A) and MO(B) in DMF solution after the addition of compound 1
Figure4.
Sequential UV-Vis spectra changes of MB(A) and MO(B) in DMF solution after the addition of compound 1
图4
Sequential UV-Vis spectra changes of MB(A) and MO(B) in DMF solution after the addition of compound 1
Figure4.
Sequential UV-Vis spectra changes of MB(A) and MO(B) in DMF solution after the addition of compound 1
2.4 Photoluminescence properties
Motivated by the luminescent emission of many d10-configuration transition metals-based MOFs, the photoluminescence(PL) properties of compound 1 was measured together with the organic ligand of H4L(Fig. 5). Upon photo excitation at 270 nm, the ligand displays a broad emission at 400 nm, while besides the luminescent emission at 400 nm, compound 1 also demonstrates an apparent luminescence emission band peaked at 485 nm. The luminescence emission band of compound 1 may be attributed to the ligand-to-metal charge transfer(LMCT)[17-19].
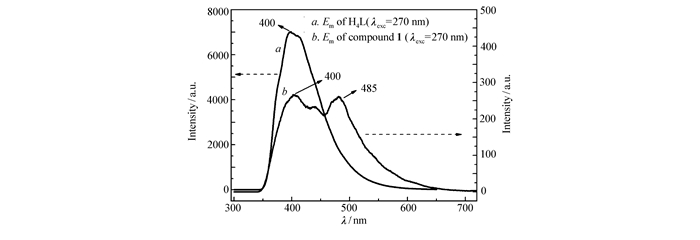 图5
Solid state PL spectra of linker H4L and compound 1 recorded at room temperature
Figure5.
Solid state PL spectra of linker H4L and compound 1 recorded at room temperature
图5
Solid state PL spectra of linker H4L and compound 1 recorded at room temperature
Figure5.
Solid state PL spectra of linker H4L and compound 1 recorded at room temperature
3 Conclusion
In conclusion, based upon a tetratopic ligand of 5, 5′-[oxalylbis(azanediyl)]diisophthalic acid, a new oxalamide-functionalized anionic MOF of compound 1 has been successfully synthesized with 2-fold interpenetrated 3D porous framework. Interestingly, compound 1 exhibits a (3, 3, 4)-connected topological network with a new point(Schläfli) symbol of {83}2{86}. Moreover, it displays selective adsorption capacity toward methylene blue over methyl orange due to its anionic framework and the photoluminescence emission at visible region.
-
-
[1]
Li Y, Yuan H H, Li C P. A 2D Zn(Ⅱ) Metal-Organic Framework to Show Selective Removal of Neutral Red(NR) from Water[J]. Inorg Chem Commun, 2017, 80: 36-40. doi: 10.1016/j.inoche.2017.04.006
-
[2]
Li P Z, Su J, Liang J. A Highly Porous Metal-Organic Framework for Large Organic Molecule Capture and Chromatographic Separation[J]. Chem Commun, 2017, 53(24): 3434-3437. doi: 10.1039/C7CC01063J
-
[3]
Hou Y X, Sun J S, Zhang D P. Porphyrin-Alkaline Earth MOFs with the Highest Adsorption Capacity for Methylene Blue[J]. Chem Eur J, 2016, 22(18): 6345-6352. doi: 10.1002/chem.v22.18
-
[4]
Qin J S, Zhang S R, Du D Y. A Microporous Anionic Metal-Organic Framework for Sensing Luminescence of Lanthanide(Ⅲ) Ions and Selective Absorption of Dyes by Ionic Exchange[J]. Chem Eur J, 2014, 20(19): 5625-5630. doi: 10.1002/chem.201304480
-
[5]
Yan A X, Yao S, Li Y G. Incorporating Polyoxometalates into a Porous MOF Greatly Improves Its Selective Adsorption of Cationic Dyes[J]. Chem Eur J, 2014, 20(23): 6927-6933. doi: 10.1002/chem.201400175
-
[6]
Zhang Z H, Liu B, Xu L. Combination Effect of Ionic Liquid Components on the Structure and Properties in 1, 4-Benzenedicarboxylate Based Zinc Metal-Organic Frameworks[J]. Dalton Trans, 2015, 44(41): 17980-17989. doi: 10.1039/C5DT02672E
-
[7]
Wang Z X, Zheng B S, Liu H T. High-Capacity Gas Storage by a Microporous Oxalamide-Functionalized NbO-Type Metal-Organic Framework[J]. Cryst Growth Des, 2013, 13(11): 5001-5006. doi: 10.1021/cg401180r
-
[8]
Wu J X, Yan B. A Dual-Emission Probe to Detect Moisture and Water in Organic Solvents Based on Green-Tb3+ Post-coordinated Metal-Organic Frameworks with Red Carbon Dots[J]. Dalton Trans, 2017, 46(21): 7098-7105. doi: 10.1039/C7DT01352C
-
[9]
Li H R, Sheng T L, Xue Z Z. Synthesis, Structure, Characterization, and Multifunctional Properties of Rare Earth Organic Frameworks[J]. Cryst Eng Comm, 2017, 19: 2106-2112. doi: 10.1039/C7CE00202E
-
[10]
Nada H A, Mikhail S, Yan Y. Analysis of High and Selectivity Uptake of CO2 in an Oxamide-Containing {Cu2(OOCR)4}-Based Metal-Organic Framework[J]. Chem Eur J, 2014, 20(24): 7317-7324. doi: 10.1002/chem.201304005
-
[11]
APEX2[CP]. Bruker AXS Inc, Madison, Wisconsin, USA, Bruker 2010.
-
[12]
SAINT. Data Reduction Software[CP]. Bruker AXS Inc, Madison, Wisconsin, USA, Bruker 2009.
-
[13]
Sheldrick G M. SADABS. Program for Empirical Absorption Correction[CP]. University of Gottingen, Germany, 2008.
-
[14]
Dolomanov O V, Bourhis L J, Gildea R J. OLEX2:A Complete Structure Solution, Refinement and Analysis Program[J]. J Appl Cryst, 2009, 42(2): 339-341. doi: 10.1107/S0021889808042726
-
[15]
Spek A L. An Effective Method for the Refinement of Crystal Structures Containing Disordered Solvent Regions[J]. Acta Cryst, 1990, A46: 194-201.
-
[16]
Spek T L. Platon, an Integrated Tool for the Analysis of the Results of a Single Crystal Structure Determination[J]. Acta Cryst, 1990, A46: c34.
-
[17]
Li J J, Wang C C, Guo J. Two Zigzag Chain-like Lanthanide(Ⅲ) Coordination Polymers Based on the Rigid 1, 3-Adamantanedicarboxylic Acid Ligand:Crystal Structure, Luminescence and Magnetic Properties[J]. Polyhedron, 2017, 126: 17-22. doi: 10.1016/j.poly.2017.01.010
-
[18]
Hu L L, Shen C, Xiang J. Synthesis and Crystal Structure of a 3-D Ag+ Coordination Polymer with White-light Emission[J]. Cryst Res Technol, 2017, 52(4): 1700017. doi: 10.1002/crat.v52.4
-
[19]
Madhan R, Mani K, Madhavan J. Synthesis, Structure, Redox Behavior, Catalytic Activity and DFT Study of a New Family of Ruthenium(Ⅲ) 1-(Arglazo) Naphtholate Complexes[J]. J Org Chem, 2017, 830: 33-41. doi: 10.1016/j.jorganchem.2016.12.003
-
[1]
-

Figure 1 (A)Inorganic and organic secondary building units(SBUs) in compound 1; (B)The 2-fold interpenetrated 3D porous anionic framework of compound 1 built from Cd2+ ion and H4L; (C)The topological network of compound 1 with a new point(Schläfli) symbol of {83}2{86} constructed from the SBUs in (A). Hydrogen atoms are omitted for clarity

Figure 3 PXRD patterns of the calculated, as-synthesized and solvent-exchanged compound 1

Figure 4 Sequential UV-Vis spectra changes of MB(A) and MO(B) in DMF solution after the addition of compound 1

Figure 5 Solid state PL spectra of linker H4L and compound 1 recorded at room temperature
Table 1. Crystal data and structure refinement for compound 1
Identification code Compound 1 Empirical formula C18H8CdN2O10 Formula mass 524.66 T/K 293(2) Wavelength/nm 0.154 178 Crystal system Monoclinic Space group P21/n Unit cell dimensions a=1.024 88(1) nmα=90° b=1.854 8(3) nmβ=108.074(3)° c=1.559 1(2) nmγ=90° Volume/nm3 2.817 6(7) Z 4 Density(calculated)/(mg·m-3) 1.237 Absorption coefficient/mm-1 6.603 F(000) 1 032 Crystal size/mm3 0.100×0.060×0.050 Identification code Compound 1 Theta range for data collection/(°) 5.176 to 72.368 Index ranges -12≤h≤12, -22≤k≤22, -19≤l≤19 Reflections collected 26302 Independent reflections 5 388 [R(int)=0.047 5] Completeness to theta=20.879° 96.7% Refinement method Full-matrix least-squares on F2 Data/restraints/parameters 5 388/0/290 Goodness-of-fit on F2 1.086 Final R indices [I > 2sigma(I)] R1=0.034 3, wR2=0.085 5 R indices(all data) R1=0.035 0, wR2=0.085 9 Largest diff. peak and hole/(e·nm-3) 813 and -907  下载: 导出CSV
-


 扫一扫看文章
计量
- PDF下载量: 0
- 文章访问数: 585
- HTML全文浏览量: 48
 下载:
下载:
