Scheme 1.
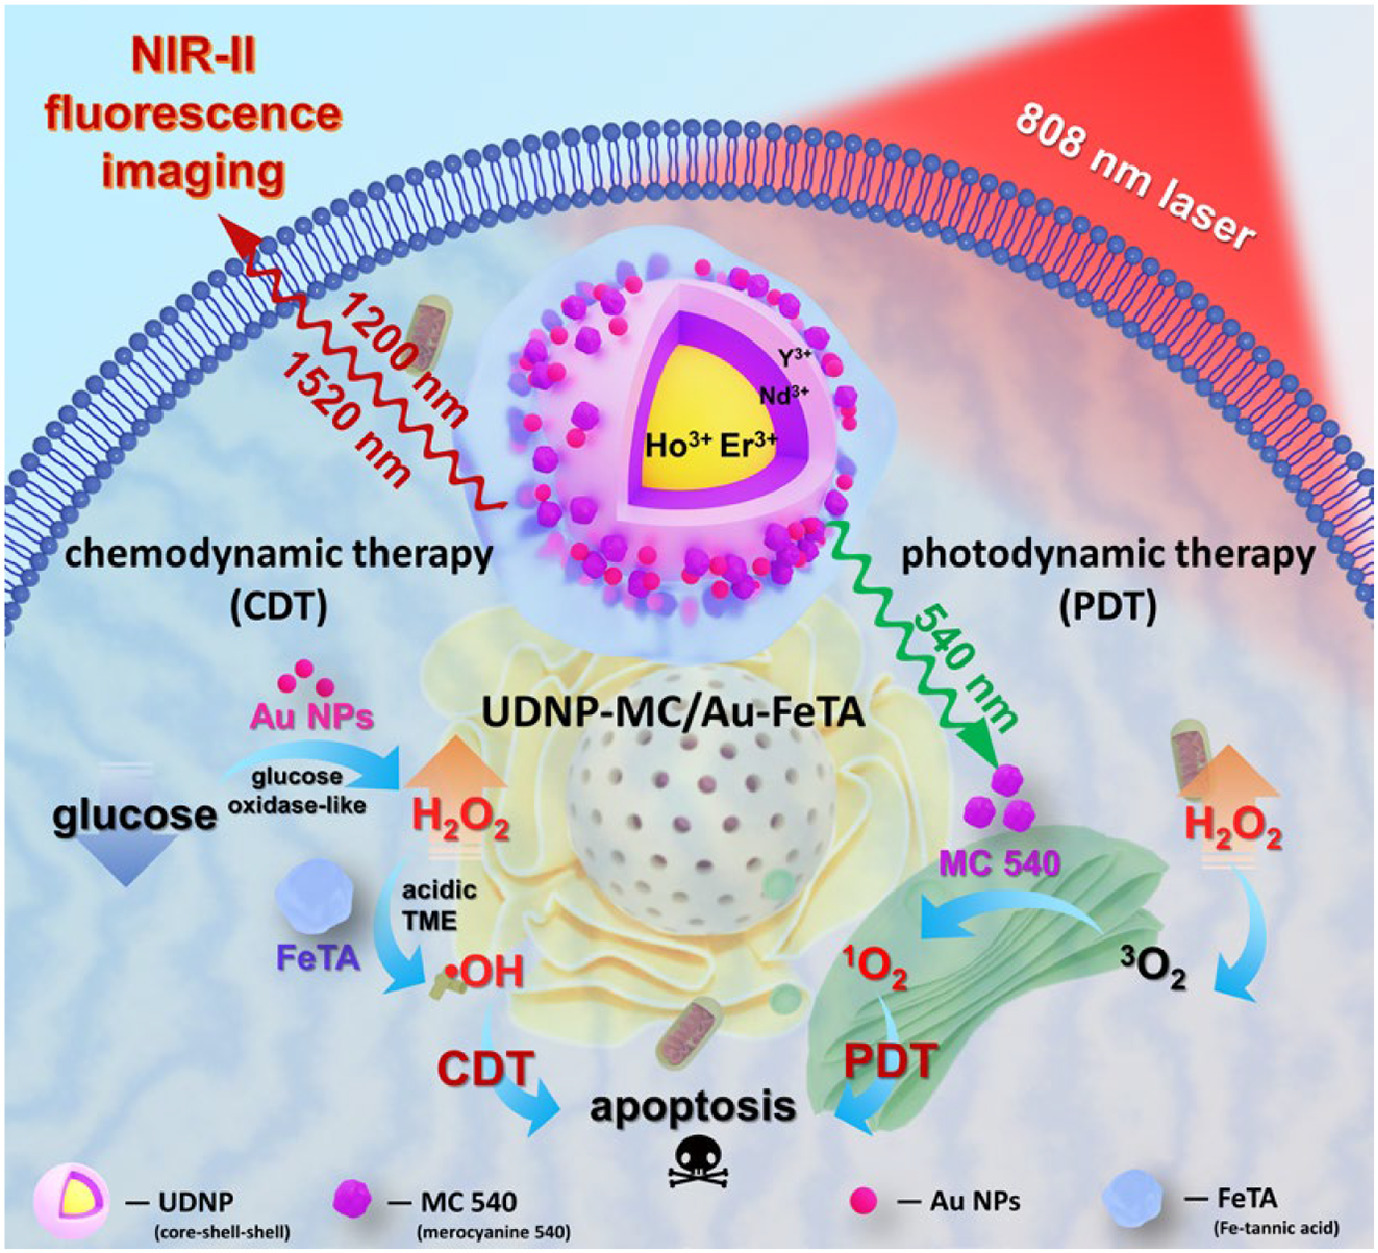
Schematic depiction of UDNP-MC/Au-FeTA for NIR-Ⅱ fluorescence imaging and synergistic CDT-PDT of tumor.
Au-reinforced chemo-photodynamic therapy of lanthanide-doped nanoplatforms with upconversion-downshifting luminescence via catalytic amplification
Ruohao Zhang , Yifei Zhou , Yu Lu , Xudong Sun , Jitong Gong , Kehong Lv , Xinyu Fu , Yukai Cheng , Jing Feng , Hongjie Zhang

Lanthanide-doped nanoparticles (LnNPs) have been widely studied for the diagnosis and treatment of malignant tumors [1–5]. LnNPs containing sensitized ions could absorb the near-infrared (NIR) light with deep tissue penetration feature. The absorbed energy is then transferred to luminescent ions, resulting in upconversion luminescence (UCL) and downshifting luminescence (DSL) [6]. Due to the matrix-independent energy levels, fixed luminescence wavelengths, and stable optical properties of lanthanide ions, LnNPs are often utilized as exceptional diagnostic and phototherapy reagents. Since deep tissue penetration and low tissue background fluorescence in the NIR-Ⅱ window (1000–1700 nm) [7–9], DSL in the NIR-Ⅱ window could be a powerful tool for NIR-Ⅱ fluorescence imaging diagnosis. In addition, due to the higher energy of UCL located in the visible region compared with NIR light, photosensitizers conjugated to LnNPs could be activated by UCL to generate reactive oxygen species (ROS) for photodynamic therapy (PDT). However, the luminescent ions doped in LnNPs are highly susceptible to mutual luminescence quenching due to the cross relaxation [10]. Therefore, it is necessary to allocate various luminescent ions in different shells to prevent their mutual relaxation quenching [11,12]. On the other hand, LnNPs with multi-layers may complicate the synthesis steps and lead to a large particle size [13], which hinder in vivo circulation and limit biological applications. In order to ensure that UCL and DSL could be achieved simultaneously, the selection and concentration of luminescent ions are crucial. Unfortunately, the cost of co-doping also tends to be the insufficient NIR-Ⅱ fluorescence imaging effect or ineffective therapeutic effect of PDT ascribed to decreased luminescence intensity [12,14–16]. To overcome these challenges, there is a pressing need for a more straightforward synthetic strategy that can achieve simultaneous UCL and DSL while maintaining the intensity of DSL. The development of a therapeutic nanoplatform with NIR-Ⅱ fluorescence imaging ability is crucial. Additionally, combining this nanoplatform with other innovative therapeutic approaches will be essential to ensure effective treatment and prevent the recurrence of tumors [17].
Au NPs with glucose oxidase (GOD)-like catalytic activity could catalyze glucose to produce hydrogen peroxide (H2O2, a kind of ROS) and gluconic acid via a two-step process involving the first step of dehydration of glucose and the subsequent reduction of O2 to H2O2 by two electrons [18–20]. Moreover, due to glycolysis and overexpression of superoxide dismutase in tumor cells, more lactic acid and H2O2 are accumulated in the tumor microenvironment (TME), resulting in a slightly acidic TME with high level of H2O2 compared with normal cells [21,22]. Fortunately, Fe-tannic acid (FeTA) could decompose and release Fe2+ under acidic conditions, as well as undergo a Fenton reaction with H2O2 to generate hydroxyl radicals (•OH, a highly reactive ROS) for chemodynamic therapy (CDT) [23–25]. Therefore, when UDNP was coupled to photosensitizers and modified with FeTA, the synergistic PDT-CDT could make up for the deficiency of single PDT. Furthermore, the catalytic effect of Au NPs could trigger the cascade reaction that promotes the accumulation of H2O2, accelerates the Fenton reaction, and significantly enhances the anti-tumor effect of CDT.
Herein, we constructed an Au-catalyzed lanthanide upconversion-downshifting nanoparticles (UDNPs) modified with merocyanine 540 (MC 540) and FeTA, which is abbreviated as UDNP-MC/Au-FeTA. As shown in Scheme 1, the core of UDNPs co-doped with two kinds of luminescent ions (Ho3+ and Er3+) could realize both UCL (540 nm) and DSL (1200 and 1520 nm). Nd3+-doped intermediate shell layer of UDNPs could absorb 808 nm laser energy and emit dual-wavelength DSL, enabling in vivo NIR-Ⅱ fluorescence imaging. Following co-doping of Ho3+ and Er3+, although the DSL intensity is diminished in comparison to mono-doping, the DSL with dual wavelengths situated within the NIR-Ⅱ region also permits efficient real-time in vivo imaging of tumors. In terms of its therapeutic potential, MC 540, as a photosensitizer, could be excited by the UCL of UDNP at 540 nm to generate singlet oxygen (1O2, a type of ROS) for PDT [26,27]. The modified Au NPs and FeTA could catalyze glucose in the slightly acidic TME into H2O2 and •OH through a cascade reaction to realize reinforced CDT. Moreover, high levels of H2O2 and acid were produced with the assistance of Au NPs, which could accelerate FeTA decomposition and Fenton reaction (Fe2+ + H2O2 → Fe3+ + •OH + OH−). Then, Fe3+ catalyzes the reaction of H2O2 to elevate the local O2 concentration (Fe3+ + H2O2 → Fe2+ + •OOH + H+ and Fe3+ + •OOH → Fe2+ + O2 + H+), which could alleviate hypoxia in the TME [23]. Consequently, the generation of 1O2 through PDT was markedly elevated. Therefore, UDNP-MC/Au-FeTA could achieve efficient synergistic dual-dynamic therapy of tumors guided by NIR-Ⅱ fluorescence imaging. Au-catalyzed UDNP co-doped with lanthanide ions as a dexterous design concept has the potential to bridge the gap between conventional combined NIR-Ⅱ fluorescence imaging diagnosis and phototherapy.
To realize better effects of NIR-Ⅱ fluorescence imaging with DSL and PDT with UCL, we first prepared a series of UDNPs with various doping concentrations of Ho3+ and Er3+ to explore the optimal doping ratio. Transmission electron microscope (TEM) images reveal that the core UDNPs (NaYF4:20%Yb,x%Er,y%Ho, x = 0–10, y = 0–20, as shown in Table S1 in Supporting information) are hexagonal phase, uniformly dispersed, and exhibit spherical shape with a diameter of approximately 25 nm (Figs. S1 and S2 in Supporting information). Since the core UDNPs are doped with two luminescent ions (Er3+ and Ho3+) and the sensitizer ion (Yb3+), core UDNPs could produce UCL at 540 nm (4S3/2 → 4I15/2 of Er3+ and 5S2 → 5I8 of Ho3+), DSL at 1200 nm (5I6 → 5I8 of Ho3+) and 1520 nm (4I13/2 → 4I15/2 of Er3+) under 980 nm laser irradiation [28]. When 2% Er3+ and 5% Ho3+ are co-doped, the photoluminescence (PL) intensities of UCL and DSL reach their maxima based on the comprehensive evaluation (Figs. S3 and S4 in Supporting information). Since the attenuation of 808 nm light in water is less than that of 980 nm light, we doped Nd3+ in the shell layer of UDNPs to achieve 808 nm excitation [29–31]. Based on NaYF4:20%Yb,2%Er,5%Ho as the core, we synthesized core-shell-shell UDNPs with different doping concentrations of Nd3+ (NaYF4:20%Yb,2%Er,5%Ho@NaYF4:20%Yb,z%Nd@NaYF4, z = 10–40). As shown in Figs. 1a and b, and Fig. S5 (Supporting information), the particle sizes of core-shell-shell UDNPs with various Nd3+ doping concentrations are ~42 nm. X-ray diffraction (XRD) patterns show that UDNPs possess hexagonal structure (Fig. 1c and Fig. S6 in Supporting information). It is surprisingly consistent that all intensities of the UCL at 540 nm and the DSL at 1200 and 1520 nm are optimal when doped with 20% Nd3+ (Fig. 1d and Fig. S7 in Supporting information). This is due to the fact that insufficient concentrations of Nd3+ cannot adequately absorb and transfer the 808 nm energy to Yb3+, while excessive concentrations of Nd3+ would cause the cross-relaxation with each other and lead to ineffective transfer of energy to the luminescent ions [32,33]. Therefore, we further synthesized the composites using NaYF4:20%Yb,2%Er,5%Ho@NaYF4:20%Yb,20%Nd@NaYF4 as the core-shell-shell UDNPs.
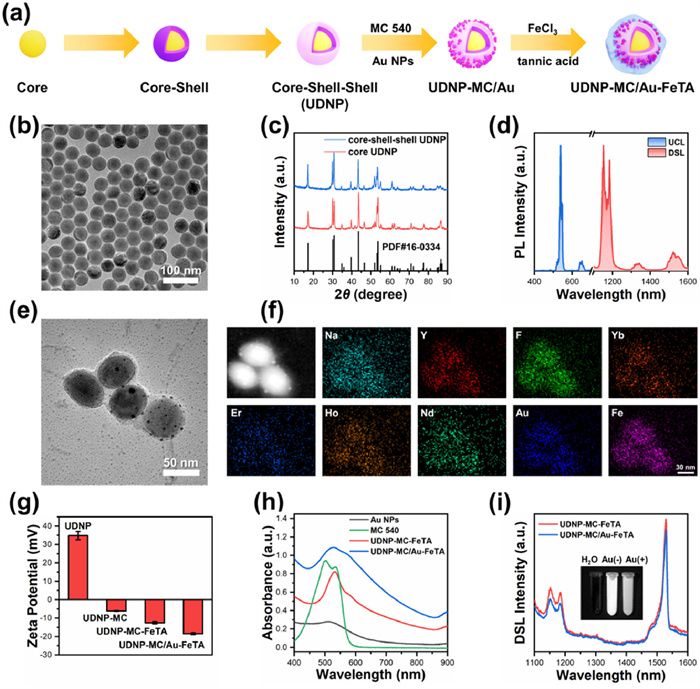
As shown in the TEM images (Fig. 1e and Fig. S8 in Supporting information), UDNPs are modified with low contrast MC 540 and FeTA, and high contrast Au NPs (~4 nm) in UDNP-MC/Au-FeTA. The high-angle annular dark field-scanning transmission electron microscopy (HAADF-STEM) and elemental mappings reveal the uniform distribution of involved lanthanide-, Au-, and Fe-elements in UDNP-MC/Au-FeTA (Fig. 1f). Besides, the hydrodynamic particle sizes of the nanoplatforms gradually increased from 65.6 nm to 181.2 nm with layer-by-layer modification (Fig. S9 in Supporting information). The above results reveal that UDNP-MC-FeTA and UDNP-MC/Au-FeTA were successfully constructed according to the design. When the coordinated oleic acid on the surface of UDNPs was removed, UDNPs show a positive potential, while the zeta potentials reversed to negative (−6.1 and −12.6 mV, respectively) after modification of MC 540 with sulfonic acid groups and FeTA with phenolic groups (Fig. 1g). After modification with Au NPs, the zeta potential of the nanoplatforms exhibit a continued decrease (−18.5 mV), which indicates an increase in solution stability. The ultraviolet (UV)-vis-NIR absorption spectra show that MC 540 exhibits strong absorption peaks at 540 and 500 nm, whereas Au NPs have a broad absorption band centered around 510 nm (Fig. 1h). Therefore, after modification of Au NPs, the absorption band of UDNP-MC/Au-FeTA becomes wider than that of UDNP-MC-FeTA. Additionally, since the surface of UDNP is not occupied by other ligands, MC 540 with a sulfonic acid group could be easily modified on the surface of UDNPs. The average encapsulation efficiency (EE) of MC 540 was calculated to be 95.15% based on the absorbance-concentration curves (Fig. S10 in Supporting information). Inductively coupled plasma-mass spectrometer (ICP-MS) results show that the concentrations of Au and Fe elements are 0.43 wt% and 0.38 wt% in UDNP-MC/Au-FeTA, respectively (Fig. S11 in Supporting information). Furthermore, both UDNP-MC-FeTA and UDNP-MC/Au-FeTA could achieve NIR-Ⅱ fluorescence imaging through DSL when exposed to an 808 nm laser (Fig. 1i).
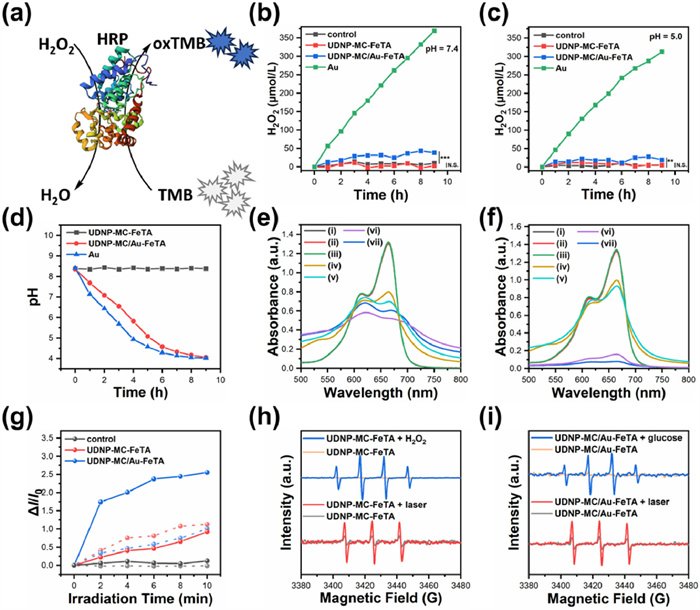
Subsequently, the catalytic activity of UDNP-MC-FeTA and UDNP-MC/Au-FeTA was verified. According to the previous protocol [18,34], H2O2 produced by Au NPs and UDNP-MC/Au-FeTA was detected. The concentration of H2O2 was determined through reducing H2O2 with horseradish peroxidase (HRP) and oxidizing 3,3′,5,5′-tetramethylbenzidine (TMB) from colorless to blue (oxTMB). Then, we detected the absorbance of TMB at 649 nm (Fig. 2a, Figs. S12 and S13 in Supporting information). HRP could effectively prevent the generated •OH from interfering with TMB color development, thereby increasing the reliability of H2O2 concentration detection. Both Au NPs and UDNP-MC/Au-FeTA could generate H2O2 in glucose solutions at neutral and slightly acidic pH, demonstrating the GOD-like property of Au NPs (Figs. 2b and c). As expected, UDNP-MC-FeTA could not produce H2O2 in the glucose solution. Besides, the oxidation of glucose by Au NPs requires the presence of OH− in the aqueous solution, which facilitates the dehydrogenation of the glucose hydroxyl groups [35]. Consequently, at pH 5.0, the catalytic efficacy of Au NPs was found to be diminished. Fortunately, the tendency was observed to be the dissociation of Fe2+ from FeTA and the subsequent Fenton reaction at an acidic condition [24,25], which resulted in the consumption of the generated H2O2. Therefore, the concentration of H2O2 generated by UDNP-MC/Au-FeTA is lower and more likely to converge to the reaction equilibrium than that of free Au NPs. To test the GOD-like properties of Au NPs and the two nanoplatforms, all the samples were dispersed in an aqueous glucose solution and the pH changes were recorded. As shown in Fig. 2d, the pH of the solution gradually decreased as Au NPs catalyze glucose to produce gluconic acid and H2O2. The generation of •OH via Fenton reaction of Fe2+ with H2O2 is crucial for realizing CDT. The methylene blue (MB) dye could be discolored by •OH [36], indicating the production of •OH. Fig. 2e demonstrates that the nanoplatforms caused a slight discoloration of MB and produced trace amounts of •OH at pH 7.4 in the presence of H2O2. However, since the loaded Au NPs could catalyze the production of H2O2 from glucose and decompose FeTA to produce Fe2+ under acidic conditions (pH 5.0), UDNP-MC/Au-FeTA could catalyze the cascade reaction of glucose to generate •OH, which can significantly discolor MB (Fig. 2f). Besides, UDNP-MC-FeTA could also undergo a direct Fenton reaction to produce •OH with H2O2 rather than glucose, which causes significant discoloration of MB. Furthermore, MC 540 could be excited by the UCL of UDNPs at 540 nm to generate 1O2, subsequently realizing PDT. Singlet oxygen sensor green reagent (SOSG) could react with 1O2 to emit green fluorescence, which is used for the detection of 1O2 in solution. As shown in Fig. 2g, both UDNP-MC-FeTA and UDNP-MC/Au-FeTA could generate 1O2 continuously, with the generation rate eventually slowing down under the irradiation of an 808 nm laser. Besides, due to the GOD-like property of Au NPs, UDNP-MC/Au-FeTA with the assistance of H2O2 could generate more 1O2 during the initial stage of 808 nm irradiation. It demonstrates that the generation of ROS via PDT is significantly enhanced with the assistance of Au NPs in the glucose solution. Finally, •OH and 1O2 were trapped with 5,5-dimethyl-1-pyrrolion N-oxide (DMPO) and 2,2,6,6-tetramethyl piperidine (TEMP), respectively [37]. Electron paramagnetic resonance (EPR) spectra show that UDNP-MC/FeTA could produce •OH with H2O2 and generate 1O2 under 808 nm laser irradiation, respectively (Fig. 2h). Whereas UDNP-MC/Au-FeTA could produce •OH directly in glucose solution (Fig. 2i). Therefore, UDNP-MC-FeTA and UDNP-MC/Au-FeTA could achieve synergistic chemo-photodynamic therapy (CDT-PDT) in a slightly acidic TME with high levels of glucose and H2O2.
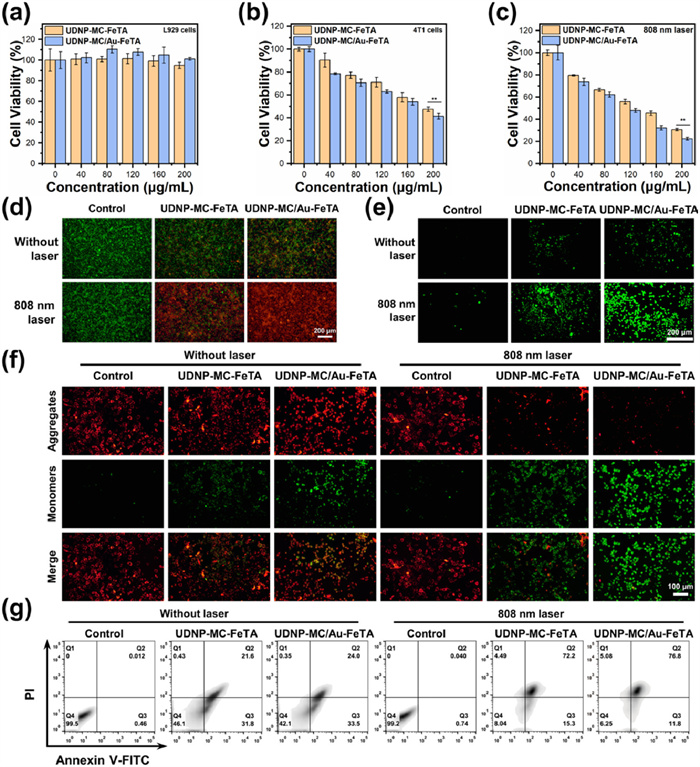
In vitro fluorescence images illustrate that both nanoplatforms could be effectively taken up by breast cancer (4T1) cells within 4 h (Fig. S14 in Supporting information). Then, the in vitro biocompatibility and anti-tumor effect of the nanoplatforms were evaluated by the enhanced cell counting kit-8 (CCK-8) assay. After co-incubating with murine fibroblasts (L929) cells for 24 h, UDNP-MC-FeTA and UDNP-MC/Au-FeTA do not exhibit any significant toxicity, and cell viability could maintain above 90% (Fig. 3a). Whereas, after incubation with 4T1 cells that are slightly acidic and enriched with H2O2 and glucose, the nanoplatforms demonstrate excellent CDT effect (Fig. 3b). At high concentration (200 µg/mL), UDNP-MC/Au-FeTA exhibits more cytotoxicity to 4T1 cells than UDNP-MC-FeTA, attributing to the consumption of glucose by Au NPs and the exacerbation of H2O2 production, which accelerates the Fenton reaction and the generation of •OH. Both nanoplatforms exhibit the PDT effect under the irradiation of 808 nm laser (1 W/cm2, 10 min). As shown in Fig. 3c, the viability of 4T1 cells was <30% after receiving synergistic dual-dynamic therapy, demonstrating effective inhibition effects on tumor cells and in vivo therapeutic potential of UDNP-MC/Au-FeTA. After calcein AM and propidium iodide (PI) staining, the vast majority of 4T1 cells died and fluoresced red after synergistic treatment, especially in UDNP-MC/Au-FeTA group, which is consistent with CCK-8 assay results (Fig. 3d). To validate the relationship and evidence of cell death and dynamic therapy, 2′,7′-dichlorodihydrofluorescein diacetate (DCFH-DA) was used to detect the generation of intracellular ROS, which is indicated by restored green fluorescence. As shown in Fig. 3e, •OH generated through the Fenton reaction could be detected, then there is a significant increase in the total amount of ROS (•OH and 1O2) after 808 nm irradiation. It indicates that synergistic dual-dynamic effects could generate a considerable amount of ROS in a relatively short period. With the assistance of Au NPs, UDNP-MC/Au-FeTA could facilitate the generation of intracellular ROS to a greater extent than that of UDNP-MC-FeTA. Furthermore, the accumulation of ROS in tumor cells could result in oxidative stress and the initiation of apoptosis. The mitochondrial membrane potential probe (JC-1) is converted from J-aggregates (red fluorescence) to monomers (green fluorescence) following tumor cell apoptosis by ROS, which results in a decrease in the mitochondrial membrane potential (ΔΨm) of the cell. Dual-dynamic therapy results in a greater reduction of ΔΨm compared with CDT alone (Fig. 3f). Besides, Au NPs could enhance the initiation of apoptosis. To confirm the onset of apoptosis, 4T1 cells were stained with Annexin V-fluorescein isothiocyanate (FITC) and PI and analyzed by flow cytometry. Late apoptosis (Q2) was observed in nearly 25% of the cells treated with CDT alone. After 808 nm laser irradiation (1 W/cm2, 10 min), the proportions of late apoptosis (Q2) in UDNP-MC-FeTA and UDNP-MC/Au-FeTA groups increase to 72.2% and 76.8%, respectively (Fig. 3g). This indicates that UDNP-MC/Au-FeTA could generate more ROS and induce more apoptosis of 4T1 cells. Besides, when the laser is applied, the cells incubated with the nanoplatforms undergo a transition from early apoptosis (Q3) to late apoptosis (Q2).
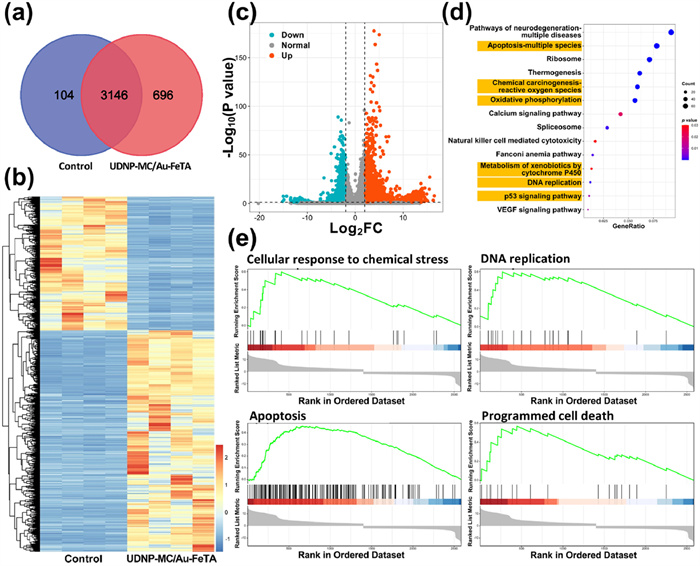
To investigate the transcriptome alterations of 4T1 cells following synergistic dual-dynamic therapy with UDNP-MC/Au-FeTA, RNA sequencing was analyzed. The Venn diagram shows that both UDNP-MC/Au-FeTA and the control group expressed 3146 transcripts in cells (Fig. 4a). The heat map and volcano plot illustrate that there are 3947 differentially expressed genes (DEGs) after synergistic CDT-PDT compared with the control group (Figs. 4b and c). Fig. 4c reveals that 2461 DEGs were significantly up-regulated and 1486 DEGs were down-regulated after treatment with UDNP-MC/Au-FeTA (the cutoff set at PFDR < 0.05 and |log2 FC| > 2). The Kyoto encyclopedia of genes and genomes (KEGG) is a complete database on biological expression relationships, integrating genomic, chemical, and functional information. As shown in Fig. 4d, the KEGG pathway enrichment analysis reveals that these DEGs are associated with several pathways, including apoptosis, ROS, oxidative phosphorylation, cytochrome P450, DNA replication, and p53 signaling pathway [38–40]. These are the typical signaling pathways for apoptosis caused by ROS, which demonstrates that UDNP-MC/Au-FeTA triggers apoptosis by causing oxidative phosphorylation through intracellular ROS accumulation. Moreover, to investigate the expression of the enriched pathways more intuitively, gene set enrichment analysis (GSEA) could analyze the effect of the differential gene sets of the UDNP-MC/Au-FeTA group on the signaling pathways. After synergistic CDT-PDT, cellular response of chemical stress, DNA replication, apoptosis, and programmed cell death were positively regulated (Fig. 4e). Transcriptome analysis revealed the apoptotic mechanism of synergistic dual-dynamic therapy of tumor cells with UDNP-MC/Au-FeTA, demonstrating the reliability of UDNP-MC/Au-FeTA as a nanotherapeutic platform.
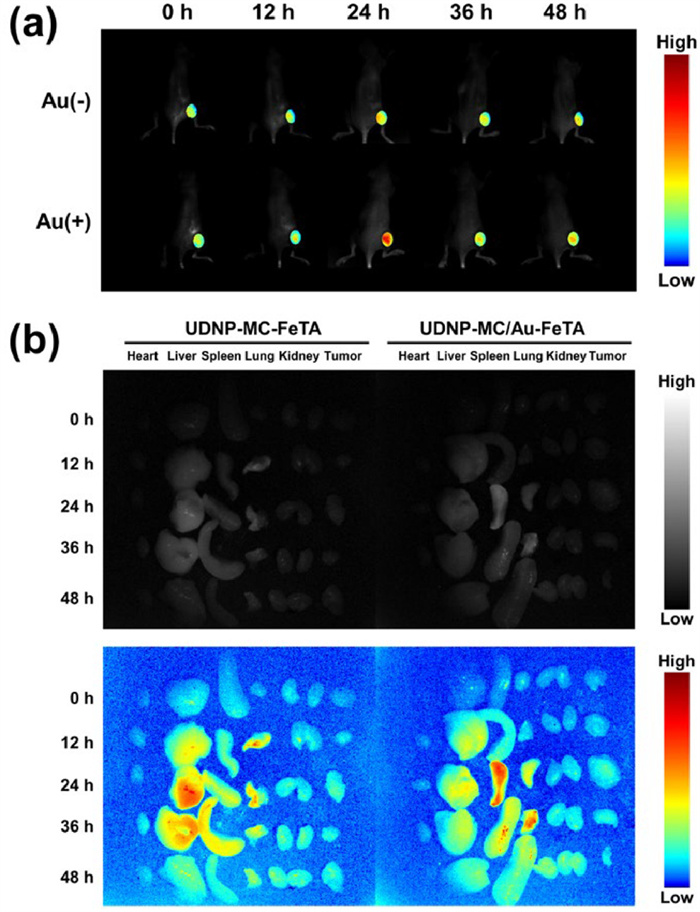
The hemolysis of both UDNP-MC-FeTA and UDNP-MC/Au-FeTA was <1% at the concentrations of 0–200 µg/mL, manifesting the biosafety and biocompatibility of nanoplatforms (Fig. S15 in Supporting information). Subsequently, the biodistribution of nanoplatforms in major organs and tumors following different injection time was investigated through NIR-Ⅱ fluorescence imaging. 4T1 subcutaneous tumor models were constructed in the right buttocks of the BALB/c mice. All animal study protocols were approved by the Animal Care and Use Committee of Changchun Institute of Applied Chemistry (No. 20230065). The mice were injected intravenously (i.v. via tail vein) with UDNP-MC-FeTA or UDNP-MC/Au-FeTA. As shown in Fig. 5a and Fig. S16 (Supporting information), under 808 nm irradiation, the NIR-Ⅱ fluorescence signal was strongest in the tumor region (computerized pseudo-color section) after 24 h injection. After that, the NIR-Ⅱ fluorescence signal gradually weakened with metabolism in vivo. The mice that had been subjected to different injection time were euthanized, and major organs and tumor tissues were dissected out. The nanoplatforms tended to accumulate in the liver, spleen, and lungs after i.v. injection (Fig. 5b). This is because the liver detoxifies blood, the spleen stores blood, and the lungs have numerous capillaries that facilitate the accumulation and enrichment of nanoplatforms. It is worth noting that the NIR-Ⅱ fluorescence signals weakened as the time of in vivo circulation and metabolism increased, indicating that the nanoplatforms in the organs were gradually metabolized. Therefore, UDNP-MC-FeTA and UDNP-MC/Au-FeTA could act as biosafe NIR-Ⅱ fluorescence imaging contrast agents for in vivo imaging diagnosis of tumors.
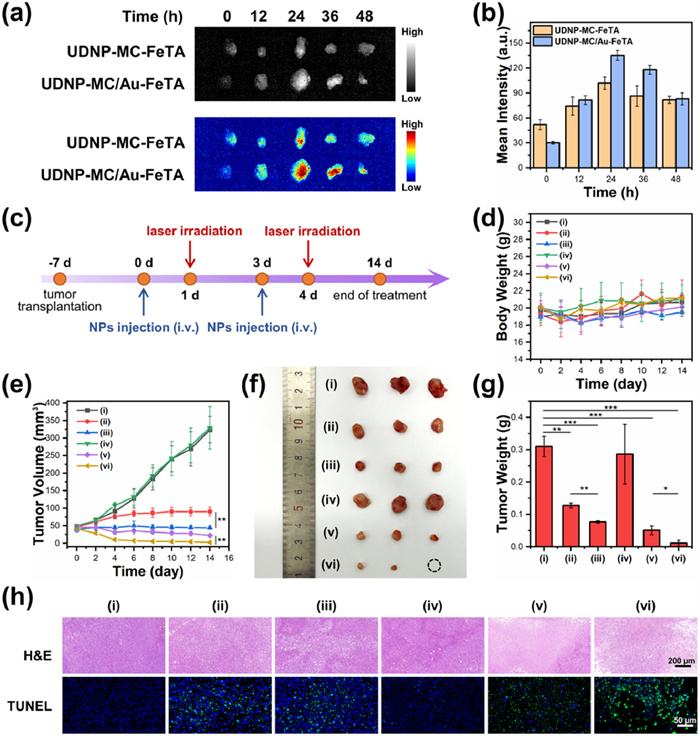
In order to accurately assess accumulation of nanoplatforms in tumor, isolated tumors after i.v. injection for different time were subjected to NIR-Ⅱ fluorescence imaging (Fig. 6a). Fig. 6b shows that the highest accumulation of nanoplatforms in tumor tissue occurred 24 h after injection through quantitative comparison, which is consistent with the in vivo fluorescence imaging results. Therefore, we conducted PDT with 808 nm laser irradiation 24 h after injection of the nanoplatforms (Fig. 6c). When the volume of 4T1 tumor grown to ~50 mm3, we randomly divided the mice into six groups, including (ⅰ) phosphate buffered saline (PBS, as the control group), (ⅱ) UDNP-MC-FeTA, (ⅲ) UDNP-MC/Au-FeTA, (ⅳ) PBS + 808 nm laser, (ⅴ) UDNP-MC-FeTA + 808 nm laser, and (ⅵ) UDNP-MC/Au-FeTA + 808 nm laser. The mice of (ⅱ) and (ⅲ) groups received only CDT, while those of (ⅴ) and (ⅵ) groups were treated by synergistic CDT-PDT. There was no significant difference in the body weight of the mice throughout the treatment cycle, demonstrating that synergistic CDT-PDT has no significant side effects on the vital activities of the mice (Fig. 6d). During the treatment, the growth of tumor volume was effectively suppressed, and a gradual reduction in tumor volume could be observed in the dual-dynamic therapy groups (v and vi groups, as shown in Fig. 6e). In comparison to single CDT, a considerable quantity of ROS could be produced in a relatively brief period under synergistic CDT-PDT, resulting in the death of tumor cells and the effective inhibition of in situ glucose consumption and H2O2 accumulation. After 14-day treatment, the growth of tumors in dual-dynamic therapy groups was effectively inhibited compared with the control group (Figs. 6f and g). The therapeutic effect of the group receiving synergistic dual-dynamic treatment with Au-catalytic effect (UDNP-MC/Au-FeTA + 808 nm laser) was the most effective, due to the consumption of glucose by Au NPs and the subsequent production of H2O2 in tumor tissues. Au NPs could alleviate hypoxia in tumor tissues and promote the Fenton reaction, thereby enhancing the effect of dual-dynamic therapy. Then, the paraffin slices of the main organs and tumor tissues were stained by hematoxylin and eosin (H&E). The cellular morphology of major organs shows no significant difference between the experimental groups and the control group (Fig. S17 in Supporting information). However, the tumor tissues in CDT and CDT-PDT groups become relatively sparse and the cells lose their original morphology (Fig. 6h). TdT-mediated dUTP nick end labeling (TUNEL) stains the 3′ end residues of DNA produced by apoptosis. TUNEL slices reveal a higher incidence of apoptosis in the tumor tissues in UDNP-MC-FeTA or UDNP-MC/Au-FeTA involved groups (ⅱ, ⅲ, ⅴ, and ⅵ groups), particularly in the Au-reinforced synergistic dual-dynamic therapy group (UDNP-MC/Au-FeTA + 808 nm laser). Furthermore, after the i.v. injection with the nanoplatforms for 28 days, the blood examinations of the mice show that there are no significant toxic or side effects on blood routine, liver function, and kidney function (Figs. S18 and S19 in Supporting information). Therefore, UDNP-MC/Au-FeTA is a biosafe and functional nanoplatform for diagnosis and treatment integration in long terms.
In summary, we construct an Au-catalyzed lanthanide co-doped nanoplatform (UDNP-MC/Au-FeTA) capable of achieving NIR-Ⅱ fluorescence imaging and synergistic dual-dynamic therapy through simultaneous upconversion-downshifting luminescence under 808 nm laser irradiation. UDNPs co-doped with Ho3+ and Er3+ could emit dual-wavelength DSL for NIR-Ⅱ fluorescence imaging. While UCL of UDNPs could activate MC 540 to generate ROS for PDT. UDNP-MC/Au-FeTA could respond to the slightly acidic TME and produce •OH, thus achieving CDT. Additionally, Au NPs could consume glucose and accumulate H2O2 to accelerate photosensitizer activation and the Fenton reaction, enhancing the PDT and CDT effects. Consequently, UDNP-MC/Au-FeTA is able to generate a large number of ROS and implement effective dual-dynamic therapy of tumor with the guidance of NIR-Ⅱ fluorescence imaging. Overall, UDNP-MC/Au-FeTA could realize synergistic CDT-PDT of tumor by simultaneous UCL and DSL, as well as catalytic amplification of Au NPs, suggesting its potential anti-tumor application prospect.
The authors declare that they have no known competing financial interests or personal relationships that could have appeared to influence the work reported in this paper.
Ruohao Zhang: Writing – original draft, Visualization, Methodology, Investigation, Data curation, Conceptualization. Yifei Zhou: Validation, Methodology, Formal analysis, Conceptualization. Yu Lu: Methodology, Formal analysis. Xudong Sun: Validation, Investigation. Jitong Gong: Validation, Formal analysis. Kehong Lv: Methodology, Formal analysis. Xinyu Fu: Visualization. Yukai Cheng: Formal analysis. Jing Feng: Writing – review & editing, Supervision, Resources, Funding acquisition. Hongjie Zhang: Writing – review & editing, Supervision, Resources, Project administration, Funding acquisition.
This work was financially supported by the National Key Research and Development Program of China (Nos. 2022YFB3503700 and 2021YFF0701800), Basic Science Center Project of the National Natural Science Foundation of China (No. 22388101), the National Natural Science Foundation of China (No. 22020102003), and Jilin Province Science and Technology Development Plan Project (Nos. 20220101063JC and 20240601050RC).
Supplementary material associated with this article can be found, in the online version, at doi:
Y. Dang, J. Bai, K. Lou, et al., Adv. Funct. Mater. 34 (2024) 2311673. doi: 10.1002/adfm.202311673
S. Juengpanich, S. Li, T. Yang, et al., Nat. Commun. 14 (2023) 5699. doi: 10.1038/s41467-023-41389-1
L. Tong, J. Cao, K. Wang, et al., Adv. Opt. Mater. 12 (2023) 2301767.
Y. Zhou, R. Zhang, Y. Lu, et al., Adv. Funct. Mater. (2024) 2312416.
W. Zhou, Y. Gao, X. Feng, et al., Chin. Chem. Lett. 36 (2025) 109763. doi: 10.1016/j.cclet.2024.109763
B. Liu, C. Li, P. Yang, et al., Adv. Mater. 29 (2017) 1605434. doi: 10.1002/adma.201605434
Y. Yang, Y. Chen, P. Pei, et al., Nat. Nanotechnol. 18 (2023) 1195–1204. doi: 10.1038/s41565-023-01422-2
M. Zhang, B. Wang, Y. Cai, et al., Nano Lett. 24 (2024) 4877–4884.
Z. Gao, X. Zheng, W. Liu, et al., Chin. Chem. Lett. 36 (2025) 109874. doi: 10.1016/j.cclet.2024.109874
R. Deng, F. Qin, R. Chen, et al., Nat. Nanotechnol. 10 (2015) 237–242. doi: 10.1038/nnano.2014.317
H. Zhao, Y. Li, X. Zhang, et al., Biomaterials 291 (2022) 121873. doi: 10.1016/j.biomaterials.2022.121873
B. Zhou, L. Yan, J. Huang, et al., Nat. Photonics 14 (2020) 760–766. doi: 10.1038/s41566-020-00714-6
X. Li, D. Shen, J. Yang, et al., Chem. Mater. 25 (2012) 106–112.
M.B. Liisberg, S. Lahtinen, A.B. Sloth, et al., J. Am. Chem. Soc. 143 (2021) 19399–19405. doi: 10.1021/jacs.1c07691
T. Grzyb, I.R. Martin, R. Popescu, Nanoscale 16 (2024) 1692–1702. doi: 10.1039/d3nr04418a
Q. Xiao, B. Liu, C. Song, et al., Ceram. Int. 50 (2024) 6154–6164. doi: 10.1016/j.ceramint.2023.11.327
D. Liu, Y. Li, H. Zhang, et al., Chin. Chem. Lett. 36 (2025) 109910. doi: 10.1016/j.cclet.2024.109910
J. Chen, Q. Ma, M. Li, et al., Nat. Commun. 12 (2021) 3375. doi: 10.1038/s41467-021-23737-1
X.T. Hou, T.A. Xie, M.Y. Han, et al., Mater. Des. 239 (2024) 112780. doi: 10.1016/j.matdes.2024.112780
Y. Cheng, Y.D. Xia, Y.Q. Sun, et al., Adv. Mater. 36 (2024) 2308033. doi: 10.1002/adma.202308033
X. Zhang, Y. Lin, R.J. Gillies, J. Nucl. Med. 51 (2010) 1167–1170. doi: 10.2967/jnumed.109.068981
F. Li, Z. Pei, S. Chen, et al., Chin. Chem. Lett. 35 (2024) 108752. doi: 10.1016/j.cclet.2023.108752
D. Cen, Q. Zheng, B. Zheng, et al., Adv. Funct. Mater. 33 (2023) 2211402. doi: 10.1002/adfm.202211402
H. Lin, Y. Chen, J. Shi, Chem. Soc. Rev. 47 (2018) 1938–1958. doi: 10.1039/c7cs00471k
G. Torrieri, M.P.A. Ferreira, M.A. Shahbazi, et al., Adv. Funct. Mater. 32 (2022) 2109032. doi: 10.1002/adfm.202109032
Y. Qiu, X. Guo, C. Zhang, et al., ACS Appl. Bio Mater. 6 (2023) 2394–2403. doi: 10.1021/acsabm.3c00212
M. Yang, H. Wang, Z. Wang, et al., Biomater. Sci. 7 (2019) 1686–1695. doi: 10.1039/c8bm01570h
Y. Fan, P. Wang, Y. Lu, et al., Nat. Nanotechnol. 13 (2018) 941–946. doi: 10.1038/s41565-018-0221-0
J.A. Carr, M. Aellen, D. Franke, et al., Proc. Natl. Acad. Sci. U. S. A. 115 (2018) 9080–9085. doi: 10.1073/pnas.1803210115
C. Chen, F. Wang, S. Wen, et al., Nat. Commun. 9 (2018) 3290. doi: 10.1038/s41467-018-05842-w
C. Li, G. Chen, Y. Zhang, et al., J. Am. Chem. Soc. 142 (2020) 14789–14804. doi: 10.1021/jacs.0c07022
Y. Zhan, R. Zhang, Y. Guo, et al., J. Mater. Chem. B 11 (2023) 755–771. doi: 10.1039/d2tb02017c
B. Kumar, K. Malhotra, R. Fuku, et al., TrAC Trends Anal. Chem. 139 (2021) 116256. doi: 10.1016/j.trac.2021.116256
X. Zhang, Q. Yang, Y. Lang, et al., Anal. Chem. 92 (2020) 12400–12406. doi: 10.1021/acs.analchem.0c02149
Y. Zhao, Y. Huang, H. Zhu, et al., J. Am. Chem. Soc. 138 (2016) 16645–16654. doi: 10.1021/jacs.6b07590
N. Liu, G. Sun, Dyes Pigm. 91 (2011) 215–224. doi: 10.1016/j.dyepig.2011.03.018
M.P. Murphy, H. Bayir, V. Belousov, et al., Nat. Metab. 4 (2022) 651–662. doi: 10.1038/s42255-022-00591-z
L. Jiang, N. Kon, T. Li, et al., Nature 520 (2015) 57–62. doi: 10.1038/nature14344
Q. Pan, F. Lin, R. Liu, et al., Chem. Eng. J. 466 (2023) 142962. doi: 10.1016/j.cej.2023.142962
W. Liu, R. Shao, L. Guo, et al., Adv. Sci. 11 (2024) 2304046. doi: 10.1002/advs.202304046

Scheme 1 Schematic depiction of UDNP-MC/Au-FeTA for NIR-Ⅱ fluorescence imaging and synergistic CDT-PDT of tumor.

Figure 1 (a) Schematic illustration of the synthesis of UDNP-MC/Au-FeTA. (b) TEM image, (c) XRD patterns, and (d) PL spectra of UDNPs. The PL spectra were measured under 808 nm laser irradiation. (e) TEM, (f) HAADF-STEM images, and elemental mappings of UDNP-MC/Au-FeTA. (g) Zeta potential of UDNP-MC-FeTA, UDNP-MC/Au-FeTA, and intermediate step products. Data are presented as mean ± standard deviation (SD) (n = 3). (h) UV–vis-NIR absorption spectra of Au NPs, MC 540, UDNP-MC-FeTA, and UDNP-MC/Au-FeTA. (ⅰ) DSL spectra and NIR-Ⅱ fluorescence imaging photograph (inset) of UDNP-MC-FeTA (Au-) and UDNP-MC/Au-FeTA (Au+) under 808 nm laser irradiation.

Figure 2 (a) Schematic diagram of H2O2 detection mechanism. The concentration of H2O2 produced by UDNP-MC-FeTA, UDNP-MC/Au-FeTA, and Au NPs in buffer solutions of glucose (5 mmol/L) at (b) pH 7.4 and (c) pH 5.0. **P < 0.01, ***P < 0.001. N.S. refers to no signification. (d) pH of Au NPs, UDNP-MC-FeTA, and UDNP-MC/Au-FeTA in aqueous solution. The absorption spectra of MB were measured after 4 h in buffer solutions with (e) pH 7.4 and (f) pH 5.0. (ⅰ)–(vii) are denoted as control, glucose, H2O2, UDNP-MC-FeTA, UDNP-MC/Au-FeTA, UDNP-MC-FeTA + H2O2, and UDNP-MC/Au-FeTA + glucose groups, respectively. (g) The ability of the nanoplatforms to generate 1O2 in glucose (5 mmol/L, solid lines) or aqueous (dotted lines) solutions under 808 nm laser irradiation. EPR spectra of (h) UDNP-MC-FeTA and (ⅰ) UDNP-MC/Au-FeTA to detect the generation of •OH and 1O2.

Figure 3 (a) The cytotoxicity of nanoplatforms at different concentrations on L929 cells. Cell viability of 4T1 after (b) CDT and (c) synergistic CDT-PDT under 808 nm laser irradiation (1 W/cm2, 10 min). **P < 0.01, mean ± SD (n = 5). Fluorescence images of 4T1 cells stained with (d) calcein-AM (live cells, green)/PI (dead cells, red), (e) DCFH-DA (green, ROS), and (f) JC-1 (mitochondrial membrane potential) after incubating with 200 µg/mL of UDNP-MC-FeTA and UDNP-MC/Au-FeTA with/without 808 nm irradiation (1 W/cm2, 10 min). (g) 4T1 cells stained with Annexin V-FITC/PI for flow cytometry analysis.

Figure 4 (a) Venn diagram of expressed transcripts. (b) The heat map and (c) volcano plot of differentially expressed genes between the 4T1 cells of control and UDNP-MC/Au-FeTA group (PFalse Discovery Rate< 0.05, |log2 Fold Change| > 2). (d) KEGG pathway enrichment analysis of DEGs after UDNP-MC/Au-FeTA treatment. (e) GSEA enrichment analysis of DEGs centralized in cellular response to chemical stress, DNA replication, apoptosis, and programmed cell death.

Figure 5 (a) NIR-Ⅱ fluorescence imaging in vivo and computerized pseudo-color tumors at different time after i.v. injections with UDNP-MC-FeTA and UDNP-MC/Au-FeTA. (b) The biodistributions of UDNP-MC-FeTA and UDNP-MC/Au-FeTA in main organs (heart, liver, spleen, lung, and kidney) and tumor tissues through NIR-Ⅱ fluorescence imaging. All were taken under 808 nm laser irradiation.

Figure 6 (a) The accumulations (NIR-Ⅱ fluorescence imaging photo and pseudo color) and (b) quantitative analysis of UDNP-MC-FeTA and UDNP-MC/Au-FeTA in tumors at different time. (c) Schematic illustration of the antitumor treatment process in vivo. (d) Body weight and (e) tumor volume of mice in different treatment groups within 14 days. The (f) digital photo and (g) weight of tumors after 14-day treatment. P < 0.05, **P < 0.01, ***P < 0.001, mean ± SD (n = 3). (h) H&E and TUNEL staining slices of tumors after 14-day treatment. (ⅰ)–(ⅵ) are denoted as PBS, UDNP-MC-FeTA, UDNP-MC/Au-FeTA, PBS + 808 nm laser, UDNP-MC-FeTA + 808 nm laser, and UDNP-MC/Au-FeTA + 808 nm laser groups, respectively.

 扫一扫看文章

扫一扫关注我们
 DownLoad:
 下载:
下载:
 下载:
下载: