Figure 1.
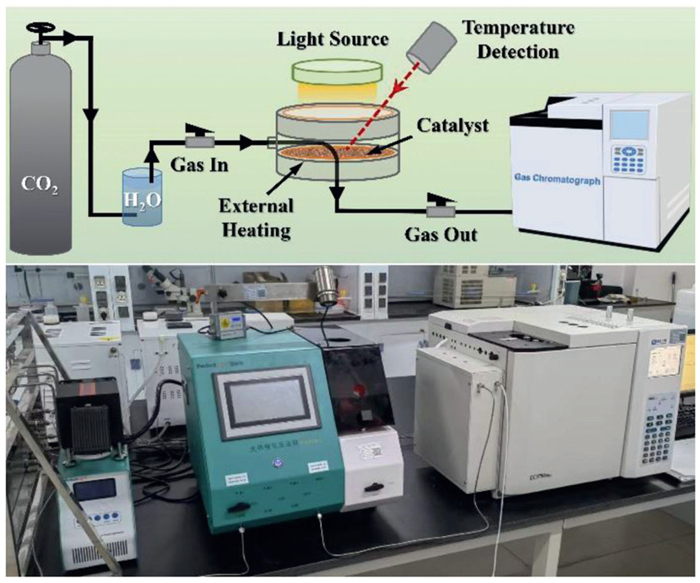
The scheme and the photographs of the continuous flow fixed bed reactor for the thermo-photocatalytic CO2 conversion.
Thermo-photocatalytic CO2 conversion with H2O to C2 products in a continuous process by ZIF-67/biochar composites
Xia Jiang , Yan-Xin Chen , Rui Chen , Hao-Yan Shi , Ke-Xian Li , Wen-Ya Zhong , Jian-Feng Li , Can-Zhong Lu

The human and environmental risks posed by climate change necessitate a transition from the current fossil fuel-based economy to one grounded in renewable and carbon-neutral energy technologies. The urgency of reducing emissions of major greenhouse gases (CO2) and continuing to fuel a growing global population is one of the most significant technological challenges of our time. The direct conversion of CO2 into C2 products presents a promising strategy for establishing a sustainable, carbon-neutral economy and has emerged as a frontier research area in the global chemical industry. Currently, CO2-to-C2 product conversion is primarily achieved through thermal catalysis [1–3], photocatalysis [4–7], and electrocatalysis [8,9]. Among the various CO2 conversion methods, the one driven by both light and heat has attracted researchers' interest. This approach addresses the high pollution and energy consumption inherent in thermal catalysis by lowering the reaction's activation energy barrier and circumventing thermodynamic limitations. Simultaneously, it overcomes photocatalysis bottlenecks—such as low catalytic efficiency and restricted energy/mass transfer—by supplying energy to surmount activation barriers and resolve kinetic limitations. As an integrated system, this catalytic strategy exhibits synergistic effects surpassing the sum of its individual components and has been validated as a highly effective and promising approach for driving chemical transformations [10].
In recent studies, H2 and H2O have emerged as the primary proton sources for thermo-photocatalytic CO2 reduction. Compared with H2, H2O is a more ideal proton source because it is cheap and abundant. However, most reported thermo-photocatalytic CO2 conversion systems using H2O as a proton source employ batch processes, primarily due to their higher production efficiency compared to continuous processes. However, continuous processes are more desirable for enhancing catalytic performance, improving product quality, and enabling commercial large-scale industrial applications. Continuous operation enables fine regulation of reaction conditions, minimizes byproduct formation, increases CO2 processing capacity, and enhances product quality and catalyst stability. Notably, however, only a limited number of studies on thermo-photocatalytic CO2 conversion with H2O as the proton source have implemented continuous processes. In 2019, Dai et al. obtained a high CH4 yield (60 µmol g-1 h-1) by using Cu/TiO2 modified with C quantum dots at a flow rate of 5 mL min-1 under ultraviolet irradiation and 250 ℃ heating for the first time [11]. Liu et al. doped Cu into metal halide perovskite. They obtained a relatively high CH4 yield (14.72 ± 0.60 µmol g-1 h-1) and selectivity (96.9%) under the condition of 300 mW/cm2 light intensity, 5.8 mL/min flow rate, and 300 ℃ heating [12]. The above work has made a pioneering contribution to the thermo-photocatalytic CO2 conversion by the continuous process. But, compared with H2 as a proton source, the reaction velocity (< 10 mL/min) is small, and no high-value C2 products have been reported.
Enhancing the adsorption and activation of catalysts towards CO2 and H2O, broadening the light absorption spectrum, constructing appropriate local charge density gradients and binding strengths of intermediate states (*CO), and reducing the activation energy barriers for the formation of critical intermediates of C2 products is crucial for the acquisition of C2 products under high reaction rates. Specifically, high yields and selectivity of C2 can be achieved by adjusting the surface functional groups of the catalyst, constructing vacancies (O, C, N, and S), and employing multimetallic catalysts. Compared with batch mode, continuous operation reduces feed gas residence time on the catalyst surface. Enhancing catalyst-mediated activation of feed gases represents a critical strategy for achieving efficient thermo-photocatalytic conversion of CO2 to C2 products in continuous fixed-bed reactors.
Oxygen vacancies/defects exhibit strong oxygen affinity and demonstrate robust interactions with CO2 and H2O, lowering the activation energy barriers for CO2 and H2O activation. Strategies for constructing oxygen vacancies/defects in metal oxide catalysts include adjusting annealing temperature during synthesis, plasma etching, liquid exfoliation, laser ablation, heterojunction interface engineering, dopant incorporation, and photoexcitation. However, most vacancy-formation conditions necessitate additional energy input [13]. The large-scale application of biochar-based functional materials is considered a sustainable process because it not only catalyzes CO2 conversion but also reduces anthropogenic CO2 emissions by converting waste biomass into biochar [14]. Utilizing the reducibility of biochar, its compositing with oxygen-containing materials can provide the material with more oxygen vacancies. Moreover, biochar contains numerous heteroatoms and inorganic components [7], which can alter the surface charge density of the material. At the same time, carbon-related defects play a positive role in the adsorption of CO2. Additionally, metal-organic framework (MOF) materials are promising candidates for CO2 conversion, owing to their tunable composition and structure, high specific surface area, strong CO2 affinity, and modifiable surface properties. MOFs exhibit remarkable flexibility in integrating multiple functionalities, including active catalytic sites, adsorption capabilities, and light-responsive properties. This further gives them great possibilities for converting CO2 into valuable products by thermal catalysis, electrocatalysis, and photocatalysis methods [15–19].
Herein, a composite material of peanut-shell carbon (PC) and zeolitic imidazolate framework-67 (ZIF-67) was used in a fixed bed reactor with a continuous process, in which the H2O was used as a reducing agent to catalyze the conversion of CO2 to C2 products (Fig. 1). The structure and photoelectrochemical properties of the composites were characterized. The catalytic properties at different temperatures, pressures, and batch processes were investigated. In addition, the structure-activity relationship of catalysts was also studied.
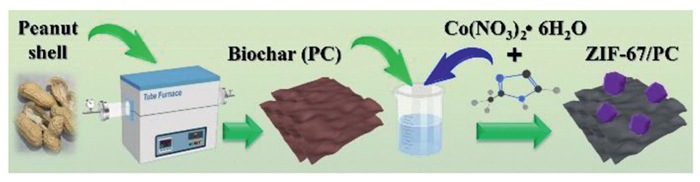
The obtained biochar (PC) derived from peanut shells was added to the precursor of the preparation of ZIF-67, and the composite material was prepared at room temperature (Fig. 2 and Fig. S1 in Supporting information).
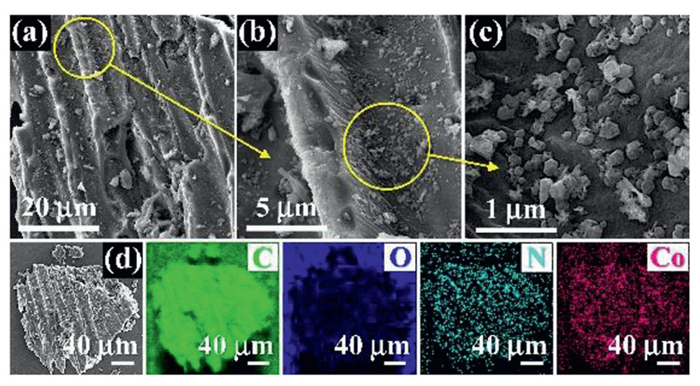
The scanning electron microscope (SEM) shows that the obtained PC is a sheet material with folds on the surface (Fig. S2 in Supporting information). After the composite, ZIF-67 is relatively evenly distributed on the PC with a dodecahedral configuration and about 50–100 nm particle size (Figs. 3a-c). The energy-dispersive spectroscopy (EDS) mapping results showed that the main elements C, N, O, and Co were uniformly dispersed in the composites (Fig. 3d). TEM results further confirmed the configuration and particle size of ZIF-67 in the composites (Fig. S3 in Supporting information).
X-ray diffraction (XRD) is used to verify the successful preparation of PC and ZIF-67 composite material (ZIF-67/PC). It can be seen from Fig. 4a that, compared with PC and ZIF-67, the composite material has more obvious characteristic peaks of biochar at 24.0° and 43.0° [20]. The characteristic peaks of ZIF-67 appear at 7.5°, 10.5°, 12.9°, and 18.2°, corresponding to crystal planes of (011), (002), (112), and (222), respectively [21]. In addition, the FTIR results (Fig. 4b) show that ZIF-67/PC has three more peaks than PC, respectively belonging to γ imidazole ring (685 cm-1), γ imidazole ring (753 cm-1), and υ imidazole ring (1375 cm-1) [22], confirming the combination of PC and ZIF-67. Its position is slightly different from the peak position of ZIF-67, indicating a specific interaction between PC and ZIF-67 in the composite material. The peak at 1056 cm-1 is attributed to C—O stretching vibration [20,23], confirming that PC and ZIF-67/PC have oxygen-containing species. The specific surface area of the material was obtained by N2 adsorption and desorption test, and the pore size distribution was acquired by the DFT method. The results are shown in Fig. 4c and Table S1 (Supporting information).
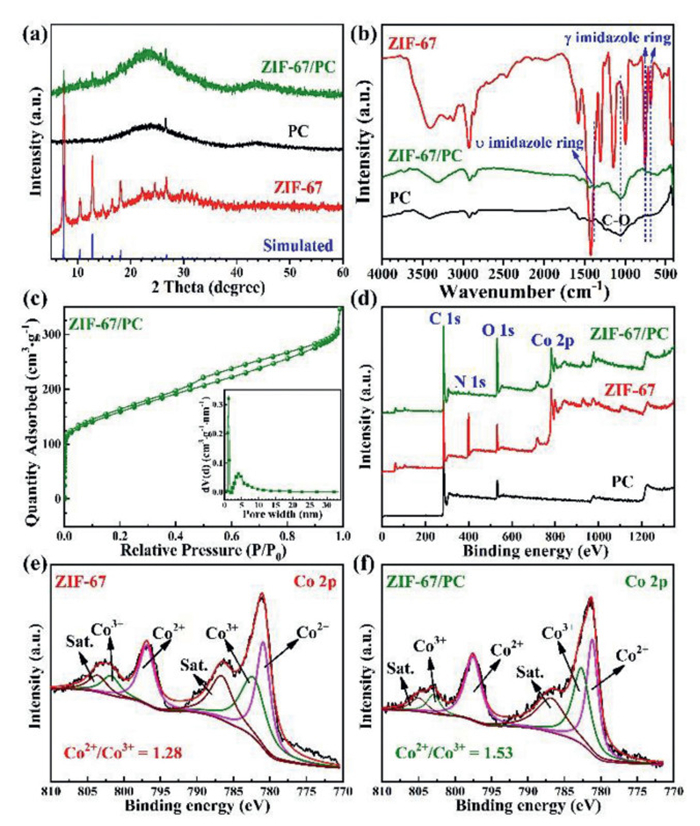
The specific surface area of ZIF-67/PC is about 559.4 m2/g, and it is a hierarchical porous material composed of micropores and mesopores. The XPS results (Figs. 4d-f) further confirm the existence of C, N, O, and Co elements, where the content of N and Co is 1.84 and 2.02 at%, respectively. Moreover, the high-resolution Co 2p spectrum of ZIF-67/PC showed six peaks, corresponding to twin peaks for the Co2+ (797.5 and 781.2 eV) and Co3+ (802.9 and 782.7 eV) species, as well as two satellite peaks at 805.0 and 786.8 eV, respectively [24]. The content of Co2+ as the active center for CO2 conversion [22] in ZIF-67/PC (60.5%) is higher than that in ZIF-67 (56.2%), which is related to the reducibility of biochar materials.
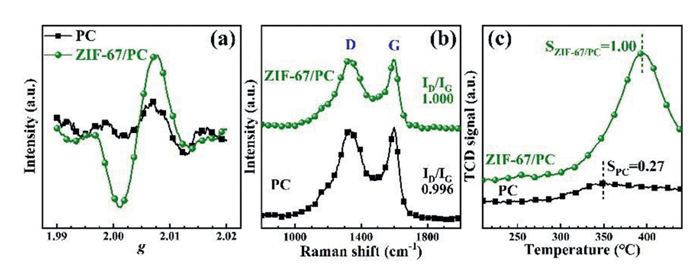
In addition, the defects of the samples were characterized by electron spin resonance (ESR) and Raman spectroscopy (Figs. 5a and b). The strong signal at g = 2.003 in the ESR result and the larger ID/IG value of ZIF-67/PC in Raman indicate that combining ZIF-67 with PC can improve the surface defects of PC. Since carbon-related defects positively affect CO2 adsorption [23], ZIF-67/PC with more defects may be more conducive to catalytic reaction. The CO2 temperature programmed desorption (CO2-TPD) was used to estimate the adsorption of CO2 roughly. The amount of CO2 adsorption could be inferred as the integrated areas of the TPD curves. As shown in Fig. 5c, the adsorption capacity of ZIF-67/PC (STPD = 0.997 mmol/g) is higher than PC (STPD = 0.266 mmol/g), indicating that there are more sites on ZIF-67/PC for CO2 adsorption and activation, which is consistent with Raman and ESR results. A quantitative analysis (Table S2 in Supporting information) using ESR was also conducted, which indicated that there are indeed numerous defects present in ZIF-67/PC.
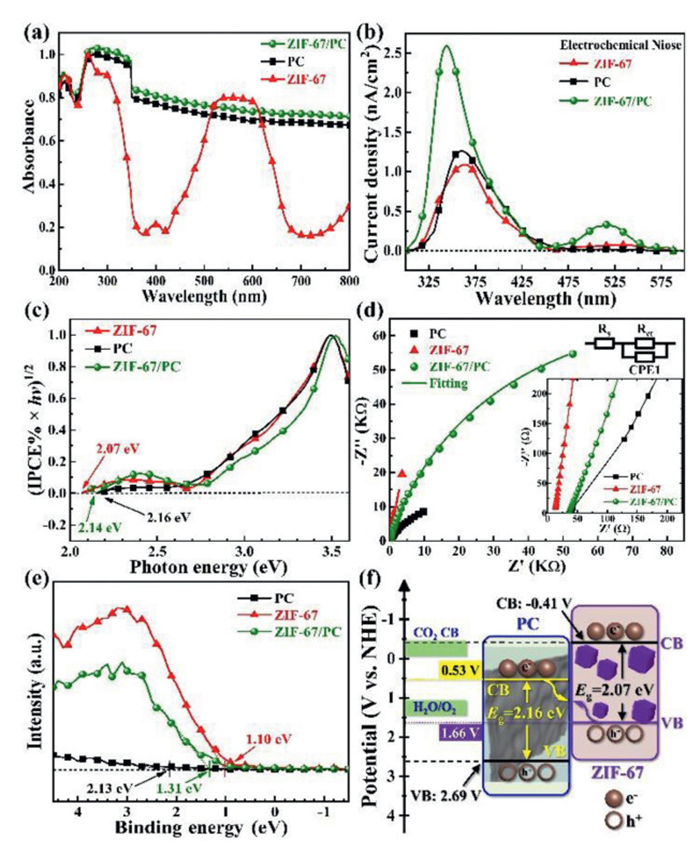
The light absorption of the samples was also analyzed, and the results of UV–vis DRS (Fig. 6a) showed that the three materials had a specific absorption of visible light. The photocurrent density of the materials under monochromatic light was tested, and the results showed that compared with PC and ZIF-67, the composite materials had a stronger absorption at 400–600 nm (Fig. 6b). Besides, it can be seen from the M-S curve (Fig. S4 in Supporting information) that the obtained materials are n-type semiconductors. The band gap derived from IPCE spectra of PC, ZIF-67, and ZIF-67/PC are 2.16, 2.07, and 2.14 eV, respectively (Fig. 6c). These results indicate that the light absorption range of biochar materials can be widened by combining biochar materials with ZIF-67. In addition, we investigated the material's electrical conductivity, and it can be seen from the EIS diagram (Fig. 6d) that the electrical conductivity of ZIF-67 can be improved after being combined with PC [25]. We fitted the obtained EIS diagram to get an equivalent circuit diagram. The inset in Fig. 6d is an enlarged view of the high-frequency region. The impedance parameters of fitted equivalent circuits are shown in Table S3. What is more, the band structure of ZIF-67/PC (Fig. 6f) was investigated by using the XPS valence band spectrum (Fig. 6e) and Eg derived from IPCE spectra (Fig. 6c). Among them, EVB, NHE can be calculated by the Eq. 3 [26]:
|
|
(3) |
where the φ is the work function of the instrument (5 eV).
The photoelectrochemical properties of the samples were characterized. ZIF-67/PC has the highest photocurrent density (Fig. 7a) and monochromatic incident photon-to-electron conversion efficiency (0.019% at 353 nm, Fig. 7b), indicating that the combination of biochar material with ZIF-67 can improve the photo-generated carrier generation efficiency of the material.
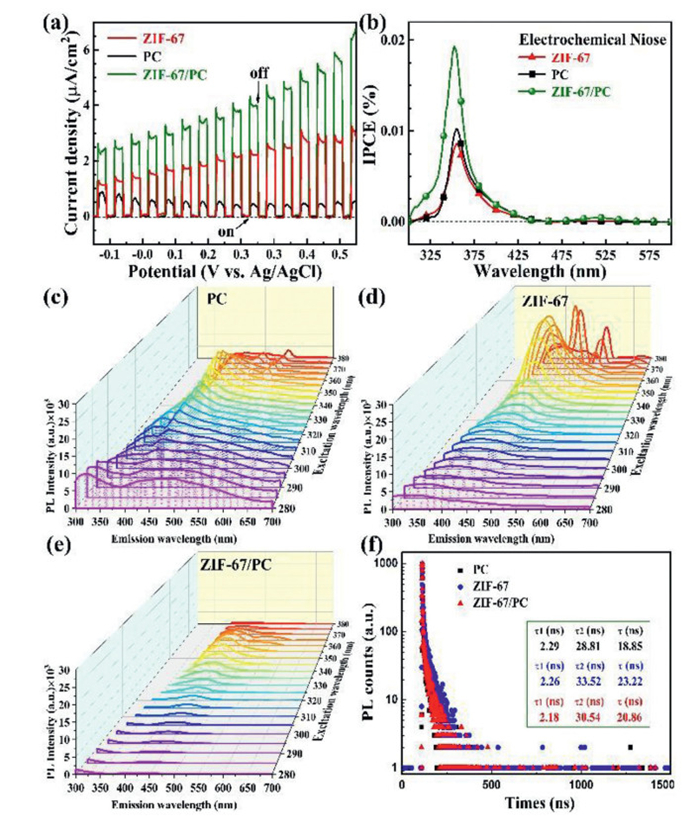
Moreover, PL was used to analyze the carrier behavior further [27]. It can be seen from Figs. 7c-e that ZIF-67 has the lowest fluorescence intensity and the most extended fluorescence lifetime, which is related to its fluorescence. However, compared with PC, the fluorescence intensity of ZIF-67/PC is weaker, and the fluorescence lifetime is more prolonged (Fig. 7f), indicating that combining biochar material and ZIF-67 can improve the PC's photo-generated carrier separation efficiency.
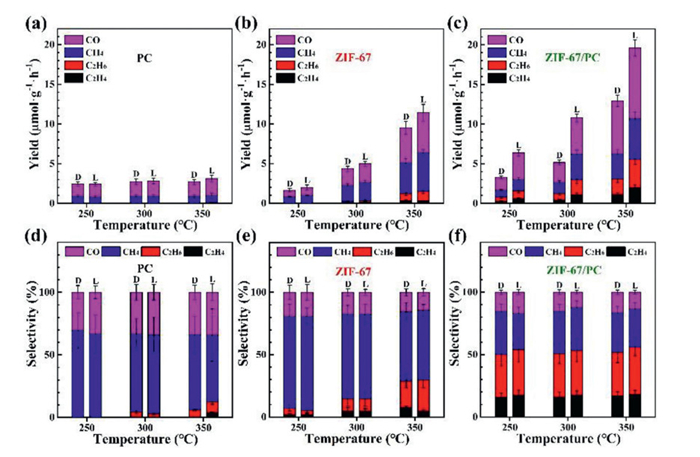
The obtained materials were used for thermo-photocatalytic CO2 conversion. As seen in Fig. 8, there are four main products: CO, CH4, C2H4, and C3H6. In addition, under the same test conditions, almost no C2 species were produced by PC (Figs. 8a and d), and ZIF-67 produced some C2 species in the absence of light (Figs. 8b and e). ZIF-67/PC obtained by combining the two substances had higher C2 yield (5.59 µmol g-1 h-1) and selectivity (55.96%) (Figs. 8c and f), indicating that ZIF-67 was an active component that could catalyze the reduction of CO2 to C2 products. Besides, the reaction performance of the catalyst under different evaluation temperatures (Fig. 8) and pressures (Fig. S5 in Supporting information) was also studied. The results show that enhancing the evaluation conditions can change the product's formation rate and achieve a selectivity change. The product formation rate was the highest when the reaction temperature was 350 ℃, and the reaction pressure was 0.2 MPa.
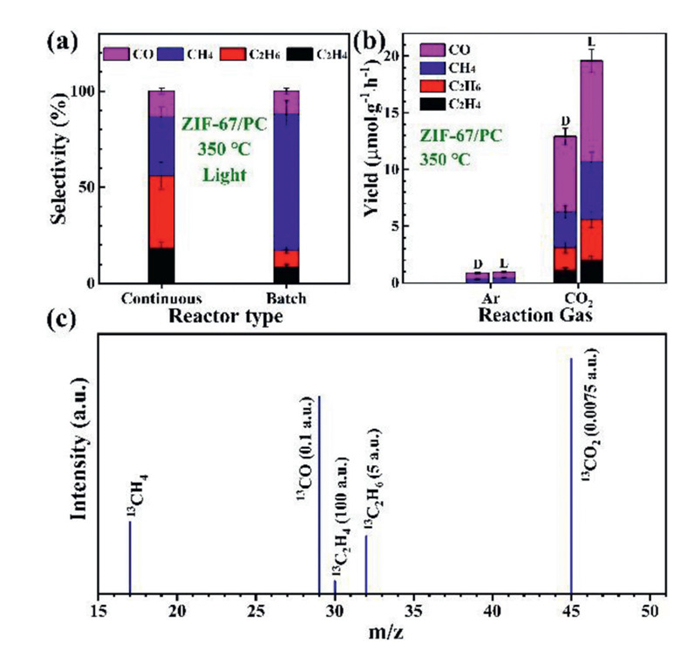
Meanwhile, compared with the batch operation (Fig. S6 in Supporting information), although the product formation rate was lower under continuous operation, the selectivity of C2 products was higher (Fig. 9a). Fig. 9b shows that under the same evaluation conditions when the raw gas was changed into Ar, the results (without any C2 product) confirmed that the C2 product was mainly derived from CO2 rather than other impurity carbon sources. Furthermore, when CO2 gas was replaced with 13CO2, the detection of 13CO2 (m/z = 45), 13CH4 (m/z 17), 13CO (m/z 29), 13C2H4 (m/z 30), and 13C2H6 (m/z 32) in the products using mass spectrometry confirmed that the majority of the products originated from CO2 (Fig. 9c and Fig. S7 in Supporting information) [28]. In order to display all relevant substances in Fig. 9c, the peak intensities of each substance were appropriately enlarged and reduced. For example, the peak intensity of CO2 is 0.0075 times the actual peak intensity, and the peak intensity of C2H4 is 100 times the actual peak intensity. The stability test measurements show that the catalytic performance of ZIF-67/PC decreases with the progress of the reaction (Fig. S8). This may be related to the thermal decomposition of the catalyst (Fig. S9 in Supporting information). The XRD results (Fig. S10 in Supporting information) of the samples after the cycling tests indicate that the characteristic peaks of ZIF-67 have become less distinct. Although there is little difference in the XPS spectra (Fig. S11 in Supporting information) of C and Co elements before and after the cycling tests, the atomic ratio of C to Co (Table S4 in Supporting information) has changed, with a reduced proportion of Co. This suggests a certain degree of loss during the reaction, which may be one of the reasons for the decline in catalytic performance.
Besides, the catalytic performance in this work is complex to compare with the reported performance of biochar or ZIF-67 catalysts for CO2 conversion because the reaction system used in this paper (a fixed bed reactor with a continuous process, in which H2O was used as a reducing agent) is different from that reported. Table S5 (Supporting information) [11,12,29] shows the comparative results of catalytic performance with similar reaction systems and other recent studies on the reduction of CO2 to C2 species. The results show that, although the catalytic performance of ZIF-67/PC is weaker than that reported in the current literature, certain C2 products (55.96%) can be obtained at higher flow rates (10 mL/min) and UV-visible spectrum in this paper. However, other studies (Table S5) [30–32] on CO2 conversion are conducted in closed static reactors, and the products are primarily one-carbon products. In addition, the fixed bed reactors with continuous processes that this article focuses on have good industrial application prospects.
Furthermore, we explored the role of heat and light. Compared with the pure thermal reaction, the product yield increased after introducing light, and the selectivity of C2H4 was also improved, although the enhancement in catalytic performance was not particularly pronounced. This indicates that thermal effects primarily drive the reaction while introducing light energy, which helps accelerate the reaction process and achieve C—C coupling to some extent. Moreover, light can provide materials with both heat and photo-generated electrons. To further investigate whether photo-to-thermal or photocatalytic effects dominate, we compared the catalytic performance under 80 ℃/380 ℃ without light irradiation, labeled 80(H) and 380(H), respectively. The reason for choosing 80 ℃/380 ℃ is that light irradiation usually causes a temperature increase of about 30 ℃. When we set 50 ℃/350 ℃ as the target temperature for the heating system, the temperature of the ZIF-67/PC catalysis surfaces will be about 80 ℃/380 ℃ after exposure to light observerously, which tests are labeled 50(H)+30(L) and 350(H)+30(L), respectively (Fig. S12 in Supporting information). The test results indicate that raising the reaction temperature alone resulted in lower yield and selectivity of C2 products compared to light irradiation. This suggests that light-induced photo-generated electrons played a significant role in promoting the reaction. The calculation results of activation energy of ZIF-67/PC before and after illumination further confirm the above statement (Figs. 10a and b). The results show that the reaction mechanism is more complex because the activation energy of the catalyst before and after light is quite different. The activation energy (Ea) of C2H6 and C2H4 decreased after illumination, indicating that lighting was more favorable for the formation of C2H4. The calculation details of Ea are provided in Section 4 (Supporting information). The thermo-photocatalytic CO2 conversion performance of ZIF-67 and PC at different ratios can also differ. As shown in Fig. S13 (Supporting information), the best performance was achieved when the ratio of ZIF-67 to PC was 1:2.
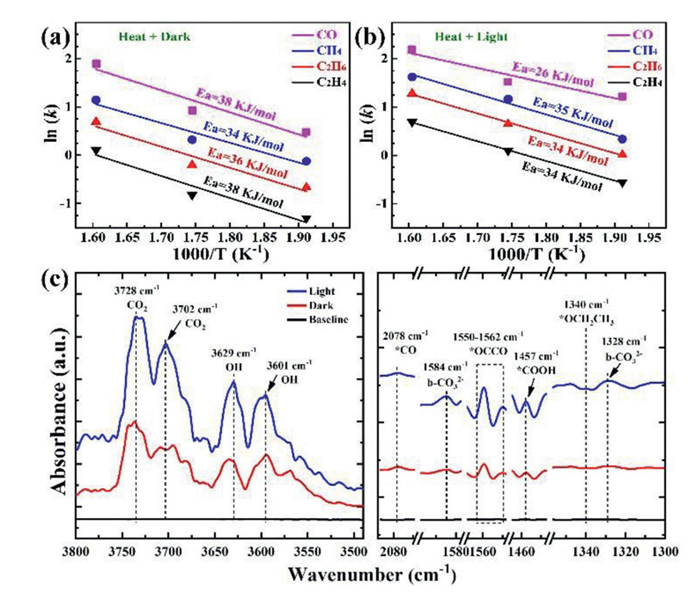
Further analysis of the influence of light introduction on the products of CO2 conversion in ZIF-67/PC was carried out using in-situ DRIFTS. As shown in Fig. 10c, the 1328 cm-1 and 1584 cm-1 peaks correspond to the symmetric and asymmetric stretching vibrations of bidentate carbonate (b-CO32-), respectively. The 3702 cm-1 and 3728 cm-1 peaks represent the Fermi resonance of linearly adsorbed CO2. Compared to the condition of no light, the intensity of the peaks related to CO2 increased to some extent after light illumination, indicating that introducing light promotes its adsorption and activation. The peaks at 3601 cm-1 and 3629 cm-1 are attributed to OH species, and their intensity slightly increased after light illumination, suggesting that the introduction of light facilitates H2O dissociation. In addition, the signal intensity of *COOH (1457 cm-1) [33], *OCCO (1550–1562 cm-1) [34], and *OCH2CH3 (1340 cm-1) [35] as important intermediates of CH4, C2H4, and C2H6, respectively, all increased after light introduction. This indicates that the introduction of light is more conducive to the progress of the reaction, which is consistent with the performance test results. Meanwhile, it was found that the peak at 2078 cm-1 (*CO) [33], which is a CO intermediate and important adsorption state for generating C2 products, remained basically unchanged after light introduction. Considering the increase in CO yield and C2 product formation, it is believed that *CO participates in the CO generation and C—C coupling reactions. The intermediates involved in C2H4 production are also intermediates in C2H6 ethane production. If the use of electrons and protons cannot be controlled, these two substances can easily occur simultaneously [36].
To gain further insight into the adsorption activation ability of PC, ZIF-67, and ZIF-67/PC for H2O, we conducted in-situ attenuated total reflection surface-enhanced infrared spectroscopy (ATR-SEIRAS) on these three samples (Fig. S14 in Supporting information) [37,38]. The peak observed at 1655 cm-1 is attributed to the bending vibrational mode of H2O adsorption on the catalyst surface [37]. The results demonstrated that the H2O adsorption peaks of ZIF-67/PC were markedly higher than those of PC and ZIF-67, indicating that water molecules were more readily adsorbed on the surface of ZIF-67/PC. This also substantiated that the adsorption activation capacity of ZIF-67/PC for H2O was superior to that of PC and ZIF-67.
In conclusion, this paper obtained a biochar-based composite material (ZIF-67/PC), and its thermo-photocatalytic CO2 reduction performance in a continuous process fixed-bed reactor with H2O as a reducing agent was explored. ZIF-67/PC has excellent catalytic performance compared with PC and ZIF-67, especially a certain C2 yield (5.59 µmol g-1 h-1) and selectivity (55.96%), which is because the band structure, pore structure, and surface properties of the material can be changed after composite, thus improving its photoelectrochemical properties and strong adsorption performance for CO2 and H2O. This work expands the application scope of biochar-based materials and enriches the variety of catalysts for CO2 thermal-photocatalytic conversion. Combining biochar with MOF materials, a composite material with substantial CO2 and H2O adsorption activation capabilities and electron density gradients was obtained, enhancing the catalytic performance for converting CO2 and H2O into C2 products in continuous operation processes. We believe this finding is vital for establishing efficient, high-throughput catalytic CO2 conversion technologies.
The authors declare that they have no known competing financial interests or personal relationships that could have appeared to influence the work reported in this paper.
Xia Jiang: Writing – review & editing, Writing – original draft, Formal analysis, Data curation, Conceptualization. Yan-Xin Chen: Writing – review & editing, Writing – original draft, Supervision, Funding acquisition, Formal analysis, Data curation, Conceptualization. Rui Chen: Writing – original draft, Investigation, Formal analysis, Data curation. Hao-Yan Shi: Investigation, Formal analysis. Ke-Xian Li: Investigation, Formal analysis, Data curation. Wen-Ya Zhong: Investigation, Formal analysis. Jian-Feng Li: Writing – review & editing, Supervision, Conceptualization. Can-Zhong Lu: Writing – review & editing, Supervision, Conceptualization.
Authors are thankful for the financial support of the Natural Science Foundation of Fujian Province (No. 2023H0046), the XMIREM Autonomously Deployment Project (Nos. 2023CX10, 2023GG01), the Science and Technology Service Network Initiative from Chinese Academy of Science (No. STS2024T3071), the National Natural Science Foundation of China (Nos. 22275185, 21925404), the Major Research Project of Xiamen (No. 3502Z20191015), the Fujian Science & Technology Innovation Laboratory for Optoelectronic Information of China (Nos. 2021ZR132, 2021ZZ115).
Supplementary material associated with this article can be found, in the online version, at doi:
O.A. Ojelade, S.F. Zaman, J. CO2 Util. 47 (2021) 101506. doi: 10.1016/j.jcou.2021.101506
K. Cheng, Y. Li, J. Kang, et al., Acc. Chem. Res. 57 (2024) 714–725. doi: 10.1021/acs.accounts.3c00734
J. Gao, S.C.S. Shiong, Y. Liu, Chem. Eng. J. 472 (2023) 145033. doi: 10.1016/j.cej.2023.145033
X. Jiang, R. Chen, Y.X. Chen, et al., Chem. Synth. 4 (2024) 46. doi: 10.1109/icnlp60986.2024.10692734
Y. Wu, Q. Hu, Q. Chen, et al., Acc. Chem. Res. 56 (2023) 2500–2513. doi: 10.1021/acs.accounts.3c00373
B. Han, Y.H. Hu, J. Phys. Chem. C 119 (2015) 18927–18934. doi: 10.1021/acs.jpcc.5b04894
L. Li, D. Xu, X. Xu, et al., P. Natl. Acad. Sci. U. S. A. 121 (7) (2024) e2318970121. doi: 10.1073/pnas.2318970121
S. Xie, W. Ma, X. Wu, et al., Energy Environ. Sci. 14 (2021) 37–89. doi: 10.1039/d0ee01860k
T. Lu, T. Xu, S. Zhu, et al., Adv. Mater. 35 (2023) e2310433. doi: 10.1002/adma.202310433
S. Fang, Y.H. Hu, Chem. Soc. Rev. 51 (2022) 3609–3647. doi: 10.1039/d1cs00782c
K. Wang, R.M. Jiang, T. Peng, et al., Appl. Catal. B 256 (2019) 117780. doi: 10.1016/j.apcatb.2019.117780
H. Bian, T. Liu, D. Li, et al., Chem. Eng. J. 435 (2022) 135071. doi: 10.1016/j.cej.2022.135071
P. Devi, R. Verma, J.P. Singh, J. CO2 Util. 65 (2022) 102211. doi: 10.1016/j.jcou.2022.102211
W.J. Liu, H. Jiang, H.Q. Yu, Chem. Rev. 115 (2015) 12251–12285. doi: 10.1021/acs.chemrev.5b00195
Q.J. Wu, J. Liang, Y.B. Huang, et al., Acc. Chem. Res. 55 (2022) 2978–2997. doi: 10.1021/acs.accounts.2c00326
Y.Z. Zhao, J.L. Zhang, Chem. J. Chin. Univ. 43 (2022) 20220223.
F. Guo, Z.Z. He, P. Wang, et al., Sci. China Chem. 68 (2024) 601–609.
Y. Zhang, Q. Zhou, X.Y. Lu, et al., CCS Chem. 6 (12) (2024) 2950–2960. doi: 10.31635/ccschem.024.202404245
X.Y. Lu, P. Wang, Z.F. Qiu, et al., Chem. Comm. 61 (10) (2025) 2087–2090. doi: 10.1039/d4cc04659e
X. Jiang, Y.X. Chen, J.W. Zhou, et al., ACS Omega 7 (2022) 30495–30503. doi: 10.1021/acsomega.2c03949
M. Zang, C.M. Xiao, C. Zang, et al., ACS ES&T Engg. 1 (2021) 249–260.
M. Wang, J.X. Liu, C.M. Guo, et al., J. Mater. Chem. A 6 (2018) 4768–4775. doi: 10.1039/c8ta00154e
Q.S. Huang, W. Wei, J. Ni, Green Chem. 23 (2021) 9683–9692. doi: 10.1039/d1gc03701c
X.Y. Liang, X.F. Ren, Q.Y. Yang, et al., Nanoscale 13 (2021) 2843–2848. doi: 10.1039/d0nr08744k
H.Y. Shi, Y.X. Chen, M.H. Ji, et al., Chem. Synth. 4 (2024) 45. doi: 10.30538/psrp-oma2024.0134
X.B. Li, B.B. Kang, F. Dong, et al., Nano Energy 81 (2021) 105671. doi: 10.1016/j.nanoen.2020.105671
Y. Zhang, Y. Liu, X. Gong, et al., Chem. Synth. 4 (2024) 21.
M. Xu, Q.Y. Zhang, S.P. Wei, et al., Angew. Chem. Int. Ed. 64 (23) (2025) e202506072. doi: 10.1002/anie.202506072
X. He, Z.R. Gan, S. Fisenko, et al., ACS Appl. Mater. 9 (2017) 9688–9698. doi: 10.1021/acsami.6b16817
W. Cao, X.W. Bai, Y.Y. Gao, et al., Chem. Comm. 56 (2020) 7777–7780. doi: 10.1039/D0CC00805B
R.Z. Feng, M.N. Guo, Z.Q. Yang, et al., Carbon 224 (2024) 119079. doi: 10.1016/j.carbon.2024.119079
J.H. Chen, Y.Q. Ren, Y.W. Fu, et al., ACS Nano 18 (2024) 13035–13048. doi: 10.1021/acsnano.4c01637
K. Yan, D.H. Wu, T. Wang, et al., ACS Catal. 13 (2023) 2302–2312. doi: 10.1021/acscatal.2c05741
Y. Kim, S. Park, S.-J. Shin, et al., Energy Environ. Sci. 13 (2020) 4301. doi: 10.1039/d0ee01690j
Y. Katayama, F. Nattino, L. Giordano, et al., J. Phys. Chem. C 123 (2019) 5951–5963. doi: 10.1021/acs.jpcc.8b09598
X. Zhi, A. Vasileff, Y. Zheng, et al., Energy Environ. Sci. 14 (7) (2021) 3912–3930. doi: 10.1039/d1ee00740h
H.Y. Shi, Y.X. Chen, Y.H. Pu, et al., Chem. Eng. J. 515 (2025) 163490. doi: 10.1016/j.cej.2025.163490
S. Soodi, J.J. Zhang, J. Zhang, et al., Chem. Synth. 4 (2024) 44.

Figure 1 The scheme and the photographs of the continuous flow fixed bed reactor for the thermo-photocatalytic CO2 conversion.

Figure 4 XRD patterns (a), FTIR spectra (b), N2 adsorption-desorption isotherm and pore size distribution (c), full-range XPS spectra (d), high-resolution spectra of Co 2p (e, f) of samples.

Figure 5 ESR spectrometer (a), Raman spectra (b), and the CO2-TPD profiles (c) of the samples of PC (black line) and the ZIF-67/PC (red line).

Figure 6 The UV–vis DRS spectra (a), the photocurrent density versus the monochromatic light (b), the band gap determination extracted from IPCE spectra (c), the electrochemical impedance spectra (d), the XPS valence band spectrum (e), and the band structures (f) of different samples.

Figure 7 Chopped LSV curves under AM 1.5 G (a), IPCE (b), PL (c-e), and time-resolved fluorescence spectra (f) of the as-prepared PC, ZIF-67, and ZIF-67/PC samples, respectively.

Figure 8 The reaction performance of the prepared catalysts under different evaluation temperatures. The yield (a-c) and the selectivity (d-f) of thermo-photocatalytic CO2 conversion were obtained from PC, ZIF-67, and ZIF-67/PC, with light (L) and without light irradiation (D), respectively. Amount of catalyst: 0.015 g. The reaction pressure: 0.2 MPa. The flow rate of the reaction gas: 10 mL/min. The reaction temperature: 250, 300, and 350 ℃. The light source: 300 W xenon lamp with a power of 450 mW/cm2.

Figure 9 Comparison of catalytic performance between batch process and continuous process after 1 h reaction (a), comparison of catalytic performance under the condition of Ar and CO2 as raw gas (b), The mass spectra results for 13CO2 thermo-photo reduction on ZIF-67/PC (c).

 扫一扫看文章

扫一扫关注我们
 DownLoad:
 下载:
下载:


 下载:
下载: