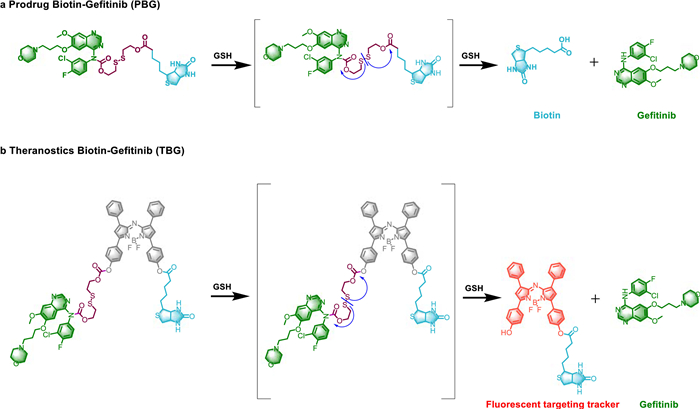
Scheme 1.
The proof-of-concept and drug release principle of PBG and TBG.
Construction of a biotin-targeting drug delivery system and its near-infrared theranostic fluorescent probe for real-time image-guided therapy of lung cancer
Xinyu Song , Rui Wang , Junfang Gao , Xiaoyue Han , Jianfeng Jin , Changjun Lv , Fabiao Yu

For the design of a certain cancer-selective drug, it is still a huge challenge to realize desirable purpose in avoiding systemic toxicity and administrating higher drug concentrations in cancer lesions [1]. It is believed that the critical challenge can be achieved by the newly emerging theranostics which play important roles in cancer diagnosis and therapy to deliver tailored diagnostics and therapeutics [2, 3]. To construct a cancer-targeting activable prodrug, the potent anti-cancer drug should connect with a desirable cancer recognition moiety directly and through a cleavable linker. The prodrug needs to exhibit low systemic cytotoxicity before guided to cancer lesions and internalized into the cancer cells [4]. The linker should behave stable in systemic circulation, while it has to readily release the active cytotoxic drug in the micromilieu of solid cancers, under the stimulation of higher concentrations of glutathione (GSH), higher levels of reactive oxygen species, overexpressed enzymes, or lower pH values [5-13]. Small molecule fluorescent theranostics are often devised form clear different moieties. Since the fluorescence emission is employed to deliver real-time detection signal [14-17], it is preferable to utilizing near-infrared (NIR) fluorophores as the signal transducer, because the NIR light (650–900 nm) can deeply penetrate the tissue, minimize the interference from auto-fluorescence, and facilitate in vivo imaging of the molecular processes [18-21].
Surgical resection of malignant neoplasms remains as the primary and efficacious therapy methods for non-small lung cancer (NSCLC), and chemotherapy is considered to be the dominant and effective treatment strategy for metastasized or disseminated cancer [22]. However, the therapeutic efficacies of anti-cancer drugs in the current clinical are hindered by their low selectivity, poor penetration and unexpected side-effects. Therefore, following the above-mentioned requirements for the design of prodrugs and theranostics, we conceived a NSCLC-targeting activable prodrug biotin-Gefitinib (PBG) and its fluorescent theranostic platform biotin-Gefitinib (TBG) (Scheme 1). The human lung adenocarcinoma PC9 cell line and the corresponding cancer-bearing nude mice were utilized to examine the effectiveness of the prodrug PBG. The results proved that PBG could perform enhanced anti-cancer effects in cells and in vivo. As a fluorescent theranostics, TBG could trace the distribution, metabolism, and elimination of the prodrug PBG by non-invasive fluorescence imaging in real-time. Moreover, the prodrug PBG prompted high cytocidal effect through the precise drug delivery, whereas the fluorescent theranostics TBG accomplished with real-time monitoring of the drug release and treatment effect.
According to the general design proposal in Scheme 1, the anticancer prodrug includes two moieties: a potent anticancer drug Gefitinib for NSCLC patients with epidermal growth factor receptor (EGFR) mutation and a cancer recognition moiety biotin that can be transported by Na+-dependent multivitamin transporter (SMVT), which conjugate together via a cleavable linker [23]. SMVT is a highly expressed transmembrane carrier. The cancer tissues overexpress more SMVT than the normal tissues [24]. Additionally, biotin has been improved as a good cancer recognition for the design of biotinylation drugs, which is chosen as the candidate to guide Gefitinib into cancer cells [25]. A cleavable linker is expected to be a susceptible chemical bridge which prefers to be cleaved under the stress of cancer specific internal milieu. As expected, the EGFR-mutation NSCLC cells process abnormally higher GSH level than the non-mutation cells. A GSH-activable disulfide bond (–S–S–) is selected as the linker between the anticancer prodrug Gefitinib and the cancer recognition moiety biotin. To improve therapeutic index and cancer-selectivity of Gefitinib, we finally obtain a new targeting prodrug PBG and further obtain a fluorescent theranostics TBG by inserting a near-infrared azo-BODIPY fluorophore (Scheme 1). The theranostics TBG will facilitate drug development, which can offer more information, such as drug biodistribution, targeting capability, pharmacokinetics, and therapy effect in real-time. All the synthetic routes and molecular structure characterization can be found in Supporting information.
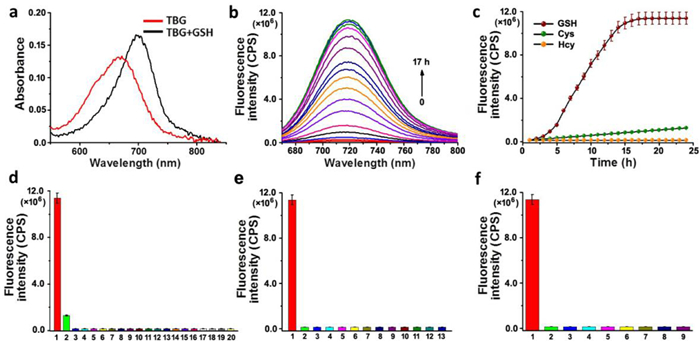
The spectroscopic absorption and emission properties of the fluorescent theranostics TBG were investigated under simulated physiological conditions (HEPES buffer, pH 7.4). As shown in Fig. 1a, the free fluorescent theranostics TBG exhibited a maximum absorption wavelength at 672 nm (ε672 nm = 1.33 × 10⁴ L mol−1 cm−1). After the addition of 10 mmol/L GSH, the maximum absorption peak red-shifted to 704 nm (ε704 nm = 1.65 × 10⁴ L mol−1 cm−1). Simultaneously, a fluorescence emission band appeared at 720 nm (Fig. 1b). The fluorescent intensity gradually increased to a plateau within 17 h (Figs. 1b and c), which was benefit for tracing the prodrug PBG release process in cells and in vivo. The selectivity of TBG towards various bioactive species was also checked. As shown in Fig. 1c, only high level of biothiols could trigger the fluorescence emission. Other bioactive species, such as amino acids and peptides (Fig. 1d), anions and metal ions (Fig. 1e), as well as reactive oxygen species and reactive nitrogen species (Fig. 1f) hardly induced any fluorescence changes. The results demonstrated that the prodrug PBG and the theranostics TBG could selectively release Gefitinib via the high level of biothiols, such as GSH in cancer cells. And the fluorescence profile of the theranostics TBG made it possible to detect the prodrug PBG delivery process in cancer cells and in vivo.
To further verify the drug release under the GSH-triggering, the inspection of reaction kinetics between TBG and GSH by high-performance liquid chromatography (HPLC), as shown in Fig. S1 (Supporting information). Since our fluorescent theranostic TBG had exhibited excellent sensitivity and selectivity towards GSH, we further examined the potential fluorescence release efficacies of TBG in living cells. As shown in Fig. S2a (Supporting information), after the administration of 1 µmol/L TBG in the living PC9 cells, the fluorescence intensity reached its highest value at the time point of 16 h, indicating a process of sustained drug release activated by high endogenous GSH level in PC9 cells. And the fluorescence images could continuously last more than 23 h, which illustrated a long intracellular retention time. As shown in Fig. S3 (Supporting information), we next explored the cellular transport processes of TBG, which showed weak fluorescence. These results indicated that TBG could not be transported into cells when the transport receptors were inhibited.
Next, the efficacies of prodrug PBG and fluorescent theranostics TBG were evaluated with PC9 cells. To visually evaluate the cytotoxity of PBG and TBG, a commercial Caspase-3/7 green detection reagent was introduced to detect the cleavage of caspase 3. PC9 cells were treated with 1 µmol/L Gefitinib, PBG and TBG for 24 h, respectively (Figs. S4a and S5 in Supporting information). The red fluorescence of TBG displayed the drug release. Both PBG and TBG induced higher green fluorescence rate than Gefitinib, indicating the prodrugs were more potent than Gefitinib. In addition, the transmission electron microscopy (TEM) was utilized to observe the subcellular mitochondria changes after the treatment of Gefitinib, PBG and TBG (Fig. S4b in Supporting information). To evaluate the apoptotic rate that induced by different concentrations of prodrug PBG and corresponding theranostics TBG for 72 h, the cells were stained with PE anti-active caspase 3 antibody. As displayed in Figs. S4c and d (Supporting information), PBG and TBG showed similar levels of active caspase 3, which were higher than that Gefitinib led. As displayed in Fig. S4e (Supporting information), PBG and TBG almost resulted in the same cell viability which was lower than Gefitinib. Compared with Gefitinib, both PBG and TBG obstructed the migration of PC9 cells from the upper wells (Fig. S4f in Supporting information). The dissociation curves showed that both PBG and TBG decreased more cell adhesion than Gefitinib after 60 s (Fig. S4g in Supporting information). To investigate the enhanced therapy effect of PBG and TBG, we quantified the expression of p-EGFR, p-Akt and p-ERK changes with Western blot analysis and flow cytometry. The PC9 cells were treated with Gefitinib, PBG, and TBG for 72 h, respectively. The Western blot results offered that both PBG and TBG treatment led to the more inhibition of p-EGFR, p-Akt and p-ERK than those of Gefitinib group (Fig. S4h in Supporting information). The flow cytometry results were consistent with the Western blot bands grey intensity, demonstrated that PBG and TBG were more efficacious EGFR tyrosine kinase inhibitors than Gefitinib (Figs. S4i-k in Supporting information). The ratios of cleaved-caspase 3 to caspase 3 in the PBG and TBG groups were higher than that in Gefitinib group, which supported that the more serious apoptosis was induced by PBG and TBG. The results confirmed the caspase 3-dependent apoptosis (Fig. S4l in Supporting information).
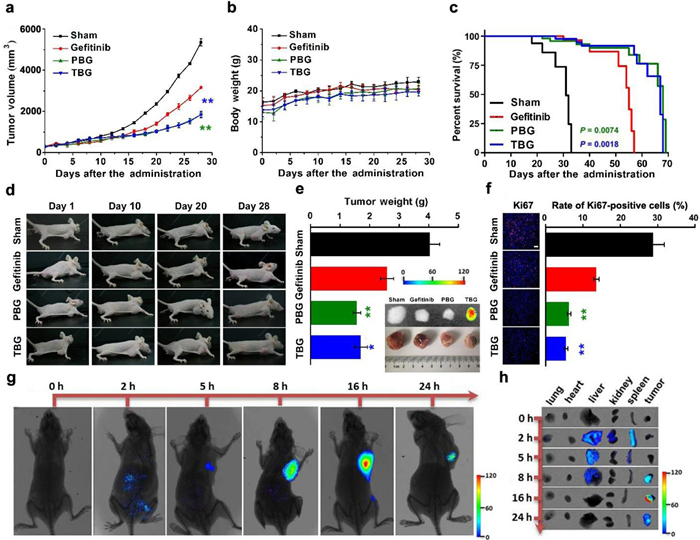
Since our prodrug PBG and fluorescent theranostics TBG had been proven efficacious on cancer cells, we then strived to assess the efficacies of PBG and TBG in vivo. All experiments performed with mice were carried out in accordance with protocols approved by the Institutional Animal Care and Use Committee of Binzhou Medical University. As displayed in Fig. 2, PC9 cells cancer-bearing nude mice were divided into four groups. Then the mice were injected via tail vein with saline, Gefitinib, PBG, and TBG every other day, respectively. Cancer volume and nude mice weight were measured every two days for 28 days. Then all the cancers were dissected and weighed. As illustrated in Fig. 2a, PBG and TBG provided more curative effect for PC9 cancer-bearing mice than the group with Gefitinib. The body weight changes during the therapy process were presented in Fig. 2b, in which there was prolonged lifetime than Gefitinib (Fig. 2c). Images of nude mice captured at 0, 10th, 20th and 28th days were shown in Fig. 2d. The results showed obvious visible change of cancer masses. The corresponding tumor weights were shown in Fig. 2e. Cancer tissues in Fig. 2e were sectioned and costained by Ki67 (D3B5) Rabbit mAb (Alexa Fluor 647 Conjugate) to determine the cell proliferation level. Compared with the saline and Gefitinib groups, the significantly decreased Ki67-positive cells in PBG and TBG groups revealed that PBG and TBG could effectively reduce the cell proliferation in PC9 cell-derived cancers (Fig. 2f). The results illustrated that PBG and TBG were more efficacious than Gefitinib for the nude mice bearing PC9 cancers. We subsequently examined the targeting capability of our fluorescent theranostics TBG in vivo (Fig. 2g). TBG were injected a single dose 100 µmol/L (200 µL DMSO: saline (1/1, v/v)) via tail vein. And the targeting function and metabolism of TBG was investigated through the fluorescence imaging at 2, 5, 8, 16 and 24 h, as shown in Fig. 2h.
We further checked the rate of Gefitinib release in both cancer cells with EGFR mutation or not. PC9 cells (EGFR-mutation positive) and A549 cells (EGFR-mutation negative) were incubated with 1 µmol/L TBG for 2 h (Figs. S7a and b in Supporting information). This result illustrated that the higher drug release rate occurred in EGFR mutated PC9 cells. Therefore, the EGFR mutation-type NSCLC provided more suitable condition for TBG potential clinical applications. We also investigated the distribution of fluorescence intensity in human lung adenocarcinoma tissues (Fig. S7c in Supporting information). There was no significant difference of mean fluorescence intensities between the two groups (Fig. S7d in Supporting information). Despite the GSH concentration of EGFR mutation tissue was higher than that of non-mutation tissues (Fig. S7e in Supporting information). We further stained the patient-derived lung adenocarcinoma tissue with anti-SMVT antibody to determine the expression level of SMVT. As shown in Fig. S7f (Supporting information), the SMVT expression of the two groups displayed no significant level difference.
In this study, we focus on a proof-of-concept examination of targeting anticancer prodrug and its theranostics for enabling visualization of cancer therapy. We have successfully designed and synthesized a new biotin-targeting prodrug PBG and its fluorescent theranostic TBG for the specific treatment of NSCLC. PBG improved the specific delivery and accumulation in PC9 cells. With employing PC9 cancer bearing nude mice model, we verify the in vivo therapy efficiencies of PBG and TBG on NSCLC. The near-infrared fluorescence changes of TBG can be utilized to describe the selective distribution, longitudinal retention process and therapeutic state of in PBG in cancer lesions. Besides, although we have confirmed the cancer cells with EGFR mutation containing more GSH than those without mutation, the results from patient-derived lung cancer tissues demonstrate the drug release of PBG is determined by both GSH concentration and SMVT expression level. We anticipate that our prodrug PBG can benefit NSCLC patients with Gefitinib targeting release. The theranostic features of TBG can be valuable to precisely assess the pharmacokinetic profile of PBG for NSCLC treatment.
The authors declare that they have no known competing financial interests or personal relationships that could have appeared to influence the work reported in this paper.
This work was supported by Hainan Natural Science Foundation (Nos. 2019RC203, 2019RC220 and 2019RC210), National Natural Science Foundation of China (Nos. 21864011 and 21775162), Hainan Key Research and Development Project (No. ZDYF2020133), Nanhai Young-Talent Program of Hainan (No. 20202007), and Hundred-Talent Program (Hainan 2018).
Supplementary material associated with this article can be found, in the online version, at doi:10.1016/j.cclet.2021.08.111.
M. Srinivasarao, P.S. Low, Chem. Rev.117 (2017) 12133-12164. doi: 10.1021/acs.chemrev.7b00013
C.S. Kue, A. Kamkaew, K. Burgess, et al., Med. Res. Rev. 36 (2016) 494-575. doi: 10.1002/med.21387
W. Sun, M. Li, J. Fan, et al., Acc. Chem. Res. 52 (2019) 2818-2831. doi: 10.1021/acs.accounts.9b00340
M. Srinivasarao, C.V. Galliford, P.S. Low, Nat. Rev. Drug Discov. 14 (2015) 203-219. doi: 10.1038/nrd4519
F. Deng, Z. Xu, Chin. Chem. Lett. 30 (2019) 1667-1681. doi: 10.1016/j.cclet.2018.12.012
Kenry, K.C. Chong, B. Liu, Acc. Chem. Res. 52 (2019) 3051-3063. doi: 10.1021/acs.accounts.9b00356
X. Huo, X. Tian, Y. Li, et al., Sens. Actuators B: Chem. 262 (2018) 508-515. doi: 10.1016/j.snb.2018.02.047
Q. Li, J. Cao, Q. Wang, et al., J. Mater. Chem. B7 (2019)1503-1509. doi: 10.1039/c8tb03188f
X. Li, J. Kim, J. Yoon, et al., Adv. Mater. 29 (2017) 1606857. doi: 10.1002/adma.201606857
W. Li, X. Gong, X. Fan, et al., Chin. Chem. Lett. 30 (2019) 1775-1790. doi: 10.1016/j.cclet.2019.07.056
A. Sharma, E.J. Kim, S. Mun, et al., Dyes Pigm. 163 (2019) 628-633. doi: 10.1016/j.dyepig.2018.12.026
W.S. Shin, J. Han, P. Verwilst, et al., Bioconjug. Chem. 27 (2016) 1419-1426. doi: 10.1021/acs.bioconjchem.6b00184
Q. Fang, L. Yang, X. Song, Chin. Chem. Lett. 31 (2020) 129-132. doi: 10.1016/j.cclet.2019.04.021
G. Chen, F. Tian, C. Li, et al., Biomaterials53 (2015) 265-273. doi: 10.1016/j.biomaterials.2015.02.090
Z. Hu, C. Fang, B. Li, et al., Nat. Biomed. Eng. 4 (2020) 259-271. doi: 10.1038/s41551-019-0494-0
J. Tian, Z. Cheng, S. Gambhir, Nat. Biomed. Eng. 4 (2020) 243-244. doi: 10.1038/s41551-020-0544-7
Q. Wang, J. Xu, R. Geng, et al., Biomaterials231 (2020) 119671. doi: 10.1016/j.biomaterials.2019.119671
X. Wu, X. Sun, Z. Guo, et al., J. Am. Chem. Soc. 136 (2014) 3579-3588. doi: 10.1021/ja412380j
G. Hong, A.L. Antaris, H. Dai, Nat. Biomed. Eng. 1 (2017) 1-22. doi: 10.1038/s41551-016-0001
X. Song, X. Han, F. Yu, et al., Theranostics8 (2018) 2217–2228. doi: 10.7150/thno.24041
W. Zhang, S. Song, H. Wang, et al., Biomaterials217 (2019) 119279. doi: 10.1016/j.biomaterials.2019.119279
D.S. Ettinger, D.L. Aisner, D.E. Wood, et al., J. Natl. Compr. Cancer Ne. 16 (2018) 807-821. doi: 10.6004/jnccn.2018.0062
G. Russell-Jones, K. McTavish, J. McEwan, et al., J. Inorg. Biochem. 98 (2004) 1625-1633. doi: 10.1016/j.jinorgbio.2004.07.009
W.X. Ren, J. Han, S. Uhm, et al., Chem. Commun. 51 (2015) 10403-10418. doi: 10.1039/C5CC03075G
W. Yang, Y. Cheng, T. Xu, et al., Eur. J. Med. Chem. 44 (2009) 862-868. doi: 10.1016/j.ejmech.2008.04.021

Figure 1 Spectral properties and selectivity of TBG. The spectra experiments were processed in the HEPES buffer (10 mmol/L, pH 7.4, 37 ℃). (a) Absorbance spectra of TBG (10 μmol/L) incubated with GSH (10 mmol/L). (b) Time-dependent fluorescence intensity changes towards GSH (10 mmol/L) (λex/λem = 704/690–800 nm). (c) Time-dependent fluorescence intensity at 720 nm of TBG (10 μmol/L) to GSH (10 mmol/L), cysteine (Cys) (200 μmol/L) and homocysteine (Hcy) (10 μmol/L) during 0–24 h. The following tests take 24 h. (d) Selectivity to amino acids and peptides: 1. 10 mmol/L GSH; 2. 200 μmol/L Cys; 3. 10 μmol/L Hcy; 4. Ala; 5. Arg; 6. Asn; 7. Asp; 8. Gln; 9. Glu; 10. 2 mmol/L Gly; 11. His; 12. Ile; 13. Leu; 14. Phe; 15. Pro; 16. Ser; 17. Thr; 18. Tro; 19. Tyr; 20. Val. The concentration of other analysts is 1 mmol/L. (e) Selectivity to anions and metal ions: 1. 10 mmol/L GSH; 2. 5 mmol/L K+; 3. 140 mmol/L Na+; 4. 2.5 mmol/L Ca2+; 5. Mg2+; 6. Zn2+; 7. Cu2+; 8. Cl–; 9. Br–; 10. I–; 11. CO32–; 12. HSO3–; 13. H2PO4–. The concentration of other analysts is 1 mmol/L. (f) Selectivity to reactive oxygen species and reactive nitrogen species. 1. 10 mmol/L GSH; 2. ONOO–; 3. NO; 4. NO2–; 5. O2•–; 6. •OH; 7. H2O2; 8. ClO–; 9. t-BuOOH. The concentration of other analysts is 200 μmol/L. The data were shown as mean ± SD (n = 3).

Figure 2 Efficacy evaluation and fluorescent images in vivo. Nude mice bearing PC9 cells subcutaneous cancer xenografts were established and treated with saline, Gefitinib, TBG, PBG (0.5 mmol/L in 0.2 mL saline, DMSO/saline (1/1, v/v), qod. i.v.) (n = 5 per group). (a) Tumor volume. The calculation followed the formula: volume (mm3) = length (mm) × width2 (mm2) × 0.5. (b) Body weights. (c) Survival curves of the PC9 cancer-bearing nude mice. (d) Images of nude mice captured in 1, 10, 20 and 28 days. (e) Tumor weight. Inset: Tumor masses and fluorescent images. (f) Immunofluorescence staining and statistical analysis of PC9 cancers Ki67 (red) with anti-Ki67 mAb (Alexa Fluor 647 Conjugate) and nucleus with DAPI (blue) (n = 5). Scale bar: 50 μm. (g) Nude mice bearing subcutaneous PC9 cancer xenografts were imaged for 2, 5, 8, 16 and 24 h after tail vein injection of a single-dose 0.2 mL of TBG (DMSO/saline (1/1, v/v)) (n = 5). (h) Isolated organs (lung, heart, liver, kidney, spleen) and cancer masses of the mice from (g) were imaged ex vivo (n = 5). The error bars shown in the figures represented the mean ± SD The differences were analyzed via one-way ANOVA followed by Bonferroni post hoc test. The differences between the PBG or TBG and Gefitinib group were determined with a one-way ANOVA except the cancer sizes with a two-way ANOVA followed by Bonferroni post hoc test. *P < 0.05, **P < 0.01 and ***P < 0.001 was statistically significant, respectively. The Kaplan–Meier method was utilized to evaluate survival.

 扫一扫看文章

扫一扫关注我们
 DownLoad:

 下载:
下载:
 下载:
下载: