Citation:
Yating Yang, Ming Xu, Ze Gao, Ting Wang, Zhaoxing Li, Yuqi Wang, Daming Yang, Ming Feng. Oxygen vacancy engineering of Fe2O3 nanospindles via cobalt incorporation for enhanced electrocatalytic N2 reduction towards NH3 synthesis[J]. Chinese Chemical Letters,
2026, 37(11): 112580.
doi:
10.1016/j.cclet.2026.112580
Oxygen vacancy engineering of Fe2O3 nanospindles via cobalt incorporation for enhanced electrocatalytic N2 reduction towards NH3 synthesis
English
Oxygen vacancy engineering of Fe2O3 nanospindles via cobalt incorporation for enhanced electrocatalytic N2 reduction towards NH3 synthesis
Received Date:
15 October 2025 Accepted Date:
03 March 2026 Revised Date:
20 January 2026 Available Online:
15 November 2026
Abstract:
The optimization of active sites to enables enhanced sluggish N2 adsorption and activation while suppressing the thermodynamically favored hydrogen evolution reaction (HER) is extremely important for N2-to-NH3 conversion by electrocatalytic nitrogen reduction reaction (NRR), but it remains a great challenge. Herein, a highly efficient oxygen vacancy-rich Fe2O3 nanospindles electrocatalyst is successfully constructed via Co incorporation, which induces the attenuation of electron cloud around the Fe site and enhances the adsorption and activation ability of the catalyst to N2 molecules. It is noteworthy that oxygen vacancies in Fe2O3 can be easily controlled by adjusting the amount of Co dopants and the competitive HER process can be effectively inhibited. The optimal Vo:Co-Fe2O3–5 demonstrates remarkably enhanced electrocatalytic activity towards NRR with a high NH3 yield rate of 30.4 μg h-1 mg-1cat. and a large FE of 16.4% under a potential of -0.5 V vs. RHE. Experimental results certificate that Co doping and oxygen vacancy modification modulate the local electronic structure and prolong the Fe-O bond in Fe2O3 that lead to the facilitated electron transfer and enhanced N2 adsorption and activation. This work provides a simple catalyst-design way for the development of advanced metal oxide materials for future energy applications.
Nitrogen reduction into ammonia (NH3) is a pivotal chemical transformation for modern economy sustainable development because NH3 is not only an important chemical product but also an attractive carbon-neutral energy carrier to cope with the impending fossil fuel crisis [1,2]. So far, the conventional industrial NH3 production is primarily governed by the Haber-Bosch technology, which relies on the harsh reaction conditions, such as high pressure (150−200 atm) and high temperature (300−500 ℃). This process is responsible for ca. 1.6%–3% of global fossil fuel-derived CO2 emissions and accounts for over 1% of total global energy consumption [3,4]. Therefore, exploring a green and energy-conserving alternative route to achieve ammonia synthesis is particularly urgent.
Electrocatalytic nitrogen reduction reaction (NRR) at ambient conditions provides an attractive approach for sustainable ammonia production, but it requires highly active electrocatalysts to reduce the thermodynamic resistance [5]. Until now, highly efficient NRR catalysts mostly rely on precious metals, such as Ru, Au, Pd, Pt, and Rh, but their high price and limited accessibility significantly hinder their large-scale practical applications [6–8]. In comparison, low-cost transition metals and their derivatives leveraging natural abundance have been developed as promising NRR electrocatalysts owing to their rich bonding orbitals to N2 [9,10]. Inspired by the Fe active centers in the structure of natural nitrogenases and traditional catalyst for Haber-Bosch process, Fe-based nanomaterials, such as iron oxide (Fe2O3), have attracted particular attention in electrochemical NRR since the partially filled d orbitals and widely variable oxidation state of Fe can promote strong N2 adsorption by forming the Fe-N bond and generating oxygen vacancies [11–13]. Although various Fe2O3-based materials have been fabricated [14–16], their electrocatalytic NRR performance in terms of ammonia generation rate and reaction efficiency remains far from satisfaction because of the difficulty of N2 adsorption and activation, as well as thermodynamically favored hydrogen evolution reaction (HER) competitive process [17–25]. Therefore, it is imperative to construct more effective Fe-based active sites that can accelerate the reaction kinetics and balance the competition between N2 and H, thereby optimizing NRR electrocatalytic activity and selectivity.
Cobalt (Co), with unique 3d electronic structure, plays a crucial role in the NRR electrocatalytic system. Its abundant oxidation states and high electronegativity are beneficial for generating oxygen vacancies and optimizing the electronic structure of neighboring atoms [26,27]. Additionally, the hybridization of 3d orbitals during the interaction between Co and Fe can enhance the chemical adsorption of N2 and facilitate electron transfer to N-related intermediate species absorbed on active sites, thereby accelerating the hydrogenation process [10,28]. Inspired by the above considerations, in this paper, we successfully engineered and modulated the oxygen vacancies in rhombohedral Fe2O3 by incorporating Co dopants for electrocatalytic NRR. The resulting Co-doped oxygen vacancy-rich Fe2O3 (Vo:Co-Fe2O3–5) exhibits excellent electrocatalytic N2-to-NH3 conversion efficiency under ambient conditions, achieving a high NH3 yield rate of 30.4 μg h-1 mg-1cat. and a large FE of 16.4%. These values outperform those of pristine Fe2O3 (13.8 μg h-1 mg-1cat. and 7.5%) and most reported similar NRR electrocatalysts. Comprehensive characterization analysis discloses that Co dopants not only create abundant oxygen vacancies but also induce the attenuation of electron cloud in Fe sites to well strengthen the N2 adsorption and activation. Furthermore, Co dopants regulate the electronic structure and surface characteristics of Fe2O3, generating more active sites, facilitating electron transfer, and further promoting the NRR electrocatalytic activity by suppressing the competitive HER process.
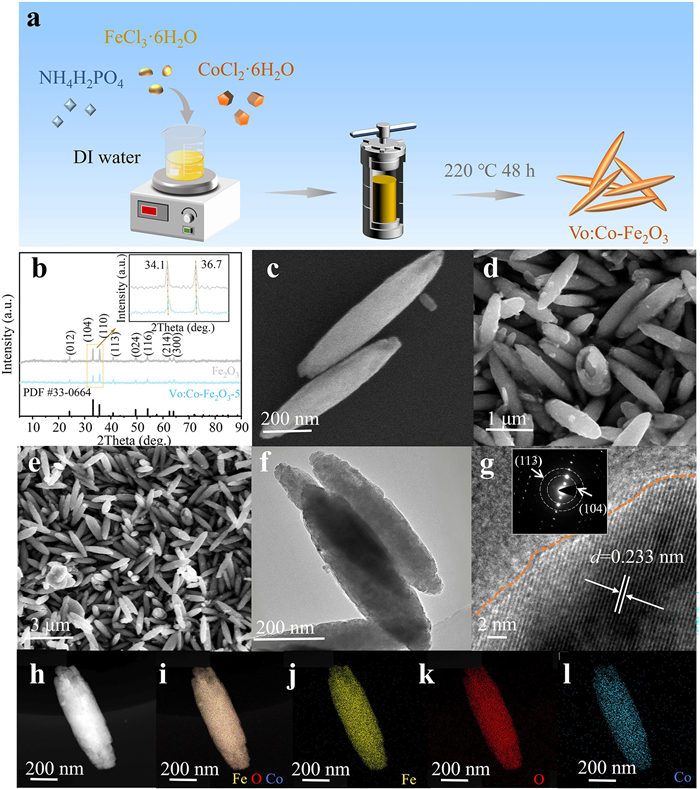
The synthesis process of Vo:Co-Fe2O3 is depicted in Fig. 1a, where the amount of the Co dopant can be easily regulated by adjusting the moles of cobalt in the raw materials. The phase composition and purity of the as-fabricated catalysts were characterized by powder X-ray diffraction (XRD) analysis. As depicted in Fig. 1b, all characteristic diffraction peaks of Vo:Co-Fe2O3–5 match the rhombohedral α-Fe2O3 phase (JCPDS No. 33–0664). No additional peaks related to cobalt oxides or other impurity phases were observed in the XRD patterns (Fig. S1 in Supporting information), demonstrating that Co was successfully incorporated into the Fe2O3 lattice without generating other crystalline phase. Whereas, the reflection peaks of Vo:Co-Fe2O3–5 shift slightly to higher degree compared to pristine Fe2O3 (inset in Fig. 1b), likely due to lattice distortion or stress induced by Co doping [29]. The refined lattice parameters (Figs. S2 and S3 and Table S1 in Supporting information) exhibit that the crystal cell volume of Vo:Co-Fe2O3–5 is slightly larger than that of Fe2O3, demonstrating that the Fe-O bond lengths have been prolonged due to distortion of the FeO6 octahedron [30]. This observation is further supported by the Raman spectra (Fig. S4 in Supporting information).
Figure 1
Figure 1.
(a) Synthesis schematic illustration of Vo:Co-Fe2O3. (b) XRD patterns of Fe2O3 and Vo:Co-Fe2O3–5. (c-e) SEM images, (f) TEM, (g) HRTEM (the inset shows SAED pattern) and (h-l) the corresponding elemental mapping images of Vo:Co-Fe2O3–5.
The morphology and microstructure of the synthesized samples were examined by scanning electron microscopy (SEM) and transmission electron microscopy (TEM). As shown in Fig. S5 (Supporting information), pure Fe2O3 exhibits a typical spindle-shaped structure. The SEM images of Vo:Co-Fe2O3 (Figs. 1c-e and Fig. S6 in Supporting information) confirm that this spindle-shaped structure is retained after Co doping. Energy dispersive X-ray (EDX) elemental analysis (Figs. S7 and S8 in Supporting information) reveals that Fe, O, and Co are uniformly distributed in Vo:Co-Fe2O3–5, with the Co atomic content increasing with doping concentration. Similarly, the same spindle-shaped structure is observed in the TEM image of Vo:Co-Fe2O3–5 and Fe2O3 (Fig. 1f and Fig. S9 in Supporting information). High-resolution TEM (HRTEM) image (Fig. 1g) shows clear lattice fringes with a spacing of 0.233 nm, corresponding to the (104) crystal planes of Fe2O3. The inset in Fig. 1g depicts the selected area electron diffraction (SAED) pattern of Vo:Co-Fe2O3–5, where the diffraction spots align well with rhombohedral α-Fe2O3, proving its high-quality single-crystalline nature. The corresponding 3D lattice fringe mapping (Fig. S10 in Supporting information) reveals an uneven surface of Fe2O3 after Co doping, indicating the presence of abundant defect sites. TEM elemental mappings (Figs. 1h-l) further demonstrate the uniform distribution of Fe, O, and Co in Vo:Co-Fe2O3–5, confirming the successful introduction of Co.
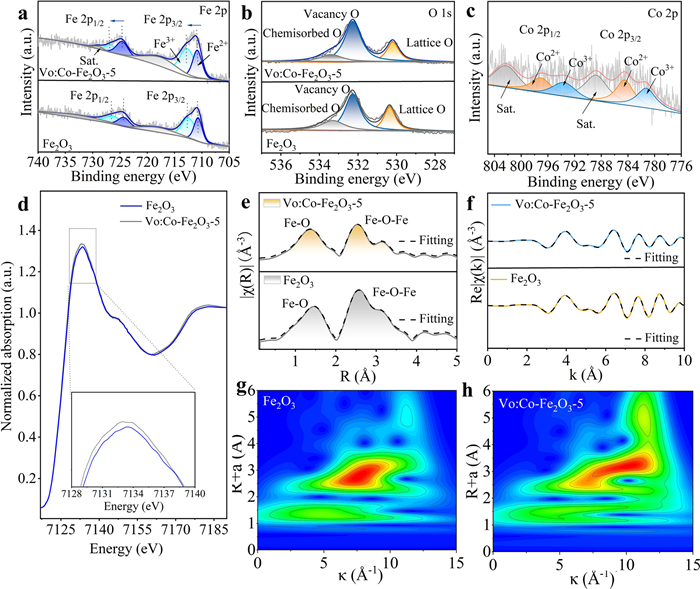
X-ray photoelectron spectroscopy (XPS) was performed to investigate the elemental states and electronic structure of Fe2O3 and Vo:Co-Fe2O3–5. As shown in the Fe 2p spectrum of Fe2O3 (Fig. 2a), the peaks at 710.71 eV (Fe 2p3/2) and 724.25 eV (Fe 2p1/2) correspond to Fe2+, while the doublet at 712.48 eV (Fe 2p3/2) and 726.47 eV (Fe 2p1/2) is attributed to Fe3+ [31,32]. Compared to Fe2O3, the binding energies of Fe2+ and Fe3+ in Vo:Co-Fe2O3–5 exhibit positive shifts, which suggests the electronic interaction between Co and Fe ions and the attenuation of electron cloud, inducing more positively charged Fe3+ ions in Vo:Co-Fe2O3–5. Consequently, the Fe ions in Vo:Co-Fe2O3–5 own lesser electrons than in pristine Fe2O3, which increases the electron affinity of Fe ions and thus facilitating N2 reduction via "acceptance-donation" mechanism [33]. Quantitative analysis of the Fe 2p spectra (Table S2 in Supporting information) reveals that the contents of Fe3+ and Fe2+ in Vo:Co-Fe2O3–5 are 63.7% and 37.3%. The increased Fe2+ content relative to pristine Fe2O3 is attributed to the generation of oxygen vacancy. The optimized Fe3+/Fe2+ ratio establishes a faster electron transport channel through Fe2+-O2--Fe3+ super exchange, promoting electron transport in the NRR process [34]. The O 1s spectra (Fig. 2b and Fig. S11 in Supporting information) are deconvoluted into three components at 530.2, 532.2, and 533.4 eV, which are assigned to the lattice oxygen (OL), vacancy oxygen (OV), and chemisorbed oxygen species (OC), respectively [35]. According to the integral area of O 1s spectra, the vacancy oxygen density increases with the amount of Co doping. The OV/(OL + OV + OC) ratio increases from 56.1% in Fe2O3 to 68.6% in Vo:Co-Fe2O3–5, confirming enhanced oxygen vacancy concentration, which is further supported by EPR spectroscopy (Fig. S12 in Supporting information). As such, the combination of more positively charged Fe3+ and increased oxygen vacancies in Vo:Co-Fe2O3–5 enhances its Lewis acid characteristic, benefiting N2 adsorption and reduction [36]. The Co 2p spectrum (Fig. 2c) confirms the presence of Co2+ and Co3+ in Vo:Co-Fe2O3–5 [37].
Figure 2
Figure 2.
(a) Fe 2p, (b) O 1s and (c) Co 2p XPS spectra of Fe2O3 and Vo:Co-Fe2O3–5. (d) XANES spectra, (e, f) Fourier transform spectroscopy and (g, h) Cauchy wavelet transform contour plots of Fe2O3 and Vo:Co-Fe2O3–5.
The oxidation state of Fe and its local coordination environment in Fe2O3 and Vo:Co-Fe2O3–5 were further probed using X-ray absorption near-edge structure (XANES) and extended X-ray absorption fine structure (EXAFS) spectroscopy. As shown in Fig. 2d, the Fe K-edge XANES spectra show that the absorption intensity at the absorption edge onset position of Vo:Co-Fe2O3–5 is consistent with Fe2O3, revealing the coexistence of Fe2+ and Fe3+ in the samples, which aligns with the XPS analysis [38,39]. Meanwhile, the white-line peak of Vo:Co-Fe2O3–5 is observed to be elevated, which may be attributed to the Fe (1s) → Fe (4p) transition. This result suggests that the (1s) → (4p) transition of Fe3+ in Vo:Co-Fe2O3–5 typically requires higher energy compared to pristine Fe2O3, because the energy level of the 4p orbital is upshifted in higher oxidation states, which further confirms that the incorporation of Co induces more positively charged Fe3+ in Vo:Co-Fe2O3–5 [40]. The radial distribution function curve of Vo:Co-Fe2O3–5 (Fig. 2e) shows a significant decrease in the intensity of the Fe-O and Fe-O-Fe shell peaks, further confirming the presence of defects. These defects likely result from local structural perturbations due to the introduction of Co dopants, which in turn affect the coordination environment of Fe (Fig. 2f and Table S3 in Supporting information). Further observations reveal that the Fe-O bond length in Vo:Co-Fe2O3–5 is longer than that of pristine Fe2O3, demonstrating that the interaction between Fe and oxygen atoms is weakened, which suggests the Fe-O bonds in Vo:Co-Fe2O3–5 are easier to be broken and consequently enhancing its reducibility [39]. Figs. 2g and h present the Cauchy wavelet transform (WT) EXAFS spectra of Fe2O3 and Vo:Co-Fe2O3–5. As depicted in WT contour plots, Vo:Co-Fe2O3–5 exhibits higher signal intensity at K values of ca. 2.5 Å and 3 Å than pristine Fe2O3, corresponding to the Fe-O and Fe-O-Fe bonds. This further indicates that the introduction of Co dopants regulates the local coordination environment of Fe, consistent with the EXAFS results [41–43].
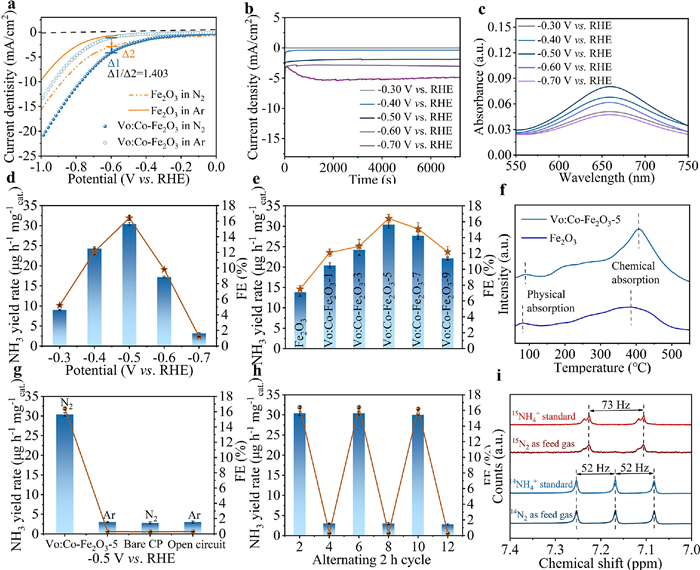
The NRR electrochemical experiments were carried out under ambient conditions in a H-type electrolytic cell configuration using N2-saturated 0.1 mol/L Na2SO4 as electrolyte. The indophenol blue method was used to quantitatively analyze the NH3 concentration (Fig. S13 in Supporting information). Linear scanning voltammetry (LSV) curves were acquired in Ar-/N2-saturated electrolyte. As shown in Fig. 3a, Vo:Co-Fe2O3–5 exhibits a higher current density in N2 atmosphere than in Ar atmosphere, suggesting the possible occurrence of NRR [44]. Moreover, the observed current density of Vo:Co-Fe2O3–5 is higher than that of Fe2O3 under the same potential in the N2-bubbled electrolyte, revealing a better NRR activity. The current difference in two electrolytes is significantly larger for Vo:Co-Fe2O3–5 than for pristine Fe2O3, with a proportion (△1/△2) of 1.403, suggesting that NRR becomes dominant while HER is suppressed due to the Co doping in the Fe2O3 catalyst. To quantitatively determine the NRR performance of Vo:Co-Fe2O3–5, chronoamperometry (Fig. 3b) and UV–vis tests (Fig. 3c) were conducted within the potential range of −0.30 V to −0.70 V vs. RHE. As shown in Fig. 3d, Vo:Co-Fe2O3–5 achieves the optimal NH3 yield rate (30.4 μg h-1 mgcat-1) and FE (16.4%) at −0.50 V vs. RHE. When the potential is more negative than −0.50 V vs. RHE, the NH3 yield rates and FEs of Vo:Co-Fe2O3–5 decreased significantly, likely due to the competitive HER dominating and blocking the surface-active sites, thereby inhibiting NRR [45]. For getting clearer comparison, the NH3 yields and FEs at an applied potential of −0.50 V vs. RHE were evaluated for pristine Fe2O3 and other Vo:Co-Fe2O3 samples. As shown in Fig. 3e, pristine Fe2O3 shows the low NH3 formation rate and FE. In contrast, the electrocatalytic activity of Vo:Co-Fe2O3 is significantly enhanced. The NH3 yields and FEs initially increase and then decrease with increasing Co doping content. Among all samples, Vo:Co-Fe2O3–5 achieves the highest NH3 yield and maximum FE, leading to a 2.2-fold increase compared to Fe2O3, and also outperforming most recently reported similar electrocatalysts (Table S4 in Supporting information). This improvement is ascribed to the optimal balance between Co doping ratio and surface oxygen vacancies density [46]. N2 temperature-programmed desorption (N2-TPD) measurements were conducted to access the N2 adsorption capabilities of Vo:Co-Fe2O3–5 and pristine Fe2O3. As illustrated in Fig. 3f, both samples display two peaks in the range of 50–500 ℃, corresponding to the desorption of physically and chemically adsorbed N2, respectively. Notably, Vo:Co-Fe2O3–5 shows higher desorption temperatures and larger peak areas for both physical and chemical adsorption of N2, highlighting the critical role of Co dopants in strengthening N2 adsorption. The wettability of the catalysts was evaluated via contact angle tests (Fig. S14 in Supporting information). The contact angle of Fe2O3 increases from ~37° to ~47° after Co doping, demonstrating improved hydrophobicity of Vo:Co-Fe2O3–5. The variation in surface wettability promotes N2 molecules and reduces direct proton adsorption during the electroreduction process, thereby improving NRR efficiency by suppressing the competitive HER.
Figure 3
Figure 3.
(a) LSV curves in 0.1 mol/L Na2SO4 electrolyte saturated with N2/Ar. (b) Chronoamperometry curves, (c) UV–vis spectra of electrolytes stained with the indophenol indicator. NH3 yields and FEs of (d) Vo:Co-Fe2O3–5 at different potentials and (e) various samples at the potential of −0.5 V. (f) N2-TPD profiles of Fe2O3 and Vo:Co-Fe2O3–5. (g) Amount of NH3 generated after charging at −0.5 V for 2 h under various conditions. (h) NH3 yields and FEs alternately cycled between the N2- and Ar saturated electrolytes for 2 h of Vo:Co-Fe2O3–5 at −0.5 V. (i) NMR spectra of the standard 15NH4+ and 14NH4+ samples and the electrolyte fed by 15N2 and 14N2 after electrolysis on Vo:Co-Fe2O3–5 at −0.5 V.
To verify the origin of the produced NH3 and eliminate the influence of possible NH3 contaminations, comparative experiments and 15N isotopic labeling experiments were carried out. As described in Fig. 3g, Vo:Co-Fe2O3–5 exhibits good NRR performance in 0.1 mol/L Na2SO4 electrolyte saturated with N2 at −0.50 V vs. RHE. However, only a trace amount of NH3 is detected under other controlled conditions. The alternately cycled electrocatalytic experiments (Fig. 3h) further demonstrate that NH3 is generated exclusively in N2-saturated electrolyte, confirming that the nitrogen in generated NH3 originates from the electrochemical reduction of N2 and Vo:Co-Fe2O3–5 plays a crucial role in this process [47]. 15N isotopic labeling experiment was performed to confirm the nitrogen source of the produced NH3. As shown in Fig. 3i, when using 14N2 as the feeding gas, the 1H nuclear magnetic resonance (NMR) spectra of the electrolyte display typical triplet peaks of 14NH4+ with a coupling constant of 52 Hz, matching the 1H NMR spectrum of standard 14NH4Cl. By feeding 15N2 gas during the electrocatalytic NRR, characteristic doublet peaks with a coupling constant of 73 Hz are observed in the 1H NMR spectra, consistent with the 1H NMR spectrum of standard 15NH4Cl. The 15N isotopic labeling experiment results firmly prove that the produced NH3 originates from the electrocatalytic NRR rather than NH3 contamination.
To further investigate the electrochemical reaction kinetics, Tafel plots were obtained. The lowest Tafel slope for Vo:Co-Fe2O3–5 implies its fastest interfacial reaction kinetics (Fig. S15 in Supporting information). Electrochemical impedance spectroscopy (EIS) reveals that the charge transfer impedance of Vo:Co-Fe2O3 is smaller than that of Fe2O3, suggesting that Co doping facilitates charge transfer kinetics (Fig. S16 in Supporting information) [48]. The electrochemical active surface area (ECSA) was further assessed via double-layer capacitance (Cdl) [49]. The Cdl of Vo:Co-Fe2O3–5 is larger than that of Fe2O3 (Figs. S17 and S18 in Supporting information), indicating more exposed active sites, which aligns with the Brunauer-Emmett-Teller (BET) surface area (Fig. S19 in Supporting information). The ECSA-normalized polarization curves (Fig. S18b) exhibit that Vo:Co-Fe2O3–5 shows a higher normalized current density than that of Fe2O3, suggesting its more favorable intrinsic activity. The competitive HER was monitored using in situ differential electrochemical mass spectrometry (DEMS) [50]. As illustrated in Fig. S20 (Supporting information), the H2 signal intensity for Vo:Co-Fe2O3–5 is lower than that for Fe2O3, confirming that Co doping effectively suppresses HER. The stability and reproducibility of Vo:Co-Fe2O3–5 were also investigated. As presented in Fig. S21 (Supporting information), the current density remains stable during the 50 h of continuous electrolysis, with negligible decline in NH3 yield and FE (inset in Fig. S21). Inductively coupled plasma mass spectrometry (ICP-MS) analysis (Fig. S22 in Supporting information) confirms no significant leaching of Co and Fe after the electrochemical process. After the stability tests, the structure, composition, and valence states of Vo:Co-Fe2O3–5 are well maintained (Figs. S23-S25 in Supporting information), indicating its good stability. Six consecutive cyclic tests show no significant decrease in NH3 yield or FE (Fig. S26 in Supporting information), demonstrating its excellent reproducibility.
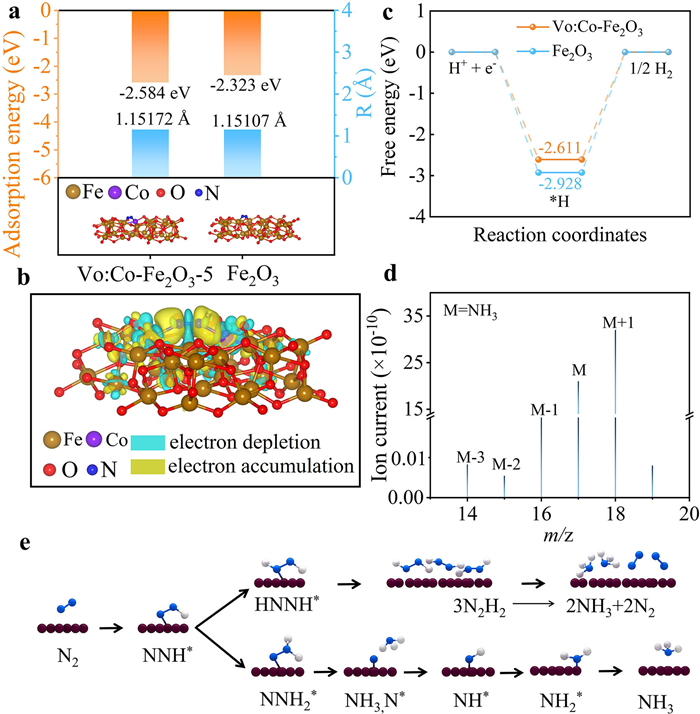
Density functional theory (DFT) calculations were performed to corroborate the experimental findings. The results suggest that N2 molecule preferentially adsorb on the oxygen vacancy of Vo:Co-Fe2O3 with a higher adsorption energy of −2.584 eV (Fig. 4a and Fig. S27 in Supporting information) compared to −2.323 eV for pure Fe2O3. This demonstrates that the Vo:Co-Fe2O3 surface has a stronger adsorption capacity than the Fe2O3 surface, in agreement with the experimental results. Compared to a free N2 molecule, the N—N bond of the adsorbed N2 is lengthened to 1.15172 Å, whereas on the Fe2O3 surface, the N—N bond length is 1.15107 Å. These results suggest that the N2 adsorption and activation are more favorable on the Vo:Co-Fe2O3 surface. This is further evidenced by the charge density difference plots in Fig. 4b, which show a weakened N≡N bond and electron enrichment between the nitrogen atoms. The Gibbs free-energy values of hydrogen adsorption (∆GH*) on the surface of Vo:Co-Fe2O3 and Fe2O3 are shown in Fig. 4c. The calculated ΔGH* values are −2.611 and −2.928 eV for Vo:Co-Fe2O3 and Fe2O3, demonstrating that the H* binding energy was regulated by Co doping. The above computational findings collectively confirm that the synergistic effect of Co doping and oxygen vacancies can significantly optimize the NRR performance of Vo:Co-Fe2O3 by regulating the HER and NRR.
Figure 4
Figure 4.
(a) Adsorption energy and structures of N2 adsorbed on Vo:Co-Fe2O3–Ov and Fe2O3–Ov surface. (b) Charge density difference plots of N2 adsorption on the Vo:Co-Fe2O3–Ov surface. (c) Free energy profile of HER on the Vo:Co-Fe2O3 and Fe2O3 surfaces. (d) Mass spectra obtained during NRR tests with Vo:Co-Fe2O3–5 at −0.5 V vs. RHE in N2-saturated 0.1 mol/L Na2SO4. (e) Possible reaction pathways of NRR on the surface of Vo:Co-Fe2O3–5.
Based on the above discussion, the improved NRR performance of Vo:Co-Fe2O3–5 is rationalized as follows: (1) The more positively charged Fe3+ ions and oxygen vacancies serve as Lewis acid sites to strength the chemisorption of N2 molecules [11,36]; (2) under electrocatalytic conditions, Fe3+ ions in the Vo:Co-Fe2O3–5 lattice acquire electrons to form Fe2+ ions, which is conducive to injecting electrons into the π* antibonding orbitals of N2, weakening the N≡N bond and promoting nitrogen activation [51]; (3) under the influence of Co doping and oxygen vacancies, the molar ratio of Fe3+/Fe2+ was optimized. The Fe3+/Fe2+ redox pathway establishes fast electron channels via super-exchange between Fe2+-O2--Fe3+ (Fig. S28 in Supporting information), enhancing hydrogenation efficiency at NRR active sites [34]. Finally, volatile intermediates and products during the electrochemical NRR were monitored using online DEMS. As shown in Fig. S29 (Supporting information), the absence of m/z signals at 27, 31, and 33 under −0.5 V vs. RHE in N2-saturated 0.1 mol/L Na2SO4 rules out N2H4 formation. Therefore, the m/z signal at 15 confirms the generation of NH3 (Fig. 4d) [52]. Importantly, no ammonia-related fragments were detected in Ar-saturated electrolyte, and the detected signal at m/z = 18 is assigned to H2O (Fig. S30 in Supporting information), indicating that the produced NH3 is derived from N2. Moreover, the signal corresponded to the N2H2 intermediate is detected at m/z = 30. Combining these results with the research by Shao et al., the possible reaction pathway for NRR on Vo:Co-Fe2O3–5 is proposed and illustrated in Fig. 4e. The absorbed N2 molecule on defective sites first initiates a two-electron reduction to form N2H2* intermediates, which subsequently undergo desorption and cleavage to form NH3 (3N2H2 → 2NH3 + 2N2) [53]. Nevertheless, the competing distal associative route cannot be completely excluded, which involves the sequential protonation at the terminal N atom, followed by NH3 desorption and subsequent hydrogenation for another NH3 molecule [54–56].
In summary, defect-engineered Fe2O3 with tunable oxygen vacancy concentrations was successfully synthesized through a facile one-step hydrothermal method via cobalt incorporation, which was proven to serve as an efficient noble metal-free catalyst to achieve the electrochemical N2-to-NH3 conversion under ambient conditions. The Vo:Co-Fe2O3–5 catalyst with the optimal Co dopant amount exhibited a high NH3 yield rate of 30.4 μg h-1 mg-1cat. and a large FE of 16.4% at −0.5 V vs. RHE in 0.1 mol/L Na2SO4, which is significantly better than bare Fe2O3. The superior NRR electrocatalytic performance of Vo:Co-Fe2O3–5 results from the rich active sites induced by Co dopants and the balance of Co doping ratio and surface oxygen vacancies density. Specifically, the doping of Co atoms generated abundant oxygen vacancy and regulated the electronic structures of Fe2O3, which provided rich active sites for N2 chemisorption and subsequent activation by promoting the interfacial electron transfer from catalysts to the adsorbed N2 molecules. Moreover, the competitive HER process could be effectively restrained, responsible for the remarkable electrocatalytic activity of Vo:Co-Fe2O3–5.
The authors declare that they have no known competing financial interests or personal relationships that could have appeared to influence the work reported in this paper.
Acknowledgments
This work is financially supported by the Program for the Development of Science and Technology of Jilin Province (No. 20240101004JJ), the National Natural Science Foundation of China (No. 52471229), and the Science and Technology Project of Jilin Provincial Education Department (No. JJKH20250931KJ).
Supplementary materials
Supplementary material associated with this article can be found, in the online version, at doi:10.1016/j.cclet.2026.112580.
Figure 1
(a) Synthesis schematic illustration of Vo:Co-Fe2O3. (b) XRD patterns of Fe2O3 and Vo:Co-Fe2O3–5. (c-e) SEM images, (f) TEM, (g) HRTEM (the inset shows SAED pattern) and (h-l) the corresponding elemental mapping images of Vo:Co-Fe2O3–5.
Figure 2
(a) Fe 2p, (b) O 1s and (c) Co 2p XPS spectra of Fe2O3 and Vo:Co-Fe2O3–5. (d) XANES spectra, (e, f) Fourier transform spectroscopy and (g, h) Cauchy wavelet transform contour plots of Fe2O3 and Vo:Co-Fe2O3–5.
Figure 3
(a) LSV curves in 0.1 mol/L Na2SO4 electrolyte saturated with N2/Ar. (b) Chronoamperometry curves, (c) UV–vis spectra of electrolytes stained with the indophenol indicator. NH3 yields and FEs of (d) Vo:Co-Fe2O3–5 at different potentials and (e) various samples at the potential of −0.5 V. (f) N2-TPD profiles of Fe2O3 and Vo:Co-Fe2O3–5. (g) Amount of NH3 generated after charging at −0.5 V for 2 h under various conditions. (h) NH3 yields and FEs alternately cycled between the N2- and Ar saturated electrolytes for 2 h of Vo:Co-Fe2O3–5 at −0.5 V. (i) NMR spectra of the standard 15NH4+ and 14NH4+ samples and the electrolyte fed by 15N2 and 14N2 after electrolysis on Vo:Co-Fe2O3–5 at −0.5 V.
Figure 4
(a) Adsorption energy and structures of N2 adsorbed on Vo:Co-Fe2O3–Ov and Fe2O3–Ov surface. (b) Charge density difference plots of N2 adsorption on the Vo:Co-Fe2O3–Ov surface. (c) Free energy profile of HER on the Vo:Co-Fe2O3 and Fe2O3 surfaces. (d) Mass spectra obtained during NRR tests with Vo:Co-Fe2O3–5 at −0.5 V vs. RHE in N2-saturated 0.1 mol/L Na2SO4. (e) Possible reaction pathways of NRR on the surface of Vo:Co-Fe2O3–5.


 DownLoad:

 下载:


 下载:

