Received Date:
02 January 2025 Accepted Date:
05 March 2025 Revised Date:
27 February 2025 Available Online:
15 June 2026
Abstract:
The limited stability of Pt-based catalysts as a result of irreversible support corrosion and Pt dissolution/aggregation remains a major barrier to the widespread deployment for Proton exchange membrane fuel cells. To overcome the issues, amorphous TaOx with corrosion-resistance was introduced to stabilize Pt nanoparticles in this work. Benefiting from the strong metal-support interaction, Pt oxidation and dissolution is suppressed through efficient electron transfer from the support. Optimized Pt/TaOx-C catalyst shows remarkable stability with voltage loss @0.8 A/cm2 of only 29 mV after 50k cycles accelerated durability test, which is much lower than the goal for DOE 2025 (30 mV after 30k cycles). Besides, the strong anchoring effect of the amorphous TaOx enables well dispersion of Pt with an ultra-small particle size of approximately 1.3 nm, reducing the local mass transfer resistance towards superior fuel cell performance of 2.29 W/cm2, which is higher than the commercial Pt/C of 1.56 W/cm2. This study offers a highly active and durable cathode electrocatalyst for fuel cells.
As a clean and efficient energy conversion technology, proton exchange membrane fuel cells (PEMFCs) are capable of converting the chemical energy stored in hydrogen into electrical energy directly without carbon emissions, bypassing the limitations imposed by the Carnot cycle [1–4]. As a result, PEMFCs have shown significant application potential in transportation, household power supply, and portable devices [5]. One of the key reactions in fuel cell technology is the sluggish oxygen reduction reaction (ORR) at cathode [6,7]. Commonly, platinum (Pt) and its alloys have been the primary catalysts for ORR in fuel cells. However, the high cost and limited availability of Pt hampered the widespread commercialization of PEMFCs. Consequently, reducing the reliance on Pt-based catalysts is essential to making PEMFCs more economically viable and accelerating their large-scale deployment [8–11]. In this regard, a variety of strategies, including reducing size [12,13], alloying [14,15] and morphology modulation [16–18] have been employed to increase the activity of Pt-based catalysts towards reduced Pt loading. Huang et al. [19] devised a PtCo nanocatalyst for ORR comprising membrane electrodes with high power density up to 13.2 W/mgPt, which far exceeds the current target proposed by the United States Department of Energy (DOE) (8 W/mgPt). The activity of Pt-based catalysts has been significantly enhanced, thereby necessitating the attainment of a balance between high activity and long-lasting stability at low loading for the commercialization of fuel cells. The carbon support corrosion and oxidation/dissolution of Pt nanoparticles are regarded as the two major degradation mechanisms [20]. And agglomeration and Ostwald ripening of the catalyst is another significant contributor to performance loss [21].
Targeting the durability challenge Pt-based catalyst faced with, researchers have developed numerous structural regulations, such as intermetallic compound formation [22–25], construction of core-shell structure [26–30], introducing inert metals [31] and support materials modification [32–34]. Among them, developing corrosion-resistant supports is more appealing as it can address the carbon corrosion issue fundamentally [35–37]. Various support materials, including metal oxides (e.g., SnOx, TiOx) [38–41], nitrides (e.g., TiN, VN) [42,43] and carbides (e.g., WC, MoC) [44–47] have demonstrated capable of enhancing the stability of Pt-based electrocatalysts. However, the poor electrical conductivity of the supports restricts the full expression of the catalyst performance. Despite the fact that studies have also combined them with carbon materials, the Pt nanoparticles could not be uniformly distributed and were observed heavily agglomerated. The interfacial interaction between Pt and support was insufficient and prone to particles aggregation [48].
Herein, to strengthen the interfacial interaction and alleviate the agglomeration, amorphous TaOx with abundant oxygen vacancies was utilized for anchoring Pt nanoparticles tightly, enabling the uniform growth of ultra-small Pt clusters with 1.3 nm. Besides, the strengthened metal-support interaction inhibited over-oxidation and dissolution of Pt through electron transfer from TaOx to Pt nanoparticles. Owing to these attributes, the as-developed catalyst showed outstanding stability with a negligible half-wave potential decay after 90k cycles between 0.6 V and 1.0 V in three-electrode system. When integrated into membrane electrode assembly (MEA), the catalyst exhibited a retention rate of 90% for power density following 50k accelerated durability tests (ADT) cycles at both H2/O2 and H2/Air condition. This study not only addressed the stability issues of Pt-based catalysts for PEMFCs, but also offered a promising avenue for designing ultra-small nanoparticles supported on metal oxide.
The synthetic procedure of the Pt/TaOx-C catalysts is schematically illustrated in Fig. S1 (Supporting information). Firstly, the support was obtained by thermal reduction. And the catalyst was achieved through pH-based reflux reduction of ethylene glycol (EG). To be specific, a solution of prepared TaOx-C in ethylene glycol was sonicated for 2 h, H2PtCl6 (7.4 mg/mL) was added and stirred. And then the pH of solution was adjusted by 0.1 mol/L NaOH. Subsequently, the resulting solution was refluxed at 130 ℃ for 3 h. Once the temperature had cooled to room temperature, the product was filtered and washed.
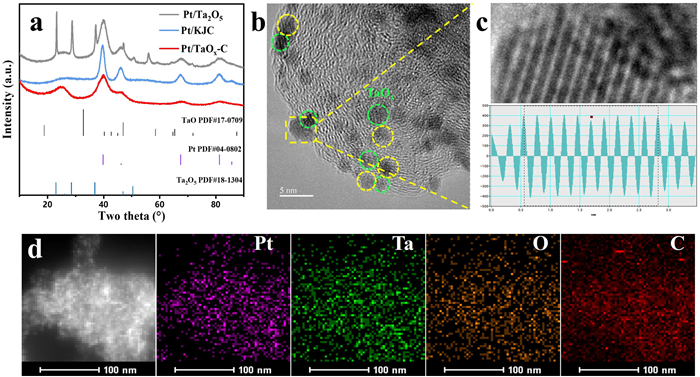
The carbon source was selected to be KJ-300 with numerous mesopores. These nanopores were able to regulate the growth of TaOx through space-confinement effect, thus facilitating the formation of amorphous TaOx with small particle size. Both the X-ray diffraction (XRD) spectra and transmission electron microscopy (TEM) images confirmed the successful preparation of amorphous TaOx nanoparticles embedded into the pores of carbon matrix (Figs. S2-S4 in Supporting information). Amorphous TaOx provided considerable nucleation sites for the uniform deposition of Pt nanoparticles with ultra-small size of about 1.3 nm, much smaller than that of Pt/KJ (2.3 nm) and Pt/Ta2O5 (3.9 nm), suggesting a higher atomic utilization for Pt/TaOx-C (Fig. 1a and Figs. S5-S7 in Supporting information). As shown in high resolution TEM (HRTEM), the majority Pt nanoparticles are located on the amorphous TaOx, and lattice fringes of 0.221 nm were attributed to the (111) plane of Pt nanoparticles (Figs. 1b and c). The overlapping distribution of Pt and Ta from the energy-dispersive X-ray spectroscopy (EDS) results (Fig. 1d) further confirmed that Pt nanoparticles were predominantly deposited on TaOx.
Figure 1
Figure 1.
(a) XRD patterns of Pt/KJ, Pt/TaOx-C and Pt/Ta2O5. (b) HRTEM images of Pt/TaOx-C. (c) Enlargement (top) and intensity profiles (bottom) of Pt (111) in the yellow dotted line frame of Fig. 2b. (d) EDS mapping of Pt/TaOx-C.
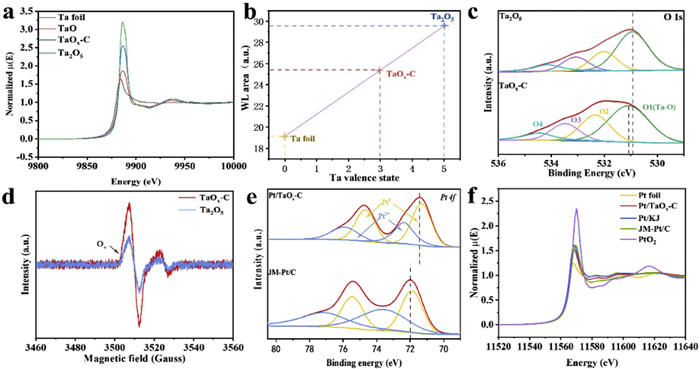
X-ray photoelectron spectroscopy (XPS) and X-ray absorption near edge structure (XANES) were used to check the interaction between Pt nanoparticles and TaOx-C support. As shown in Fig. S8 (Supporting information), Ta 4f peak for TaOx-C (26 eV) exhibited a negative shift of 0.7 eV compared with that of Ta2O5 (26.7 eV), demonstrating a lower valence state of Ta in the TaOx-C. In line with the XPS analysis, the Ta L3-edge XANES spectra revealed that the adsorption edge of Ta in TaOx-C situated between the TaO (+2) and the Ta2O5 (+5) (Fig. 2a, Fig. S9 and Table S1 in Supporting information), and the valence state of Ta could be obtained by the first derivative of normalized XANES spectra [49]. The average extrapolated valence of Ta was calculated to be 2.98 for TaOx-C (Fig. 2b), implying the presence of oxygen vacancy. It is noteworthy that TaOx-C exhibited a more pronounced O 1s XPS peak at 532.4 eV (peak area increased from 20.5% to 24.8%), which is ascribed to the presence of low oxygen coordination defects (Fig. 2c). Besides, electron paramagnetic resonance (EPR) presented in Fig. 2d also showed higher concentration of oxygen vacancies in TaOx-C. These results indicated that TaOx-C is in electron-rich and has capacity to offer electron to Pt particles. Notably, the 4f binding energy of Ta in Pt/TaOx-C shifted positively relative to that in TaOx-C, indicating electron transfer from TaOx-C to Pt, or in other words, a strong metal-support interaction (SMSI) (Fig. S10 in Supporting information). Accordingly, the Pt 4f peaks for Pt/TaOx-C (71.40 eV) shifted negatively compared to commercial Pt/C (71.96 eV) (Fig. 2e). The presence of SMSI in the Pt/TaOx-C catalyst was further verified by conducting Pt L3 edge XANES spectroscopy. As illustrated in Fig. 2f, the Pt L3 edge white line intensity in Pt/TaOx-C was lower than those of Pt/KJ and JM-Pt/C. The above results strongly proved that the amorphous TaOx support can donate electron to the deposited Pt nanoparticles, contributing to the higher anti-oxidation capacity, which is crucial for achieving superior catalytic stability. Besides, the enrichment of low-valence Pt species was favorable for catalyst to express higher performance.
Figure 2
Figure 2.
(a) Ta L3-edge for Ta foil, TaO, TaOx-C and Ta2O5. (b) Extrapolate the valence state of Ta. White line position as a function of the oxidation states of Ta for Pt/TaOx-C, with metallic Ta foil (0) and Ta2O5 (+5) as standard. (c) High resolution XPS spectra O 1s for Ta2O5 and TaOx-C. (d) EPR spectra of Ta2O5 and TaOx-C. (e) Pt 4f for Pt/Ta2O5 and Pt/TaOx-C. (f) Pt L3-edge for Pt foil, PtO2, Pt/TaOx-C, Pt/KJ, and JM-Pt/C.
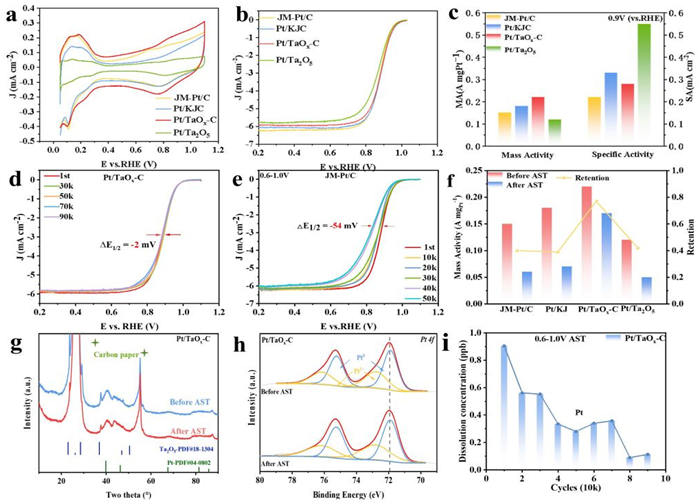
A series of electrochemical tests were performed to evaluate the oxygen reduction performance of the Pt/TaOx-C catalyst. These tests include cyclic voltammetry (CV) and linear sweep voltammetry (LSV), which were carried out using a rotating disk electrode in a standard three-electrode system (Figs. 3a and b). The electrochemical surface area (ECSA) of the catalyst was determined using the Hupd method, yielding a value of 72.5 m2/g for Pt/TaOx-C, much bigger than those of Pt/KJ (54.3 m2/g) and Pt/Ta2O5 (21.2m2/g), indicating more accessible active sites and higher Pt utilization efficiency in Pt/TaOx-C. The ORR polarization curve revealed that the half-wave potential (E1/2) of Pt/TaOx-C was 0.885 V. To assess the activity of catalyst, the kinetic current density was normalized by both the Pt loading mass and the ECSA at 0.9 V. The mass activity (MA) and specific activity (SA) of Pt/TaOx-C were calculated to be 0.22 A/mgPt and 0.28 mA/cm2, respectively, higher than those of the JM-Pt/C catalyst (0.15 A/mgPt and 0.22 mA/cm2) (Fig. 3c and Table S2 in Supporting information). These results suggested that the activity of Pt in Pt/TaOx-C is enhanced, likely due to electron transfer between Pt and TaOx, which effectively modulates the electronic structure of Pt surface. Notably, Pt/TaOx-C exhibited the smallest Tafel slope, demonstrating its superior catalytic activity (Fig. S11 in Supporting information). To further investigate the reaction mechanism, LSV tests were conducted at varying rotational speeds to determine the electron transfer number (Fig. S12 in Supporting information). The electron transfer number for Pt/TaOx-C was calculated to be 4, which is consistent with the expected direct four-electron reaction mechanism.
Figure 3
Figure 3.
(a) Cyclic voltammetry curves and (b) ORR polarization curves of JM-Pt/C, Pt/KJC, Pt/TaOx-C and Pt/Ta2O5.(c) Comparison of mass activity and specific activity for Pt–TaOx-C, Pt/KJ, JM-Pt/C and Pt/Ta2O5 at 0.9 V. (d) Pt/TaOx-C and (e) JM-Pt/C O2 LSV curves before and after stability tests between 0.6–1.0 V. (f) Change and retention of mass activity before and after stability testing of JM-Pt/C, Pt/KJ, Pt/TaOx-C and Pt/Ta2O5. (g) Changes in XRD spectra of Pt/TaOx-C before and after stability tests. (h) Changes in XPS spectra of Pt for Pt/TaOx-C before and after stability tests. (i) Dissolution concentration of Pt during stability testing.
An accelerated stability test (AST) was conducted to evaluate the durability of the Pt/TaOx-C electrocatalyst. After 90k cycles within the potential range of 0.6–1.0 V, the Pt/TaOx-C catalyst exhibited negligible decay (only 2 mV) in its half-wave potential (Fig. 3d), which significantly outperforms JM-Pt/C, Pt/KJC, and Pt/Ta2O5 (54, 30 and 50 mV, respectively, after 50k cycles) (Fig. 3e, Figs. S13 and S14, Table S3 in Supporting information). Moreover, the Pt/TaOx-C electrocatalyst retained 77% of its initial mass activity after AST, while Pt/KJC, JM-Pt/C and Pt/Ta2O5 catalysts retained only 39%, 40% and 42%, respectively (Fig. 3f). The superior stability of Pt/TaOx-C could be ascribable to the increased electron density at Pt sites as a result of electron transfer from TaOx-C support to Pt, which inhibits the oxidation of active Pt, accelerates desorption of oxygen species and consequently lowers the coverage. Further physical characterization of catalyst confirmed the high structural stability of Pt/TaOx-C. XRD patterns display that the crystalline structure remained intact, implying no distinct structure reconstruction (Fig. 3g). The higher stability of the Pt/TaOx-C catalysts was further corroborated by slight aggregation after AST (Fig. S15 in Supporting information). XPS analysis before and after the stability test revealed that the binding energy of Pt in Pt/TaOx-C remained unchanged and the Ta 4f peak exhibited a positive shift, suggesting the electron transfer from support to Pt nanoparticles towards inhibited oxidation of Pt (Fig. 3h and Fig. S16 in Supporting information). In contrast, the Pt 4f peak of Pt/KJC shifted to a higher binding energy, corresponding to the oxidized species (Fig. S17 in Supporting information). Meanwhile, the dissolution of the Pt/TaOx-C was significantly lower than that of the Pt/KJ, indicating that the Pt/TaOx-C composite exhibits superior antioxidant dissolution properties (Fig. 3i and Fig. S18 in Supporting information). In order to verify the antioxidant ability of TaOx-C further, AST was carried out on Pt/TaOx-C and Pt/KJ, respectively, between 1.0–1.5 V. Impressively, the half-wave potential of Pt/TaOx-C only diminishes by 4 mV after 20,000 cycles operation, whereas Pt/KJ shows performance degradation of 13 mV (Figs. S19 and S20 in Supporting information). This suggests that TaOx-C exhibits enhanced corrosion resistance and mitigates the catalytic loss due to carbon corrosion at high potentials. In a short, oxidation resistance of Pt was improved because of electron transfer from /TaOx-C.
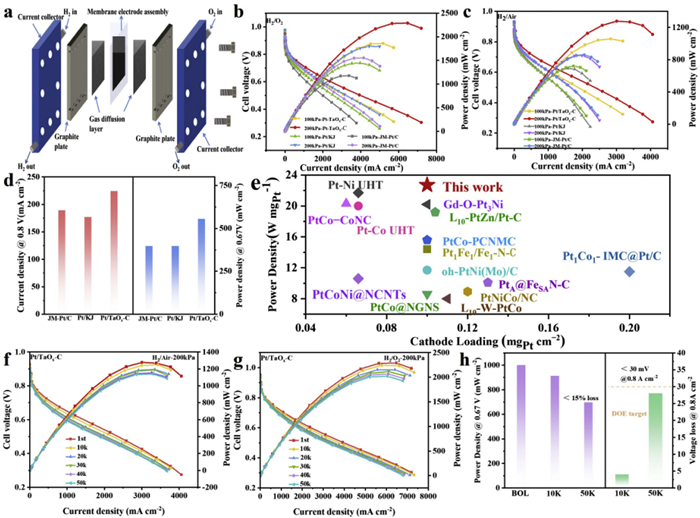
To further assess the potential practicability of Pt/TaOx-C catalysts in fuel cell applications, we assembled membrane electrode assembly (MEA) with Pt/TaOx-C as the cathode and commercial Pt/C as the anode (Fig. 4a). The Pt loading was kept to be 0.10 mg/cm2 in both cathode and anode. Additionally, Pt/KJ and JM-Pt/C MEA with the same Pt loading were also prepared for comparative analysis [50]. As shown in Fig. 4b, the Pt/TaOx-C cathode achieved a peak power density of 2.29 W/cm2 under H2-O2 conditions, far superior to the JM-Pt/C (1.56 W/cm2) and Pt/KJ (1.8 W/cm2). The polarization curves of Pt/TaOx-C under H2-O2 conditions exhibited higher current densities across the entire voltage range, particularly in the high voltage region (>0.7 V). To better simulate real operating conditions, the MEA performance was evaluated under H2/Air conditions. As shown in Fig. 4c, Pt/TaOx-C delivered peak power densities of 1.06 W/cm2 at 100 kPa and 1.28 W/cm2 at 200 kPa, surpassing the performance of commercial Pt/C (0.72 W/cm2 at 100 kPa, 0.86 W/cm2 at 200 kPa) and Pt/KJ (0.69 W/cm2 at 100 kPa, 0.85 W/cm2 at 200 kPa). Notably, the cell with commercial Pt/C and Pt/KJ as cathode, demonstrated pronounced mass transfer polarization in the high current density region, resulting in decreased performance with current density of <3000 mA/cm2. While the Pt/TaOx-C-assembled MEA exhibited negligible mass transfer resistance, delivering high current density beyond 4000 mA/cm2. This is because that the Pt loading drops below 0.12 mgPt/cm2, the localized mass transfer resistance becomes the main cause of performance degradation, which can be effectively improved by increasing the active site density via reducing particle size [51,52]. Pt/TaOx-C catalyst comprises ultra-small Pt particles with high atom utilization, and the effective mass transfer space is fully employed, which is helpful to fully increase the distribution density of active sites in the catalytic layer, drastically reduce the local mass transfer demand of each particle, and facilitate the reaction of oxygen on the Pt surface, contributed to the improvement of the performance of the precious metal catalysts with low loading of PEMFC at high current densities [53,54].
Figure 4
Figure 4.
(a) PEMFCs sketch. (b) Polarization and power density curves of Pt/TaOx-C, JM-Pt/C and Pt/KJ in H2−Air fuel cells at 80 ℃ with 100 and 200 kPa back pressure and 100% RH with the cathode metal loading of 0.1 mgPt/cm2. (c) Polarization and power density curves of Pt/TaOx-C, JM-Pt/C, Pt/KJ in H2−O2 fuel cells at 80 ℃ with 100 and 200 kPa back pressure and 100% RH with the cathode metal loading of 0.1 mgPt/cm2. (d) The comparison of the current density at 0.8 V and the power density at 0.67 V for Pt/TaOx-C, JM-Pt/C and Pt/KJ in H2-Air mode. (e) Comparison of peak power density between Pt/TaOx-C with the state-of-art in the literature. (f) Polarization and power density curves of Pt/TaOx-C in H2−Air fuel cells at 80 ℃ with 200 kPa back pressure and 100% RH with the cathode metal loading of 0.1 mgPt/cm2 after 10k, 20k, 30k, 40k and 50k potential cycles. (g) Polarization and power density curves of Pt/TaOx-C in H2−O2 fuel cells at 80 ℃ with 200 kPa back pressure and 100% RH with the cathode metal loading of 0.1 mgPt/cm2 after 10k, 20k, 30k, 40k and 50k potential cycles. (h) Power density at 0.67 V and voltage loss at 0.8 A/cm2 at the begin of life (BOL), 10k and 50k. Note: The yellow dashed line indicates the DOE target for voltage drop at 0.8 A/cm2 after 30k potential cycles.
Further analysis of the power output at 0.67 V, a voltage relevant for practical fuel cell operation, was conducted to assess the performance under realistic conditions. As shown in Fig. 4d, Pt/TaOx-C demonstrated current density of 224 mA/cm2 and power density of 554 mW/cm2 at 0.67 V, which is significantly higher than the values for commercial Pt/C (189 mA/cm2, 396.7 mW/cm2) and Pt/KJ (177 mA/cm2, 396.5 mW/cm2). After normalizing the performance to the cathode Pt loading, Pt/TaOx-C was rated at 22.9 W/mgPt, surpassing most of the state-of-art Pt-based catalysts (Fig. 4e and Table S4 in Supporting information), further emphasizing its exceptional catalytic efficiency.
To further assess the long-term stability of Pt/TaOx-C, which was subjected to AST with 50k potential cycles in the 0.6–0.95 V range, simulating the practical operation. As shown in Figs. 4f and g, the power density of Pt/TaOx-C under both H2/Air and H2/O2 conditions showed minimal decrease after AST, in comparison to JM-Pt/C and Pt/KJ, demonstrating superior MEA stability (Figs. S21–S24 in Supporting information). Furthermore, Pt/TaOx-C retained >80% of its initial power at 0.67 V and exhibited only 29 mV voltage loss at 0.8 A/cm2, meeting the DOE 2025 target for this condition (Fig. 4h). In contrast, Pt/KJ showed >40% power loss at 0.67 V and approximately 60 mV voltage drop at 0.8 A/cm2 (Fig. S25 and Table S5 in Supporting information). Both the initial and post-aging performance of Pt/TaOx-C remained at high levels. In conclusion, AST results demonstrate that the introduction of amorphous TaOx support can effectively stabilize Pt nanoparticles and greatly prolong the performance of the lifespan, providing evidence of its practical application in fuel cells.
In this study, amorphous TaOx has been developed by confinement effect of porous carbon to stabilize Pt nanoparticles. The strong interaction between TaOx-C and Pt nanoparticles enables electron transfer from support to Pt, inhibiting the dissolution and oxidation of Pt nanoparticles. After 50k AST cycles in MEA, the voltage loss at 0.8 A/cm2 is only 29 mV. Besides, amorphous TaOx with abundant oxygen vacancies facilitates the nanoscale dispersion of Pt nanoparticles with an ultra-small particle size of approximately 1.3 nm, achieving high atomic efficiency and alleviating the problem of local mass transfer, which enables the catalyst express impressive activity of normalized power up to 22.9 W/mgPt, surpassing the DOE targets. This strategy presents a novel and promising approach to develop metal oxides as support, offering significant potential for practical fuel cell applications.
Declaration of competing interest
The authors declare that they have no known competing financial interests or personal relationships that could have appeared to influence the work reported in this paper.
Thank the National Natural Science Foundation of China (Nos. 22272160, U23A20137), the Jilin Province Science and Technology Development Program (Nos. 20210502002ZP, YDZJ202202CXJD011, 20240101019JC), Changchun Science and Technology Development Program (No. 23GZZ02), for financial support. Thank the Shanghai Synchrotron Radiation Facility for conducting the X-ray absorption spectroscopy experiments at BL11B station.
Supplementary materials
Supplementary material associated with this article can be found, in the online version, at doi:10.1016/j.cclet.2025.111044.
[1]
H. Cruz-Martínez, H. Rojas-Chávez, P.T. Matadamas-Ortiz, et al., Mater. Today Phys. 19 (2021) 100406. doi: 10.1016/j.mtphys.2021.100406
[2]
Z. Ma, Z.P. Cano, A. Yu, et al., Angew. Chem. Int. Ed. 59 (2020) 18334–18348. doi: 10.1002/anie.202003654
V. Yarlagadda, M.K. Carpenter, T.E. Moylan, et al., ACS Energy Lett. 3 (2018) 618–621. doi: 10.1021/acsenergylett.8b00186
Figure 1
(a) XRD patterns of Pt/KJ, Pt/TaOx-C and Pt/Ta2O5. (b) HRTEM images of Pt/TaOx-C. (c) Enlargement (top) and intensity profiles (bottom) of Pt (111) in the yellow dotted line frame of Fig. 2b. (d) EDS mapping of Pt/TaOx-C.
Figure 2
(a) Ta L3-edge for Ta foil, TaO, TaOx-C and Ta2O5. (b) Extrapolate the valence state of Ta. White line position as a function of the oxidation states of Ta for Pt/TaOx-C, with metallic Ta foil (0) and Ta2O5 (+5) as standard. (c) High resolution XPS spectra O 1s for Ta2O5 and TaOx-C. (d) EPR spectra of Ta2O5 and TaOx-C. (e) Pt 4f for Pt/Ta2O5 and Pt/TaOx-C. (f) Pt L3-edge for Pt foil, PtO2, Pt/TaOx-C, Pt/KJ, and JM-Pt/C.
Figure 3
(a) Cyclic voltammetry curves and (b) ORR polarization curves of JM-Pt/C, Pt/KJC, Pt/TaOx-C and Pt/Ta2O5.(c) Comparison of mass activity and specific activity for Pt–TaOx-C, Pt/KJ, JM-Pt/C and Pt/Ta2O5 at 0.9 V. (d) Pt/TaOx-C and (e) JM-Pt/C O2 LSV curves before and after stability tests between 0.6–1.0 V. (f) Change and retention of mass activity before and after stability testing of JM-Pt/C, Pt/KJ, Pt/TaOx-C and Pt/Ta2O5. (g) Changes in XRD spectra of Pt/TaOx-C before and after stability tests. (h) Changes in XPS spectra of Pt for Pt/TaOx-C before and after stability tests. (i) Dissolution concentration of Pt during stability testing.
Figure 4
(a) PEMFCs sketch. (b) Polarization and power density curves of Pt/TaOx-C, JM-Pt/C and Pt/KJ in H2−Air fuel cells at 80 ℃ with 100 and 200 kPa back pressure and 100% RH with the cathode metal loading of 0.1 mgPt/cm2. (c) Polarization and power density curves of Pt/TaOx-C, JM-Pt/C, Pt/KJ in H2−O2 fuel cells at 80 ℃ with 100 and 200 kPa back pressure and 100% RH with the cathode metal loading of 0.1 mgPt/cm2. (d) The comparison of the current density at 0.8 V and the power density at 0.67 V for Pt/TaOx-C, JM-Pt/C and Pt/KJ in H2-Air mode. (e) Comparison of peak power density between Pt/TaOx-C with the state-of-art in the literature. (f) Polarization and power density curves of Pt/TaOx-C in H2−Air fuel cells at 80 ℃ with 200 kPa back pressure and 100% RH with the cathode metal loading of 0.1 mgPt/cm2 after 10k, 20k, 30k, 40k and 50k potential cycles. (g) Polarization and power density curves of Pt/TaOx-C in H2−O2 fuel cells at 80 ℃ with 200 kPa back pressure and 100% RH with the cathode metal loading of 0.1 mgPt/cm2 after 10k, 20k, 30k, 40k and 50k potential cycles. (h) Power density at 0.67 V and voltage loss at 0.8 A/cm2 at the begin of life (BOL), 10k and 50k. Note: The yellow dashed line indicates the DOE target for voltage drop at 0.8 A/cm2 after 30k potential cycles.

 DownLoad:

 下载:
下载:


 下载:
下载:
