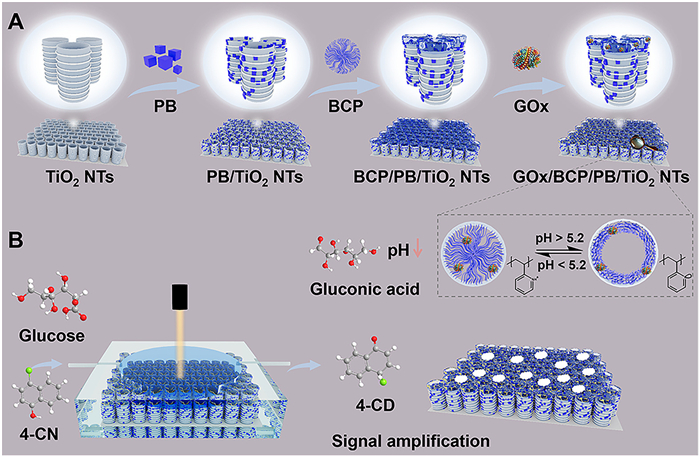
Scheme 1.
(A) Fabrication scheme of GOx/BCP/PB/TiO2 NTs. (B) Design of F–P sensor for glucose detection.

Engineering a pH-responsive Fabry–Pérot interferometer for real-time glucose sensing
Hairihan Zhou , Yue Zhang , Shujia Wang , Zhida Gao , Chenxi Zhao , Pei Song , Xiaona Li , Yan-Yan Song


Diabetes mellitus, affecting approximately 10% of the global population [1]. The primary methods for glucose detection include spectrophotometry, colorimetry, and electrochemical techniques, each with its own advantages [2–4]. However, these techniques have practical limitations, such as high equipment costs, complicated procedures, and the need for specialized personnel. Even though the development of rapid, sensitive, cost-effective, and stable methods for detecting glucose has remained a hot topic for researchers in recent years [5–7], exploring new high-sensitivity and low-cost techniques for glucose detection is still desirable.
The Fabry–Pérot (F–P) interferometer, recognized as a versatile platform, is well suited for various sensing and biosensing applications [8]. The reflective interferometric Fourier transform spectroscopy (RIFTS) technique exploits the optical behavior of a porous medium across the visible light spectrum. In practice, F–P fringes define the reflection spectrum of the porous medium, facilitating the extraction of spectral frequencies via fast Fourier transform (FFT) analysis. Among the peaks revealed by this analysis, the predominant signal provides information on the effective optical thickness (EOT) of the F–P interferometer. In this content, when analytes permeate the porous medium, they introduce changes in the refractive index, thus leading to variations in the EOT. RIFTS can effectively monitor these changes in optical properties, providing an accurate approach for detecting variations in the average refractive index within the porous cavities [9–12].
Amphiphilic block copolymer (BCP) films, with their tunable and multifunctional macromolecular segments, outperform traditional inorganic materials possessing uniform functional groups [13]. One- and two-dimensional nanofluidic channels with specific functions have been created by manipulating the self-assembled structures of BCP films [14,15]. For instance, polystyrene-b-poly(4-vinylpyridine) (b-P4VP)-based BCP films have demonstrated outstanding pH-responsive conformational transformation abilities. For example, they showed a switchable transition from a collapsed, neutral, and hydrophobic state at pH above the pKa of b-P4VP (5.2) to a swollen, positively charged, and hydrophilic state at pH below this threshold [16].
In this study, using a b-P4VP-based BCP film as pH- responsive coating, we developed an optical sensor for real-time glucose detection on TiO2 nanotube arrays (NTs) with F–P interference features. Integrating TiO2 NTs with optical interference capabilities, pH-sensitive BCP, and enzymatic reactions, the sensor exhibited sensitivity and selectivity for glucose detection. In this F–P interferometer design, gluconic acid and H2O2, as the products of glucose oxidation by glucose oxidase (GOx), were employed to induce changes in the RIFTS signal. For example, gluconic acid was used to cause the BCP coating to undergo a volumetric expansion (swelling); H2O2 oxidized 4–chloro-1-naphthol (4-CN) to the insoluble 4–chloro-1,2-naphthoquinone (4-CD) within the nanotubes. The glucose molecules in solution can be monitored in real-time via the EOT changes determined from the RIFTS signals of the F–P interferometer, thus providing a label-free, rapid, and low-cost optical technique for glucose determination.
Scheme 1A illustrates the approaches employed for loading PB nanocrystals, P4VP chain-based BCP film, and GOx onto TiO2 NTs. In this study, TiO2 NTs serve as the sensor substrate, they performed the following roles: (1) TiO2 NTs possess a high refractive index, which amplify optical signals in the F–P interferometer. This feature is particularly beneficial when measuring small refractive index changes. (2) The vertically aligned, hollow structure of the nanotubes offers a large internal surface area, which is favorable for loading molecules or nanomaterials. (3) The nanoscaled confinement effect provided by nanotubes enable a remarkable pH drop for the P4VP swollen during glucose oxidation [17–20]. As illustrated in Scheme 1B, the immobilized GOx catalyzes the oxidation of glucose in the presence of dissolved O2, yielding gluconic acid and H2O2. Subsequently, gluconic acid reduces the microenvironmental pH, after which the BCP film transforms from a collapsed to a swollen state, thus altering the average refractive index (n). Following this, the POD-like PB further catalyzes the H2O2-driven oxidation of 4-CN to insoluble 4-CD, leading to additional changes in n. The peak position of the RIFTS profile can be described by the F–P relationship shown in Eq. 1:
|
|
In this equation, λ is the wavelength of the interference spectral fringe, n is the mean refractive index of the structure, and L is the thickness of the optical film. Therefore, 2nL represents the optical path, corresponding to the EOT.
Scanning electron microscopy (SEM) was employed to characterize the morphology of the sample at each fabrication stage. Fig. 1A shows that the as-formed TiO2 NTs are composed of well-aligned and parallel nanotubes with diameters of ~120 nm and highly ordered ripples on the tube wall. It has been demonstrated that the ripple architecture is the key for producing well-defined F–P fringes in the reflectance spectrum [21]. A layer of cubic PB nanoparticles was deposited onto the surface and wall of the TiO2 NTs by the photocatalytic reaction (Fig. 1B). To achieve the high POD-like activity and optical response of PB/TiO2 NTs, the concentration of K3[Fe(CN)6] was optimized (Figs. S1 and S2 in Supporting information). PB/TiO2 NTs exhibited the best POD-like activity when the K3[Fe(CN)6] solution concentration was 5 mmol/L. The further BCP modification led to a reduced pore size (Fig. 1C). The entrance diameter of the resulting BCP/PB/TiO2 NTs was approximately 100 nm.
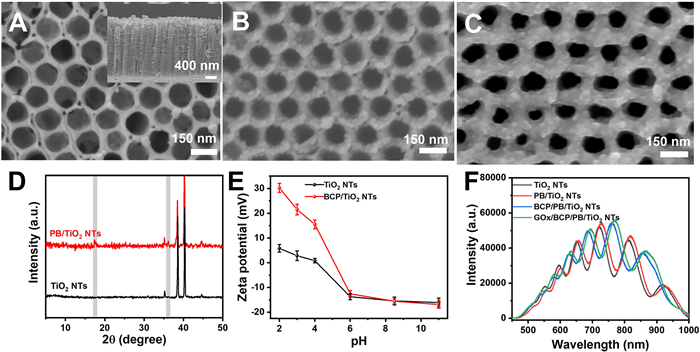
The successful decoration of PB was confirmed by X-ray diffraction (XRD, Fig. 1D). The new diffraction peaks that appeared at 2θ values of 17.4° and 35.2° in the XRD pattern of the PB/TiO2 NTs are attributed to the (100) and (200) planes of the face-centered cubic PB structure (JCPDS No. 01–0239).
When the BCP film was exposed to solutions with pH values lower than 5.2, the P4VP chains transformed into a swollen and hydrophilic state with a positively charged surface; upon exposure to a solution with a pH value larger than 5.2, they transformed into a collapsed and hydrophobic state, exhibiting a neutral surface (Fig. 1E) [22]. The variation in the surface charge of the BCP layer was further demonstrated by fluorescence analysis (Fig. S3 in Supporting information). The pH-induced surface group variations were also confirmed by sample wettability tests (Fig. S4 in Supporting information).
The successful incorporation of GOx onto the BCP/PB/TiO2 NTs was confirmed by Fourier transform infrared (FTIR) analysis (Fig. S5 in Supporting information) and energy dispersive X-ray spectroscopy (EDS) characterization (Fig. S6 in Supporting information). The loading amount of GOx on BCP/PB/TiO2 NTs was determined by the absorption spectra of GOx solution before and after the sample incubation (Fig. S7 in Supporting information). The coverage of GOx was approximately 191 μg/cm2. The interferometric properties of the sensing chip were investigated by recording the reflection spectra following each modification step. As shown in Fig. 1F, the reflection spectrum of the as-formed TiO2 NTs exhibited clear F–P fringes, and the fringe-like features in the reflection spectra were well maintained after the following functionalization treatments. Notably, the reflection spectra exhibited a shift toward longer wavelengths after each modification step. Following this, the ΔEOT value of each modification step was calculated through Morlet wavelet phase analysis of the reflection spectra (Fig. S8 in Supporting information) [23].
Inspired by the good pH response of the BCP film and the relationship between the RIFTS wavelengths and EOT values, the proposed interferometric substrate is designed to act as a sensitive label-free optical sensor for glucose sensing by utilizing the products of glucose oxidation in the presence of GOx (Scheme 1B). The sensing mechanism involves the glucose acid product of the glucose oxidation effectively leading to a pH drop in the confined environment of the nanotubes, after which the P4VP chains (pKa ≈ 5.2)-based BCP film changes from the collapsed to the swollen state, thus inducing an increase in L (Fig. 2A). According to Eq. (1), this results in the F–P fringes shift flow cell and exposed to a PBS buffer flow containing 100 mM NaCl. Simultaneously, the optical spectra were continuously monitored, and the EOT values were calculated in real time. The BCP/TiO2 NTs-based sample was initially exposed to a pH 6 buffer flow for 10 min, and then sequentially exposed to buffers with pH 5, 4, and 3 for 10 min each. Fig. 2B presents the corresponding time-resolved changes in EOT. A significant increase in EOT was found when the pH of the buffer was reduced. In this case, owing to the changed charge distribution and electrostatic repulsion among pyridine groups, the P4VP chains became swollen. This change can be described as either an increase in polymer chain distance or an unfolding into an extended conformation, causing an increase in the physical thickness of the BCP layer (L). The other factor leading to the increased EOT is the change in the average refractive index, which is related to the protonation of the pyridine groups of P4VP. The ionization change enhances the chain hydrophilicity and wettability, thereby increasing the refractive index [24,25]. Ellipsometric measurements of the refractive index further confirmed that the BCP film exhibited a higher refractive index at pH 3 than pH 6 (Fig. S9 in Supporting information). The F–P fringes shift toward longer wavelengths in the detected interference pattern, thus leading to EOT values. When the pH value increased from 3 to 4, 5, and finally 6, the EOT fully recovered its original value. Notably, the EOT of BCP/TiO2 NTs exhibited a swift response to the pH variation within 2 min. The BCP/TiO2 NTs demonstrated an outstanding practical cyclability, maintaining a rapid and strong response when the pH was cycled between 3 and 6 (Fig. 2C).
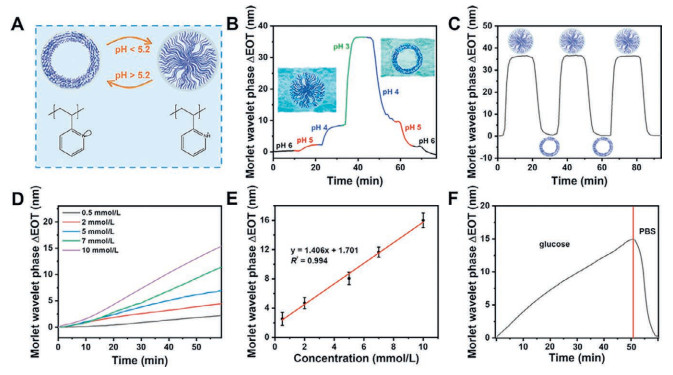
To confirm the sensing mechanism, the pH changes induced the bulk solution using a pH meter (Fig. S10A in Supporting information) and methyl red (Fig. S10B in Supporting information). Following GOx immobilization on the BCP/TiO2 NTs, it retained its superior catalytic efficiency in facilitating the oxidation of glucose to gluconic acid (Fig. S11 in Supporting information). A pH reduction occurred when both glucose and the sample were present. Although the bulk pH shift is comparatively modest, the nanoconfinement effect of the TiO2 NTs triggers the accumulation of gluconic acid at the polymer–solution interface, thus leading to a remarkable drop of pH value on site. Such a localized proton enrichment induces pronounced protonation and swelling of the P4VP, which in turn drives the substantial EOT modulation recorded.
To assess the effectiveness of the present biosensor platform for optical glucose detection, the sample was installed in a flow cell and exposed to glucose solutions with different concentrations. Reflectivity spectra were recorded during the whole experiment period, and the corresponding ΔEOT values were simultaneously determined by Morlet wavelet phase analysis. As shown in Fig. 2D, the ΔEOT values not only increased with the reaction time, but also depended on the glucose concentration. A larger ΔEOT value was recorded under a higher glucose concentration. To further confirm that the observed ΔEOT resulted from the pH response of the GOx/BCP/TiO2 NTs to glucose acid, the optical responses of GOx/BCP/TiO2, BCP/TiO2, and GOx/TiO2 NTs to 10 mmol/L glucose were compared under the same experimental conditions. Only the GOx/BCP/TiO2 NTs showed significant EOT changes following the introduction of glucose (Fig. S12 in Supporting information). These results indicate that the EOT shift in the F–P sensor can be attributed to the swelling of the GOx/BCP/TiO2 NTs. The sensing dynamic range was evaluated by exposing the samples to glucose solutions with different concentrations (Fig. 2E). The resulting ΔEOT values were correlated with the glucose concentrations, exhibiting a good linearity (R2 = 0.994) in their optical response to glucose concentrations ranging from 0.5 mmol/L to 10 mmol/L (Fig. 2E). The limit of detection (LOD) of the GOx/BCP/TiO2 NTs was determined to be 0.2 mmol/L based on the 3σ/s ratio. When the flow cell was rinsed with PBS to remove residual glucose and reaction products, ΔEOT exhibited a marked decrease (Fig. 2F), and rapidly returned to its initial value within 10 min. In this case, after glucose acid was replaced by a fresh buffer, the pyridine groups of the P4VP chains became deprotonated, thus causing the BCP film to shrink back. These results demonstrate that the swollen–collapsed behavior of the GOx/BCP/TiO2 NTs is highly reversible, which implies that the proposed F–P sensor can serve as a recyclable optical sensor for glucose analysis.
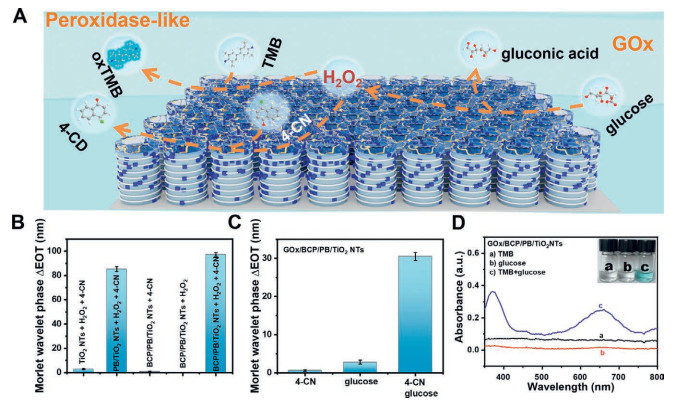
To achieve satisfactory sensitivity in glucose sensing, H2O2, as another product of glucose oxidation, was further employed to further control the EOT. For this purpose, as illustrated in Fig. 3A, PB was employed to catalyze the H2O2-driven oxidation of 4-CN to insoluble 4-CD. Because of its poor solubility, the formed 4-CD precipitates in the nanotubes, which is expected to alter the average refractive index of the proposed F–P sensor. The POD-like activity of the PB-decorated F–P sensor was demonstrated to depend on the solution pH and H2O2 concentration via colorimetric TMB assay (Fig. S13 in Supporting information). The influence of the 4-CD precipitate on ΔEOT was also shown to depend on the solution pH (Fig. S14 in Supporting information) and H2O2 concentration (Fig. S15 in Supporting information), consistent with the results of the colorimetric assays. The POD-like performance of the BCP/PB/TiO2 NTs were also investigated based on colorimetric assay. Apparently, the POD-like activities of BCP/PB/TiO2 NTs were dependent on the environmental pH and H2O2 concentration (Fig. S16 in Supporting information). Furthermore, a comparative analysis of the POD-like activities of the BCP/PB/TiO2 and PB/TiO2 NTs under identical conditions was carried out using the ΔEOT values obtained from RIFTS and TMB colorimetric assay experiments. As shown in Fig. 3B, the ΔEOT value obtained for the BCP/PB/TiO2 NTs was larger than that of the PB/TiO2 NTs. This phenomenon is attributed to the stacking between the pyridine groups on the swollen BCP film and the aromatic ring of 4-CN, resulting in the trapping of more 4-CN molecules, thus generating higher amount of 4-CD precipitate. In contrast, the colorimetric assay showed a higher activity for the PB/TiO2 NTs (Fig. S17 in Supporting information), which can be ascribed to the blocking effect of the BCP film on the POD-like activity of PB. As shown in Fig. 3C, the ΔEOT values obtained for the GOx/BCP/PB/TiO2 NTs in the presence of glucose without and with 4-CN were 30.5 and 2.81, respectively, demonstrating the significant signal amplification ability achieved by generating the 4-CD precipitate. These results are consistent with those of the colorimetric assay in Fig. 3D. The EOT data of different glucose-sensing samples was also investigated (Fig. S18 in Supporting information). The combination of PB with BCP was found to largely improve the RIFTS response to glucose.
To achieve satisfactory sensitivity for glucose detection on the F–P interferometer, the reaction temperature and 4-CN concentration were optimized. Based on the ΔEOT values, 1 mmol/L 4-CN was used for the reaction (Fig. S19 in Supporting information), and the reaction temperature was determined as 37 ℃ (Fig. S20 in Supporting information). Fig. 4A displays the ΔEOT of the GOx/BCP/PB/TiO2 NTs when solutions containing 4-CN and different concentration of glucose flowed through the sample surface. The increased glucose concentration led to a significant enhancement in the measured ΔEOT, which originated from the lower pH value and higher 4-CD yield at higher glucose concentrations. At low glucose concentrations, the ΔEOT is primarily attributed to the formed 4-CD, whereas at higher concentrations, both the swelling of BCP and the 4-CD formation contribute to the overall EOT shift. The resulting ΔEOT signals showed a linear relationship with the glucose concentration in the ranges of 1–100 µmol/L (Fig. 4B) and 0.1–10 mmol/L (Fig. 4C). The LOD value for glucose was 0.9 µmol/L based on the 3σ/s ratio, indicating a higher sensitivity compared to the GOx/BCP/TiO2 NTs (0.2 mmol/L).
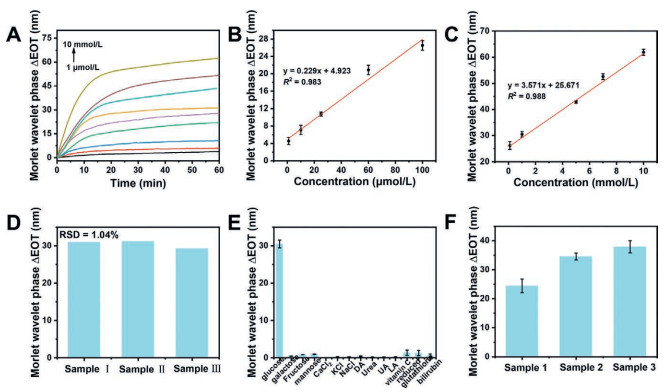
Reproducibility and selectivity were assessed for the GOx/BCP/PB/TiO2 NT F–P sensor. Real time ΔEOT traces from three independently fabricated batches converged the ΔEOT displayed a relative standard deviation of 1.04% (Fig. 4D, Fig. S21 in Supporting information), confirming highly consistent manufacturing. Selectivity remained excellent: common serum interferents produced negligible signal changes (Fig. 4E, Fig. S22 in Supporting information). These results verify the robust, interference resistant performance of the F-P platform, supporting its suitability for practical glucose analysis in complex biofluids. As glucose is a critical indicator for assessing diabetes in humans, rapid and accurate quantification of glucose is essential for routine health monitoring. Based on the real-time reflectance spectra, the corresponding ΔEOT values were calculated (Fig. S23 in Supporting information). According to the linear calibration relationship between glucose and ΔEOT signals (Figs. 4B and C), the glucose concentrations in serum were determined (Fig. 4F). The measured concentrations are listed in Table S1, with recoveries ranging from 100.5% to 103.17%. To validate the accuracy of the F-P interferometer, comparative colorimetric assays were conducted using identical samples (Figs. S24 and S25 in Supporting information). The obtained results were consistent with those from the interferometric method (Table S2 in Supporting information), suggesting the reliability and practicality of the F-P sensor for real analysis in biomatrix.
In summary, a pH-responsive platform based on the RIFTS optical technique was fabricated using TiO2 NTs coated with a P4VP chain-based BCP film. The resulting pH-responsive F–P interferometer exhibited good performance in glucose sensing. In this design, apart from the collapsed-to-swollen transformation of the BCP film induced by glucose acid, H2O2, as another product of glucose oxidation, was used to induce the precipitation of insoluble 4-CD on the sensor surface. By combining the variations in film thickness and average refractive index, the resulting F–P optical sensor exhibited high sensitivity for label-free glucose sensing based on the ΔEOT values. The proposed glucose sensor also demonstrated excellent sensing performance in the detection of blood glucose in human serum, suggesting its potential as a new and reliable device for glucose diagnosis.
Hairihan Zhou: Writing – original draft, Software, Methodology, Data curation. Yue Zhang: Methodology, Formal analysis, Conceptualization. Shujia Wang: Software, Investigation, Formal analysis. Zhida Gao: Resources, Methodology, Formal analysis. Chenxi Zhao: Investigation, Conceptualization. Pei Song: Resources, Methodology. Xiaona Li: Resources, Methodology, Funding acquisition, Formal analysis. Yan-Yan Song: Writing – review & editing, Supervision, Resources, Funding acquisition.
The authors declare that they have no known competing financial interests or personal relationships that could have appeared to influence the work reported in this paper.
This work was supported by the National Natural Science Foundation of China, China (No. 22374015), Liaoning Province Foundation for Distinguished Young Scholars, China (No. 2024JH3/50100012 to Y.-Y. S.); Fundamental Research Funds for the Central Universities, China (No. N2424020). Special thanks are due to the instrumental or data analysis from Analytical and Testing Center, Northeastern University.
Supplementary material associated with this article can be found, in the online version, at doi:
N.H. Cho, J.E. Shaw, S. Karuranga, et al., Diabetes Res. Clin. Pract. 138 (2018) 271–281. doi: 10.1016/j.diabres.2018.02.023
S. Tian, M. Wang, P. Fornasiero, et al., Chin. Chem. Lett. 34 (2023) 108241. doi: 10.1016/j.cclet.2023.108241
J. Gu, Y. Xu, Q. Li, et al., Chin. Chem. Lett. 32 (2021) 2017–2020. doi: 10.1016/j.cclet.2020.11.066
X. Sun, Y. Li, H. Li, et al., Chin. Chem. Lett. 32 (2021) 1780–1784. doi: 10.1016/j.cclet.2020.12.041
A. Farid, Z. Fan, L. Pan, et al., Adv. Funct. Mater. 33 (2023) 2301727. doi: 10.1002/adfm.202301727
G. Gumilar, Y. Kaneti, J. Henzie, et al., Chem. Sci. 11 (2020) 3644–3655. doi: 10.1039/c9sc05636j
G. Li, D. Wen, Chin. Chem. Lett. 32 (2021) 221–228. doi: 10.1016/j.cclet.2020.10.028
H. Zhou, J. Guo, C. Zhao, et al., Anal. Chem. 96 (2024) 19066–19073. doi: 10.1021/acs.analchem.4c04160
Y. Wang, W. Guo, B. Su, et al., J. Am. Chem. Soc. 142 (2020) 1222–1226. doi: 10.1021/jacs.9b12833
Y. Wang, J. Ding, B. Su, et al., Angew. Chem. Int. Ed. 62 (2023) e202216525. doi: 10.1002/anie.202216525
L. Liu, N. Ma, L. Wang, et al., Anal. Chem. 96 (2024) 13482–13493. doi: 10.1021/acs.analchem.4c01646
V.S. Lin, K. Motesharei, M.J. Sailor, et al., Science 278 (1997) 840–843. doi: 10.1126/science.278.5339.840
D.E. Discher, A. Eisenberg, Science 297 (2002) 967–973. doi: 10.1126/science.1074972
K. -V. Peinemann, V. Abetz, P.F.W. Simon, Nat. Mater. 6 (2007) 992–996. doi: 10.1038/nmat2038
Z. Zhang, X. -Y. Kong, K. Xiao, et al., J. Am. Chem. Soc. 137 (2015) 14765–14772. doi: 10.1021/jacs.5b09918
M. Tagliazucchi, O. Azzaroni, I. Szleifer, J. Am. Chem. Soc. 132 (2010) 12404–12411. doi: 10.1021/ja104152g
H. Jung, H. Kim, J. Will, et al., Angew. Chem. Int. Ed. 64 (2025) e202415865. doi: 10.1002/anie.202415865
Q. Wang, J. -Y. Huang, H.Q. Li, et al., Int. J. Nanomed. 12 (2016) 151–165. doi: 10.2147/IJN.S117498
K. Li, H. Wang, C. Zhao, et al., Chin. Chem. Lett. 36 (2025) 110610. doi: 10.1016/j.cclet.2024.110610
J. Xu, C. Liang, Z. Gao, et al., Chin. Chem. Lett. 34 (2023) 107863. doi: 10.1016/j.cclet.2022.107863
Y. -Y. Song, P. Schmuki, Electrochem. Commun. 12 (2010) 579–582. doi: 10.1016/j.elecom.2010.02.004
J. Yin, X. Yao, J. -Y. Liou, et al., ACS Nano 7 (2013) 9961–9974. doi: 10.1021/nn403847z
S.J. Ward, E. Segal, S.M. Weiss, et al., ACS Sens. 6 (2021) 2967–2978. doi: 10.1021/acssensors.1c00787
L.A. Perelman, M.J. Sailor, E. Segal, et al., Adv. Funct. Mater. 20 (2010) 826–833. doi: 10.1002/adfm.200900822
H. Wang, I.H. Lee, M. Yan, J. Colloid Interface Sci. 365 (2012) 178–183. doi: 10.1016/j.jcis.2011.08.081

Scheme 1 (A) Fabrication scheme of GOx/BCP/PB/TiO2 NTs. (B) Design of F–P sensor for glucose detection.

Figure 1 Top view of (A) TiO2 NTs, (B) PB/TiO2 NTs and (C) BCP/PB/TiO2 NTs. (D) XRD patterns of TiO2 and PB/TiO2 NTs. (E) Zeta potential of TiO2 NTs and BCP/TiO2 NTs. (F) Reflectance spectra of TiO2 NTs interferometers recorded in air.

Figure 2 (A) pH-responsive properties of confined nanostructure. (B) EOT changes of BCP/TiO2 NTs during pH cycling between 6 and 3. (C) EOT changes of BCP/TiO2 NTs during a single pH cycle between 3 and 6. Response of GOx/BCP/TiO2 NTs interferometer to different concentrations of glucose. (D) EOT changes vs. time in response to different glucose concentrations (0.5 − 10 mmol/L). (E) Resulting calibration curve of optical system. (F) EOT changes for glucose detection and subsequent PBS infusion.

Figure 3 (A) Schematic illustration of glucose sensing on GOx/BCP/PB/TiO2 NTs. (B) ΔEOT data measured in pH 4.0 buffer solutions containing different samples. (C) ΔEOT and (D) TMB colorimetric assay data of GOx/BCP/PB/TiO2 NTs in pH 6.0 buffer containing 4-CN, glucose, and glucose/4-CN. Inset image: Photographs of colorimetric assay solutions. The glucose concentration was 1 mmol/L.

Figure 4 (A) ΔEOT vs. time plots in response to different glucose concentrations (1 μmol/L−10 mmol/L). (B, C) corresponding calibration curve. (D) ΔEOT values measured on three GOx/BCP/PB/TiO2 NTs substrates for 1 mmol/L glucose. (E) ΔEOT of GOx/BCP/PB/TiO2 NTs for sensing 1 mmol/L glucose and 1 mmol/L interfering species. (F) Detection of glucose in serum samples.

 扫一扫看文章


扫一扫关注我们
 DownLoad:
 下载:
 下载: