A liquid PEG depot capable of triggering intratumoral O2/H2O2 generation and neutralization/calcification for realizing light irradiation-free photodynamic therapy and immunotherapy
Citation:
Shi-Hao Wang, Qiu-Yi Duan, Rufeng Zhang, Zihao Wang, Zi-Xi Wang, Yang Shen, Fu-Gen Wu. A liquid PEG depot capable of triggering intratumoral O2/H2O2 generation and neutralization/calcification for realizing light irradiation-free photodynamic therapy and immunotherapy[J]. Chinese Chemical Letters,
2026, 37(8): 111772.
doi:
10.1016/j.cclet.2025.111772
A liquid PEG depot capable of triggering intratumoral O2/H2O2 generation and neutralization/calcification for realizing light irradiation-free photodynamic therapy and immunotherapy
English
A liquid PEG depot capable of triggering intratumoral O2/H2O2 generation and neutralization/calcification for realizing light irradiation-free photodynamic therapy and immunotherapy
State Key Laboratory of Digital Medical Engineering, Jiangsu Key Laboratory for Biomaterials and Devices, School of Biological Science and Medical Engineering, Southeast University, Nanjing 211189, China
b.
Department of Obstetrics and Gynecology, Zhongda Hospital, School of Medicine, Southeast University, Nanjing 210009, China
c.
Nanjing Key Laboratory of Intelligent Obstetrics and Gynecology Medicine, Nanjing 210009, China
d.
Guangxi Key Laboratory of Early Prevention and Treatment for Regional High Frequency Tumor, Nanning 530021, China
e.
Key Laboratory of Early Prevention and Treatment for Regional High Frequency Tumor (Guangxi Medical University), Ministry of Education, Nanning 530021, China
Received Date:
30 May 2025 Accepted Date:
28 August 2025 Revised Date:
27 August 2025 Available Online:
15 August 2026
Abstract:
The clinical application of photodynamic therapy (PDT) is usually limited by the low penetration depth of light and the hypoxic condition of tumor microenvironment. Therefore, it is urgent to develop a drug system that can activate photosensitizers (PSs) in deeply seated tumors and spontaneously generate O2 to enhance the efficacy of PDT. Herein, we design a liquid polyethylene glycol (PEG) 200 (PEG200)-based drug depot containing calcium peroxide (CaO2) nanoparticles, bis[2,4,5-trichloro-6-(pentyloxycarbonyl)phenyl]oxalate (CPPO, a high-energy compound), and chlorin e6 (Ce6, a PS) for achieving O2/H2O2 self-supplied chemiexcited (light irradiation-free) PDT and immunotherapy. By injecting the drug depot into the tumor, CaO2 can react with water to produce H2O2, which can activate CPPO to generate chemical energy, further stimulating Ce6 to produce 1O2. Meanwhile, CaO2 can also generate O2 to enhance PDT. Besides, CaO2 can neutralize the acidic tumor microenvironment by the formation of Ca(OH)2, cause calcium overload in tumor cells, and lead to tumor calcification. Further experiments show that CaO2, CPPO, and Ce6 can cause mitochondrial damage, trigger immunogenic cell death, and significantly improve the therapeutic effect of programmed death-1 (PD-1) monoclonal antibody. This work highlights the application potential of the rational combination of CaO2, CPPO, and Ce6 for realizing light irradiation-free PDT and immunotherapy.
Cancer, as one of the most threatening diseases, kills millions of people every year [1]. Photodynamic therapy (PDT) has received widespread attention in recent years as a promising cancer treatment modality [2,3]. In most cases, PDT uses light to activate photosensitizers (PSs), producing reactive oxygen species (ROS) in the presence of oxygen (O2), causing damage to cells, and inducing cell apoptosis [4,5]. Some studies have also revealed that PDT can lead to immunogenic cell death (ICD), and have combined PDT with immune checkpoint blockade (ICB) therapy to achieve better immunotherapeutic efficacy [6-10]. Compared with traditional chemotherapy and radiotherapy, PDT has gained popularity due to its better safety, controllability, and less invasiveness [11-13].
However, several critical issues still exist, which greatly hinder the wider clinical use of PDT [14-16]. First, most conventional PSs lack good water solubility [4]. Second, owing to the dysfunctional angiogenesis and abnormal proliferation of tumor cells, the microenvironment of solid tumor exhibits the hypoxic characteristic [17-19]. Since most PDT systems require O2 consumption, the hypoxic condition in tumor microenvironment (TME) greatly weakens the therapeutic effect of PDT [11,20-25]. Third, the ROS produced by PDT usually have a narrow diffusion radius and a short lifetime [26], which may compromise the effectiveness of PDT. Finally, different tissues have different laser absorption, transmission, scattering, and reflection properties, which will limit the depth of light penetration [4,27]. In another word, most existing PDT systems are only effective for superficial tumors, but fail to treat deeply seated tumors [28]. Thus, developing a type of PDT that can effectively overcome the above-mentioned issue is highly required.
To solve the problem of insufficient light penetration depth, the use of chemical energy instead of light excitation to trigger PDT has been proposed as an optional solution [29-31]. The chemical energy produced by the reaction between a high-energy compound, such as peroxyoxalate derivative, and hydrogen peroxide (H2O2) can replace light excitation to stimulate PSs. Therefore, PSs can generate ROS in situ without external light excitation [32-34]. Yu et al. designed a biomimetic nanoreactor composed of cancer cell membrane-coated hollow mesoporous silica nanoparticles (HMSNs), whose surface was modified with glucose oxidase and the PS chlorin e6 (Ce6), and whose inner cavity was loaded with bis[2,4,5-trichloro-6-(pentyloxycarbonyl)phenyl]oxalate (CPPO) and perfluorohexane, to achieve chemiexcited photodynamic-starvation therapy [29]. Nevertheless, such chemiexcited PDT requires adequate H2O2 and O2 [35,36]; however, in the tumor region, the contents of these two substances are usually not high enough to trigger the chemiexcited PDT, which requires the development of new strategies to overcome this dilemma [37-39].
Calcium peroxide (CaO2) has been recently valued by researchers for its simple synthesis, good biocompatibility, and excellent potential for tumor treatment [40-42]. CaO2 can react with water to produce O2, H2O2, and calcium hydroxide [43]. Decreasing pH can accelerate the O2 and H2O2 release rates, increase the H2O2 yield, and decrease the O2 yield. The produced calcium hydroxide can relieve the acidic TME [44,45]. As a result, CaO2 has the potential to enhance PDT [46,47]. The rapid release of Ca2+ under TME has been proven to cause calcium overload and calcification, causing damage to tumor cells [48-52]. Some studies have found that calcium overload can induce ICD, and Ca2+ helps to promote dendritic cell (DC) maturation and activate M1 polarization of tumor-associated macrophages (TAMs) [53-55]. However, the instability of CaO2 in water greatly limits its biological application [56]. Hyaluronic acid (HA), sodium hyaluronate, and tannic acid are usually applied for the surface modification of CaO2 to improve its stability [41]. For example, after the addition of HA during the preparation, the obtained CaO2 can remain stable in the physiological media, and can only be degraded in the acidic TME [57]. Besides, it is valuable to find a suitable reagent that can stabilize CaO2 and combine it with other drugs to continuously exert therapeutic effects after being injected into the tumor.
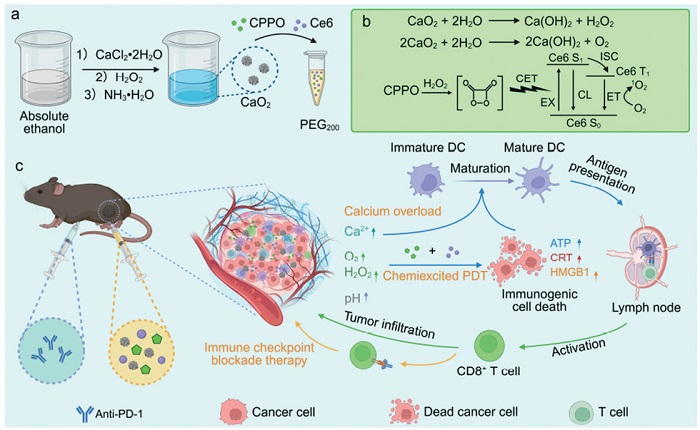
Herein, we prepare a polyethylene glycol 200 (PEG200)-based drug depot that contains CaO2 nanoparticles, CPPO, and Ce6 to achieve O2/H2O2 self-supplied light irradiation-free PDT and immunotherapy. After the dispersion of the three components (CaO2 nanoparticles, CPPO, and Ce6) in water-free liquid PEG200 (Scheme 1a), CaO2 nanoparticles can be prevented from premature decomposition. After being injected into the tumor, CaO2 reacts with water to generate O2 and H2O2 continuously. H2O2 drives CPPO to produce chemical energy, which excites Ce6, and realizes enhanced PDT with sufficient O2 supply (Scheme 1b), causing potent ICD induction and contributing to efficient anticancer immunity activation. Moreover, the reaction of CaO2 with water can also lead to calcium overload, which helps the maturation of antigen-presenting cells (especially DCs), further boosting the anticancer immune response. Last but not least, we also use the anti-programmed death-1 (anti-PD-1) antibody to realize ICB therapy for achieving a better immunotherapeutic effect (Scheme 1c).
Scheme 1
Scheme 1.
Schematic illustrating (a) the fabrication of CaO2/CPPO/Ce6-containing PEG200 solution and (b, c) its application for O2/H2O2 self-supplied chemiexcited PDT and immunotherapy. The anti-PD-1 treatment was also employed for realizing ICB therapy. CET: chemical energy transfer; CL: chemiluminescence; ET: energy transfer; EX: excitation; ISC: intersystem crossing; S0: ground singlet state; S1: excited singlet state; T1: excited triple state.
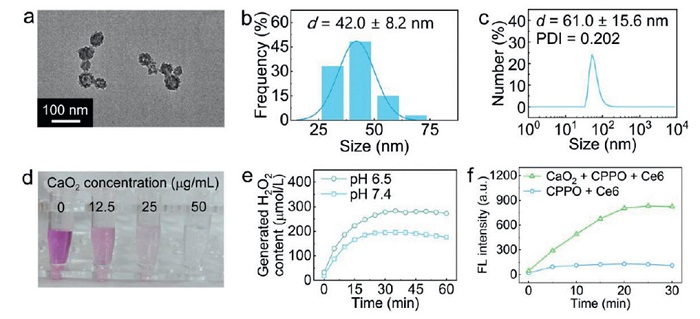
A series of experiments were carried out to verify the successful synthesis of CaO2 nanoparticles. First, according to the transmission electron microscopy (TEM) image and corresponding statistical histogram, the obtained CaO2 nanoparticles are irregular spheres with an average diameter of 42.0 ± 8.2 nm (Figs. 1a and b). The results of dynamic light scattering showed that CaO2 nanoparticles have a hydrodynamic size of 61.0 ± 15.6 nm with a polydispersity index (PDI) of 0.202 (Fig. 1c). The hydrodynamic diameters and PDIs of CaO2 nanoparticles in ethanol showed no obvious changes after storage for different time periods (Fig. S1 in Supporting information). The powder X-ray diffraction result of the nanoparticles displays the typical peaks of CaO2 (Fig. S2 in Supporting information). Potassium permanganate (KMnO4) was used to verify the formation of H2O2 from CaO2 nanoparticles. KMnO4 is a strong oxidant. When reacting with H2O2, the KMnO4 solution will change from purple to colorless [58]. With the increase of the concentration of CaO2 nanoparticles, the KMnO4 solution gradually turned from purple to colorless (Fig. 1d), indicating that the synthesized CaO2 nanoparticles can produce H2O2. Furthermore, we measured the amount of H2O2 generated by CaO2 nanoparticles in phosphate-buffered saline (PBS) solutions of different pH values. As shown in Fig. 1e, CaO2 nanoparticles could generate H2O2 in different buffers with a pH value of 6.5 or 7.4, and more H2O2 was generated under an acidic condition (pH 6.5). Finally, the Singlet Oxygen Sensor Green (SOSG) indicator was applied to demonstrate the singlet oxygen (1O2) generation from PDT triggered by "CPPO + Ce6" or "CaO2 + CPPO + Ce6" without light (Fig. 1f). The "CPPO + Ce6" group produced negligible 1O2, while the "CaO2 + CPPO + Ce6" group generated a noticeable amount of 1O2, proving that CaO2 nanoparticles are able to trigger chemiexcited PDT. Besides, the fluorescence intensity of the "CaO2" group slightly increased in 10 min (Fig. S3 in Supporting information), which may be caused by the H2O2 generated by CaO2, and such a result did not affect the conclusion that the combination of CaO2, CPPO, and Ce6 can achieve chemiexcited PDT.
Figure 1
Figure 1.
(a) TEM image and (b) corresponding size distribution histogram of CaO2 nanoparticles (dispersed in ethanol for characterization). (c) Hydrodynamic diameter of CaO2 nanoparticles (dispersed in ethanol for characterization). (d) Photograph of KMnO4 solutions treated separately with different concentrations of CaO2. (e) Generated H2O2 concentrations of CaO2 in buffer solutions of different pH values for a duration of 60 min. (f) Time-dependent fluorescence intensity changes of SOSG in the "CPPO + Ce6" and "CaO2 + CPPO + Ce6" suspensions (solvent: PBS), respectively.
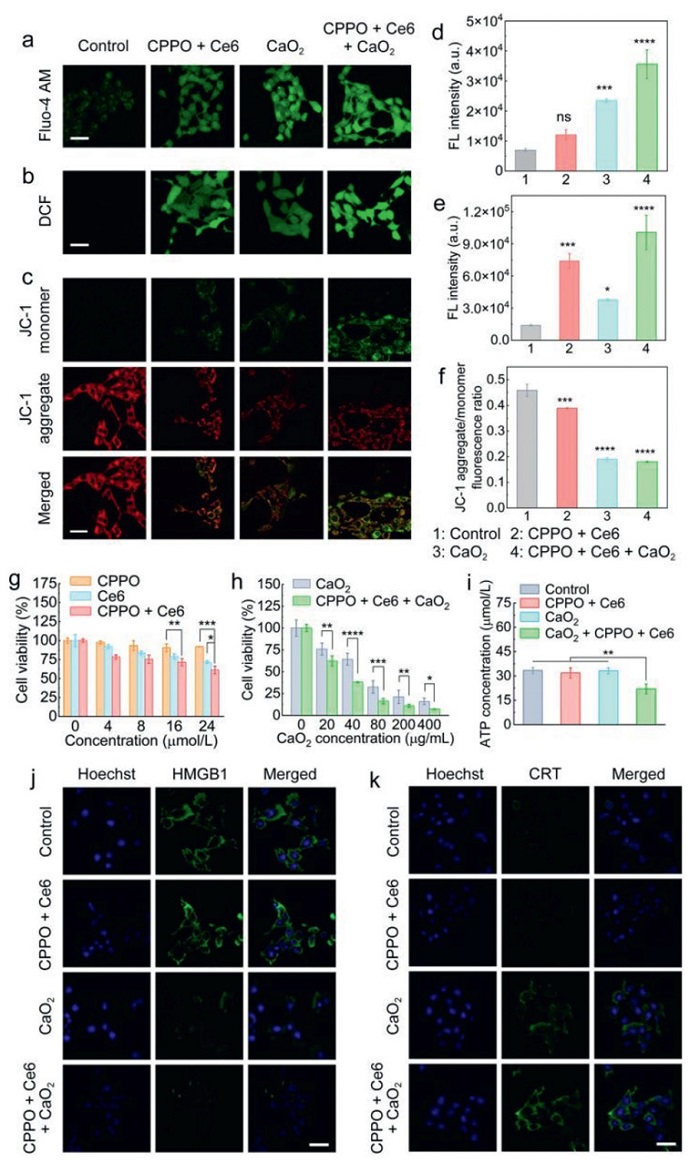
As mentioned above, CaO2 reacts with water to generate H2O2, O2, and Ca(OH)2, and Ca(OH)2 can further react with H+ to produce Ca2+. Massive Ca2+ causes calcium overload. Meanwhile, H2O2 and O2 can assist CPPO and Ce6 to realize enhanced chemiexcited PDT and produce ROS. Both calcium overload and PDT are reported to damage mitochondria [4,54]. Thus, we first measured intracellular Ca2+ levels by Fluo-4 AM, a commercial fluorescent probe for Ca2+. As shown in Fig. 2a, 4T1 cells (a murine mammary carcinoma cell line) treated with CaO2 or "CPPO + Ce6 + CaO2" exhibited strong green fluorescence, and according to the results from flow cytometry, the CPPO/Ce6/CaO2-treated cells had the strongest green fluorescence (Fig. 2d), implying that CaO2 nanoparticles can lead to the accumulation of intracellular Ca2+, which may also be promoted by PDT. 2′,7′-Dichlorodiydrofluorescein diacetate (DCFH-DA) is an ROS probe that can be hydrolyzed by intracellular esterases, and be oxidized into 2′,7′-dichlorofluorescein (DCF) with green fluorescence later. We applied DCFH-DA to investigate the intracellular ROS level of 4T1 cells with different treatments. Figs. 2b and e revealed that chemiexcited PDT caused by CPPO and Ce6 generated some ROS and the addition of CaO2 resulted in the highest intracellular ROS level in the "CPPO + Ce6 + CaO2" group, and the results in Fig. S4 (Supporting information) also showed that the "CPPO + Ce6 + CaO2" treatment led to the highest 1O2 level in 4T1 cells. The cells treated with CaO2 also had an increased ROS level compared with the cells treated with culture medium (Fig. 2e), which is due to the capacity of CaO2 nanoparticles to produce H2O2 within the tumor cells. 5,5',6,6'-Tetrachloro-1,1',3,3'-tetraethylbenzimidazolylcarbocyanine iodide (JC-1) is a fluorescent dye used to reflect changes in mitochondrial membrane potential. When mitochondria are damaged, the fluorescence of JC-1 monomer (green) increases and the fluorescence of JC-1 aggregate (red) decreases. The flow cytometric results and confocal fluorescence images demonstrated that the combination of CaO2, CPPO, and Ce6 can lead to the most severe mitochondrial dysfunction (Figs. 2c and f).
Figure 2
Figure 2.
(a, b) Confocal fluorescence images of the 4T1 cells that were stained with (a) Fluo-4 AM (a Ca2+ fluorescent probe) or (b) DCFH-DA (an ROS probe) after different treatments. DCF shown in the figure is the fluorescent product of DCFH-DA, and its emission intensity can reflect the content of cellular ROS. Scale bars: 50 μm. (c) Confocal fluorescence images showing the mitochondrial membrane potential changes of the 4T1 cells that were stained with JC-1 after various treatments. Scale bar: 50 μm. (d) Ca2+ levels in the 4T1 cells (measured by flow cytometry) after different treatments. (e) ROS levels in the 4T1 cells (measured by flow cytometry) after different treatments. (f) JC-1 aggregate/monomer fluorescence ratios indicating the mitochondrial membrane potential changes of the 4T1 cells (measured by flow cytometry) after different treatments. (g) Relative viabilities of the 4T1 cells treated with different concentrations (based on CPPO or Ce6) of CPPO and/or Ce6. The molar ratio of CPPO to Ce6 was 1:1. (h) Relative viabilities of the 4T1 cells treated with different concentrations of CaO2 with or without "CPPO + Ce6". The concentration of CPPO (or Ce6) was 4 μmol/L. (i) Intracellular ATP levels in the 4T1 cells after different treatments. (j, k) Immunofluorescence staining results of (j) HMGB1 and (k) CRT in the 4T1 cells after various treatments. The cell nuclei were stained blue by Hoechst 33342 (Hoechst). The green fluorescence in (j) indicates the presence of HMGB1. The green fluorescence in (k) indicates the presence of CRT. Scale bars: 50 μm. All the statistical data are presented as mean ± standard deviation (SD) (n = 3). Statistical significance in (d–g, i) was calculated via one-way ANOVA with a Tukey's post-hoc test. Statistical significance in (h) was calculated via two-tailed Student's t-test. *P < 0.05, **P < 0.01, ***P < 0.001, ****P < 0.0001. ns: nonsignificant difference.
We further investigated the cytotoxicity of different treatments toward 4T1 cells via live/dead cell staining, apoptosis/necrosis assay, and MTT (3-(4,5-dimethyl-2-thiazolyl)-2,5-diphenyl-2H-tetrazolium bromide) assay. The live/dead staining assay (using calcein acetoxymethyl ester (calcein-AM) and propidium iodide (PI)) revealed that the "CPPO + Ce6 + CaO2" treatment displayed the strongest cell toxicity (Fig. S5 in Supporting information). The flow cytometry-based apoptosis/necrosis assay revealed that the "CaO2 + CPPO + Ce6" treatment induced a high late apoptosis rate (~94%) of the cells (Fig. S6 in Supporting information). The results of MTT assay indicated that CPPO showed almost no toxicity to the cells and neither Ce6 alone nor "CPPO + Ce6" could effectively kill the cells (Fig. 2g). The combination of CPPO and H2O2 did not significantly increase cytotoxicity compared with the treatment of H2O2 alone (Fig. S7 in Supporting information), indicating that the chemical energy produced by CPPO and H2O2 cannot cause severe cell death. Nevertheless, Fig. 2h indicated that CaO2 had good cytotoxicity and exhibited higher toxicity in the presence of CPPO and Ce6 by triggering chemiexcited PDT. In addition, compared with 4T1 cells, L929 cells (a mouse fibroblast cell line) showed higher viabilities after treatment with the same drug (CPPO + Ce6 + CaO2) concentrations (Fig. S8 in Supporting information), indicating that the combination of CaO2, CPPO, and Ce6 could effectively kill tumor cells while having a lower toxic effect on normal cells. ICD is a form of regulated cell death that is sufficient to activate an adaptive immune response in immunocompetent syngeneic hosts [59]. Adenosine triphosphate (ATP), high mobility group box 1 (HMGB1), and calreticulin (CRT) are the three common damage-associated molecular patterns released or exposed during ICD [60-62]. Fig. 2i showed that the ATP level in the 4T1 cells after "CPPO + Ce6 + CaO2" treatment was lower than that in other groups. The relative HMGB1 level secreted from the 4T1 cells after "CPPO + Ce6 + CaO2" treatment was higher than that in other groups, as demonstrated by the enzyme-linked immunosorbent assay result (Fig. S9 in Supporting information). Immunofluorescence staining results also revealed that the content of intracellular HMGB1 was downregulated and CRT expression on the plasma membrane was upregulated (Figs. 2j and k, Fig. S10 in Supporting information), which proved that the "CPPO + Ce6 + CaO2" treatment could cause ICD of the 4T1 cells.
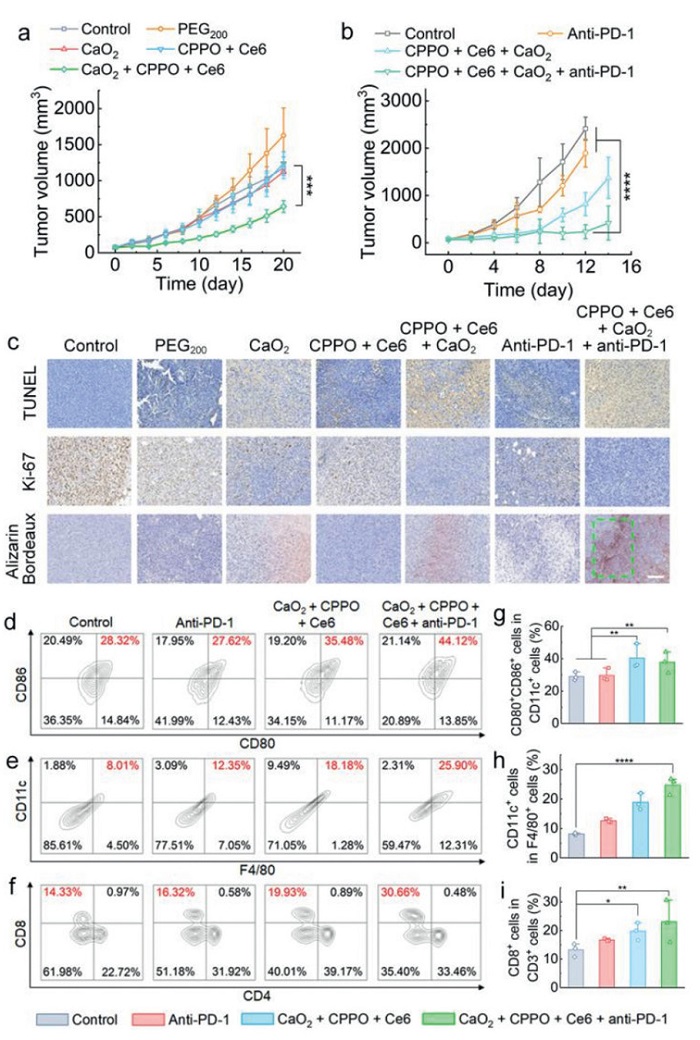
Two different tumor models were used to evaluate the in vivo anticancer efficacy of different treatments (Fig. S11 in Supporting information), and all the animal experiments were carried out in compliance with the Animal Ethics Committee of Southeast University (approval No. 20220913002) and the Regulations for the Administration of Affairs Concerning Experimental Animals of China. In the first tumor model, the 4T1 tumor-bearing BALB/c mice were separately treated with PBS (the control group), PEG200, CaO2 (dispersed in PEG200), CPPO + Ce6 (dispersed in PEG200), and CaO2 + CPPO + Ce6 (dispersed in PEG200) via intratumoral (i.t.) administration. The tumor volumes and body weights of the mice were monitored during the whole treatment period of 20 days. In the second tumor model, we treated B16F10 (a murine melanoma cell line) tumor-bearing C57BL/6 mice with PBS (the control group) or CaO2 + CPPO + Ce6 (dispersed in PEG200) via i.t. administration, and a part of the mice were also treated with anti-PD-1 by intraperitoneal (i.p.) injection. The tumor volumes, body weights, and survival time of the mice were recorded. As presented in Fig. S12 (Supporting information), after being injected into tumors, the drug depot remained in the tumor areas for at least 3 days and almost disappeared at 7 d, which indicated that the drug depot can achieve long-term cancer treatment. Fig. 3a showed that only the "CaO2 + CPPO + Ce6" treatment exerted a notable inhibitory effect on the growth of 4T1 tumors. The body weights of the mice had no obvious difference among all the different groups (Fig. S13 in Supporting information), indicating the good biosafety of our treatment. Moreover, the "CaO2 + CPPO + Ce6" treatment greatly improved the therapeutic effect of anti-PD-1 in B16F10 tumor-bearing C57BL/6 mice (Fig. 3b and Fig. S14 in Supporting information) and the "CaO2 + CPPO + Ce6 + anti-PD-1" treatment extended the survival time of mice (Fig. S15 in Supporting information). The body weights of the B16F10 tumor-bearing C57BL/6 mice after different treatments also showed no obvious difference (Fig. S16 in Supporting information). To further confirm the therapeutic outcomes of different treatments, terminal deoxynucleotidyl transferase (TdT)-mediated dUTP nick end labeling (TUNEL) and Ki-67 staining assays were conducted for the B16F10 tumor tissues to evaluate the apoptosis and proliferation of tumor cells, respectively (Fig. 3c). In the TUNEL staining results, the "CaO2 + CPPO + Ce6 + anti-PD-1"-treated group showed obvious non-blue areas, indicating that such treatment caused the most significant tumor cell apoptosis. Moreover, the "CaO2 + CPPO + Ce6 + anti-PD-1"-treated group showed almost no brown areas in the Ki-67 staining results, which suggested that such treatment led to significant proliferation inhibition of tumor cells. The calcified area (marked by the green dashed box) in the Alizarin Bordeaux staining results in Fig. 3c also exhibited that the "CaO2 + CPPO + Ce6 + anti-PD-1" treatment caused tumor calcification. Collectively, the above results confirmed that the "CaO2 + CPPO + Ce6" treatment can effectively inhibit tumor growth and achieve a better therapeutic effect combined with anti-PD-1.
Figure 3
Figure 3.
(a) Average tumor growth curves of the 4T1 tumor-bearing BALB/c mice after different treatments. (b) Average tumor growth curves of the B16F10 tumor-bearing C57BL/6 mice after different treatments. Data are presented as mean ± SD (n = 5 mice per group). Statistical significance in (a, b) was calculated via one-way ANOVA with a Tukey's post-hoc test. (c) TUNEL assay, Ki-67 assay, and Alizarin Bordeaux staining results of the B16F10 tumor regions of different groups. The green dashed region indicates the calcified area. Scale bar: 100 μm. (d–f) Representative flow cytometric plots of (d) CD80+CD86+ DCs in TDLNs, (e) F4/80+CD11c+ macrophages in tumors, and (f) CD3+CD4+ T cells and CD3+CD8+ T cells in TDLNs collected from B16F10 tumor-bearing C57BL/6 mice 2 d after different treatments. (g–i) Relative quantification results of (g) CD80+CD86+ DCs in TDLNs, (h) F4/80+CD11c+ macrophages in tumors, (i) CD3+CD8+ T cells in TDLNs collected from B16F10 tumor-bearing C57BL/6 mice 2 d after different treatments. Data are presented as mean ± SD (n = 3 mice per group). Statistical significance in (g–i) was calculated via one-way ANOVA with a Tukey's post-hoc test. *P < 0.05, **P < 0.01, ***P < 0.001, ****P < 0.0001.
Since the "CaO2 + CPPO + Ce6" treatment was proven to cause ICD in in vitro experiments, we further evaluated their potential immunostimulatory effect on B16F10 tumor-bearing C57BL/6 mice. Various immunocytes in tumor tissues, tumor-draining lymph nodes (TDLNs), and spleens were assessed. We first confirmed that the intratumoral injection of PEG200 had a negligible effect on tumor-infiltrating T lymphocytes (including CD4+ T cells, CD8+ T cells, and regulatory T cells) (Fig. S17 in Supporting information). Next, the flow cytometric results demonstrated that the proportion of mature DCs in the tumors was increased in the "CaO2 + CPPO + Ce6" and "CaO2 + CPPO + Ce6 + anti-PD-1" groups compared with that in the control group (Figs. S18a and d in Supporting information), and the proportion of mature DCs in the TDLNs was also markedly increased in the "CaO2 + CPPO + Ce6" and "CaO2 + CPPO + Ce6 + anti-PD-1" groups compared with that in other groups (Figs. 3d and g), confirming that the "CaO2 + CPPO + Ce6" and "CaO2 + CPPO + Ce6 + anti-PD-1" treatments can cause tumor cells to release tumor-associated antigens, which were taken up by DCs and promoted the eventual maturation of DCs in TDLNs. Besides, the proportions of M1 macrophages in the tumors, TDLNs, and spleens of the "CaO2 + CPPO + Ce6 + anti-PD-1" group all increased remarkably compared with those of the control group (Figs. 3e and h, Figs. S19 and S20 in Supporting information), while the proportions of M2 macrophages in the tumors after different treatments showed no significant difference compared with that in the tumors of the control group (Fig. S21 in Supporting information), which suggested that "CaO2 + CPPO + Ce6 + anti-PD-1" was able to promote the M1 polarization of TAMs. Mature DCs can present tumor-associated antigens to naive T cells in lymph nodes, where the naive T cells can be activated into cytotoxic T lymphocytes (CD8+ T cells) with effective tumor killing ability. M1 macrophages can present antigens to CD4+ T cells, activating them to secrete cytokines and assist in immune response. Although the proportions of CD4+ T cells, CD8+ T cells, and regulatory T cells in the tumors after different treatments did not show significant changes compared to those in the tumors of the control group (Figs. S18b, c and e–g in Supporting information), the flow cytometric results shown in Figs. 3f and i revealed the increase of CD4+ T cells in the TDLNs from the mice treated with "CaO2 + CPPO + Ce6 + anti-PD-1" and the increase of CD8+ T cells in the TDLNs from the mice treated with "CaO2 + CPPO + Ce6" or "CaO2 + CPPO + Ce6 + anti-PD-1" compared with those in the control group, verifying that the "CaO2 + CPPO + Ce6 + anti-PD-1" treatment can activate T cells. Collectively, the "CaO2 + CPPO + Ce6 + anti-PD-1" treatment can cause the release of tumor-associated antigens for uptake by DCs and TAMs, promoting the maturation of DCs and the M1 polarization of TAMs. Then DCs can present tumor-associated antigens to naive T cells, and both DCs and M1 macrophages can activate CD8+ and CD4+ T cells to achieve effective immune responses.
Finally, we evaluated the biosafety of the "CaO2 + CPPO + Ce6" treatment in vivo. First, the hematoxylin and eosin (H&E)-stained slices of the main organs from the treated healthy mice showed no significant distinction compared with those from the untreated healthy mice (the control group) (Fig. S22a in Supporting information), indicating that the treatment induced no obvious tissue damage. In addition, the blood samples of the treated mice as well as those of untreated healthy mice were collected 21 d after drug injection for blood routine and biochemical examinations. The results also revealed no significant difference between the control group and the treated group (Figs. S22b and c in Supporting information), which proved the satisfactory biosafety of the "CaO2 + CPPO + Ce6" treatment.
In summary, we constructed a CaO2 nanoparticles-, CPPO-, and Ce6-containing liquid PEG200-based drug depot, which achieved the synergistic action of O2/H2O2 self-supplied light irradiation-free PDT and immunotherapy. In this system, CaO2 nanoparticles could react with the water in the tumor tissue to generate O2 and H2O2. The generated H2O2 could subsequently react with CPPO to produce chemical energy, triggering Ce6 to generate ROS, while the O2 could further enhance PDT. Meanwhile, CaO2 could also cause an increase in the intracellular Ca2+ level, leading to calcium overload and tumor calcification. The combination of CaO2, CPPO, and Ce6 led to mitochondrial damage and exhibited strong cytotoxicity to the cancer cells. Furthermore, according to the detection of three damage-associated molecular patterns (ATP, HMGB1, and CRT), the "CaO2 + CPPO + Ce6" treatment was proved to cause ICD, thereby activating strong immune responses such as promoting DC maturation, enhancing T cell activation, and enhancing M1 polarization of macrophages. Two different tumor models (the 4T1 tumor and the B16F10 tumor) were used to verify that the treatment of "CaO2 + CPPO + Ce6" can effectively inhibit tumor growth, significantly improve the therapeutic effect of anti-PD-1, and prolong the survival time of mice. Finally, we also demonstrated the excellent biosafety of the "CaO2 + CPPO + Ce6" treatment. Overall, the combination of CaO2, CPPO, and Ce6 overcomes the drawbacks of limited light penetration depth and insufficient oxygen supply in traditional PDT, and provides a promising strategy for developing effective and safe PDT systems.
Declaration of competing interest
The authors declare that they have no known competing financial interests or personal relationships that could have appeared to influence the work reported in this paper.
This work was supported by the Guangxi Key Laboratory of Early Prevention and Treatment for Regional High Frequency Tumor (No. GKE-KF202305), the Open Research Fund of Southeast University and Jiangsu Province Hospital (No. 2024-M01), the National Natural Science Foundation of China (Nos. 82372127, 82072078, and 82372126), the Fundamental Research Funds for the Central Universities (No. 2242023K5007), the National Clinical Key Discipline Construction Funds (No. czxm-zk-40), and the construction fund of Zhongda Hospital Affiliated to Southeast University, Jiangsu Province High-Level Hospital (Nos. 2023GSPKY11 and GSP-LCYJFH01).
Supplementary materials
Supplementary material associated with this article can be found, in the online version, at doi:10.1016/j.cclet.2025.111772.
[1]
W. Fan, P. Huang, X. Chen, Chem. Soc. Rev. 45 (2016) 6488–6519. doi: 10.1039/C6CS00616G
[2]
X. Li, N. Kwon, T. Guo, Z. Liu, J. Yoon, Angew. Chem. Int. Ed. 57 (2018) 11522–11531. doi: 10.1002/anie.201805138
[3]
S.Z. Wang, Y. Guo, X. Zhang, et al., Adv. Funct. Mater. 33 (2023) 2303328. doi: 10.1002/adfm.202303328
[4]
T.C. Pham, V.N. Nguyen, Y. Choi, S. Lee, J. Yoon, Chem. Rev. 121 (2021) 13454–13619. doi: 10.1021/acs.chemrev.1c00381
S. Sen, M. Won, M.S. Levine, et al., Chem. Soc. Rev. 51 (2022) 1212–1233. doi: 10.1039/d1cs00417d
[60]
D.V. Krysko, A.D. Garg, A. Kaczmarek, et al., Nat. Rev. Cancer 12 (2012) 860–875. doi: 10.1038/nrc3380
[61]
L. Galluzzi, A. Buqué, O. Kepp, L. Zitvogel, G. Kroemer, Nat. Rev. Immunol. 17 (2017) 97–111. doi: 10.1038/nri.2016.107
[62]
G. Kroemer, C. Galassi, L. Zitvogel, L. Galluzzi, Nat. Immunol. 23 (2022) 487–500. doi: 10.1038/s41590-022-01132-2
Scheme 1
Schematic illustrating (a) the fabrication of CaO2/CPPO/Ce6-containing PEG200 solution and (b, c) its application for O2/H2O2 self-supplied chemiexcited PDT and immunotherapy. The anti-PD-1 treatment was also employed for realizing ICB therapy. CET: chemical energy transfer; CL: chemiluminescence; ET: energy transfer; EX: excitation; ISC: intersystem crossing; S0: ground singlet state; S1: excited singlet state; T1: excited triple state.
Figure 1
(a) TEM image and (b) corresponding size distribution histogram of CaO2 nanoparticles (dispersed in ethanol for characterization). (c) Hydrodynamic diameter of CaO2 nanoparticles (dispersed in ethanol for characterization). (d) Photograph of KMnO4 solutions treated separately with different concentrations of CaO2. (e) Generated H2O2 concentrations of CaO2 in buffer solutions of different pH values for a duration of 60 min. (f) Time-dependent fluorescence intensity changes of SOSG in the "CPPO + Ce6" and "CaO2 + CPPO + Ce6" suspensions (solvent: PBS), respectively.
Figure 2
(a, b) Confocal fluorescence images of the 4T1 cells that were stained with (a) Fluo-4 AM (a Ca2+ fluorescent probe) or (b) DCFH-DA (an ROS probe) after different treatments. DCF shown in the figure is the fluorescent product of DCFH-DA, and its emission intensity can reflect the content of cellular ROS. Scale bars: 50 μm. (c) Confocal fluorescence images showing the mitochondrial membrane potential changes of the 4T1 cells that were stained with JC-1 after various treatments. Scale bar: 50 μm. (d) Ca2+ levels in the 4T1 cells (measured by flow cytometry) after different treatments. (e) ROS levels in the 4T1 cells (measured by flow cytometry) after different treatments. (f) JC-1 aggregate/monomer fluorescence ratios indicating the mitochondrial membrane potential changes of the 4T1 cells (measured by flow cytometry) after different treatments. (g) Relative viabilities of the 4T1 cells treated with different concentrations (based on CPPO or Ce6) of CPPO and/or Ce6. The molar ratio of CPPO to Ce6 was 1:1. (h) Relative viabilities of the 4T1 cells treated with different concentrations of CaO2 with or without "CPPO + Ce6". The concentration of CPPO (or Ce6) was 4 μmol/L. (i) Intracellular ATP levels in the 4T1 cells after different treatments. (j, k) Immunofluorescence staining results of (j) HMGB1 and (k) CRT in the 4T1 cells after various treatments. The cell nuclei were stained blue by Hoechst 33342 (Hoechst). The green fluorescence in (j) indicates the presence of HMGB1. The green fluorescence in (k) indicates the presence of CRT. Scale bars: 50 μm. All the statistical data are presented as mean ± standard deviation (SD) (n = 3). Statistical significance in (d–g, i) was calculated via one-way ANOVA with a Tukey's post-hoc test. Statistical significance in (h) was calculated via two-tailed Student's t-test. *P < 0.05, **P < 0.01, ***P < 0.001, ****P < 0.0001. ns: nonsignificant difference.
Figure 3
(a) Average tumor growth curves of the 4T1 tumor-bearing BALB/c mice after different treatments. (b) Average tumor growth curves of the B16F10 tumor-bearing C57BL/6 mice after different treatments. Data are presented as mean ± SD (n = 5 mice per group). Statistical significance in (a, b) was calculated via one-way ANOVA with a Tukey's post-hoc test. (c) TUNEL assay, Ki-67 assay, and Alizarin Bordeaux staining results of the B16F10 tumor regions of different groups. The green dashed region indicates the calcified area. Scale bar: 100 μm. (d–f) Representative flow cytometric plots of (d) CD80+CD86+ DCs in TDLNs, (e) F4/80+CD11c+ macrophages in tumors, and (f) CD3+CD4+ T cells and CD3+CD8+ T cells in TDLNs collected from B16F10 tumor-bearing C57BL/6 mice 2 d after different treatments. (g–i) Relative quantification results of (g) CD80+CD86+ DCs in TDLNs, (h) F4/80+CD11c+ macrophages in tumors, (i) CD3+CD8+ T cells in TDLNs collected from B16F10 tumor-bearing C57BL/6 mice 2 d after different treatments. Data are presented as mean ± SD (n = 3 mice per group). Statistical significance in (g–i) was calculated via one-way ANOVA with a Tukey's post-hoc test. *P < 0.05, **P < 0.01, ***P < 0.001, ****P < 0.0001.


 DownLoad:

 下载:
下载:


 下载:
下载:

