Received Date:
26 June 2025 Accepted Date:
09 August 2025 Revised Date:
31 July 2025 Available Online:
15 November 2026
Abstract:
Owing to the structural and compositional flexibility feature, antiperovskites have garnered widespread attention, and been regarded as promising catalysts. However, their intrinsic sluggish kinetics impede their practical applications. Herein, a CoN0.73Co3@CoFeN(OH)x is constructed by a developed oxidation technology, endowing exceptional performance toward hydrogen evolution reaction (HER) and oxygen evolution reaction (OER) at ampere-level current densities. The advanced nature of our as-prepared antiperovskite could be further evidenced by an assembled alkaline electrolyzer (CoN0.73Co3@CoFeN(OH)xCoN0.73Co3@CoFeN(OH)x), yielding a current density of 1000 mA/cm2 with 1.89 V, and stable working for over 100 h. Operando characterizations clarify that iron atoms in the antiperovskite skin promote the generation of CoOOH active species. Theoretical calculations are referred to understand the decent catalytic activity, which reveals that Fe atoms are responsible for the favorable adsorption of the OOH oxygen intermediate and modulate the hydrogen adsorption strength. This work paves a solid way for engineering the antiperovskites for green hydrogen generation applications.
In light of the mounting environmental pollution, there has been a growing commitment among individuals and organizations to identify and implement clean, pollution-free renewable energy sources. Hydrogen (H2) as a clean energy source [1] is considered one of the most promising fuels to replace fossil energy sources because of its high energy density (approximately 2.7 times that of oil) and lack of pollution after combustion [2,3]. Of note, the conventional method for hydrogen production is through the reforming of hydrogen from natural gas and other sources, which inevitably results in the generation of byproducts [4]. Generation of hydrogen via electrocatalytic water splitting is an appealing green strategy, especially when the process is powered by renewable energy sources (solar energy, wind energy, and so on). The water splitting process consists of two half-reactions, including cathodic hydrogen evolution reaction (HER) [5] and anodic oxygen evolution reaction (OER) [6]. It is well established that precious metal-based materials are currently the benchmarks for water splitting electrocatalysts, however, their scarcity and high-cost nature considerably restrict their largescale utilization [7,8]. Therefore, it is highly desirable to develop cost-effective OER and/or HER catalysts with active, abundant, and robust surface reactive sites [9]. In recent years, great efforts have been devoted to developing low-cost alternative transition metal-based materials, such as oxides [10,11], sulfides [12], phosphides [13], carbides [14], LDHs [15,16], MOFs [17], and their composites [18,19], due to their tunable structure, stability, as well as high reserve. However, very few materials can really satisfy the necessary conditions for an ideal catalyst, such as good electrical conductivity, high catalytic activity, and durability for both HER and OER. Consequently, exploration of new, low-cost, and highly efficient electrocatalysts for green hydrogen remains imperative.
Among the earth-abundant elements family, transition metal nitrides have been widely used in various catalysis reactions owing to their high melting point, high hardness and unique electronic structure. Recently, antiperovskites have started to emerge as promising electrocatalysts. Interestingly, the antiperovskite nitrides with the chemical formula ANM3, in which the A and M represent transition metals [20], have been receiving widespread attention as a typical type of transition metal nitride. The anti-perovskite structure, characterized by high electrical conductivity, effectively minimizes electron transfer resistance-an essential attribute for enhancing catalytic kinetics-while its high-symmetry (predominantly cubic) crystallographic architecture confers robust resistance to structural degradation or metal dissolution under electrocatalytic operating conditions (e.g., acidic/alkaline electrolytes, high voltages). Among them, Co-based antiperovskite nitrides, have gained prominence in electrocatalysis because of their extensive range of raw materials and exceptional physical properties [21,22]. Nevertheless, Co-based antiperovskite nitrides exhibit inferior activity and larger reaction energy barriers, significantly impeding the ability to react with transition metals [23]. These reaction energy barriers severely restrict their applicability in electrocatalysis. It was reported that modifying catalysts by adding certain metal elements can modulate the electronic structure and reduce the reaction energy barriers, thereby enhancing catalytic performance. For instance, Qu et al. [24] synthesized Mo-CuNCo3@CoN nanowires on NF by combining CuNCo3 and Mo, which increased specific surface area, decreased reaction kinetics, and improved the HER performance. Shao et al. [25] represented that FeCl3 solution could further oxidize LaNiO3 to form FeNi hydroxide on its surface, which could increase the specific surface area and active sites, thereby promoting the OER process. Since antiperovskite nitrides contain a greater number of transition metal elements, it is assumed that involving certain metal elements in the antiperovskite nitrides in a way could vary the local electron density, which that in turn optimize the adsorption of the intermediates during the catalytic process, and leading to advanced catalytic performance.
Herein, we report a novel and highly efficient bifunctional electrocatalysts of Co-based antiperovskite nitrides for overall water splitting. The catalyst demonstrates excellent HER and OER catalytic activity under alkaline conditions, requiring 218 and 334 mV for driving a current density of 1000 mA/cm2, respectively. As expected, it delivers remarkable catalytic activity for a configured alkaline electrolyzer (CoN0.73Co3@CoFeN(OH)x||CoN0.73Co3@CoFeN(OH)x), for which it requires only 1.89 and 1.95 V driving voltage to yield high current densities of 1000 mA/cm2 and 1500 mA/cm2, respectively. Furthermore, the advanced nature of the as-prepared antiperovskite could also be validated for robust stability for over 100 h (at 1000 mA/cm2). Combing the experimental observation and theoretical calculations, it discloses that the preactivation can improve the valence state of the active Co cation (because of the introduction of Fe cations), which optimizes the adsorption of generated intermediates, and finally leads to enhanced HER and OER activity.
Chemicals: Cobalt nitrate hexahydrate (99%), iron chloride hexahydrate (99%), urea, RuO2 (99.9%) and IrO2 catalyst (99.9%) were purchased from Aladdin Ltd. All the reagents and chemicals were used without further purification.
Preparation of CoN0.73Co3: The CoN0.73Co3 has been synthesized via a hydrothermal method. Typically, 4 mmol Co(NO3)2·6H2O and 14 mmol urea was dissolved in a mixture of 60 mL deionized water. Then, the above solution and a NF (4 × 4 cm) were sealed in a 100 mL Teflon-lined autoclave and maintained at 120 ℃ for 10 h. After cooling to room temperature, the precursor was collected and washed with deionized water and ethanol for three times, respectively. The obtained precursor was dried in an oven at 60 ℃ for 12 h. Subsequently, the prepared precursor went through a heat treatment at 420 ℃ for 2 h under NH3 atmosphere in a tube furnace. After cooling down to the room temperature, the atmosphere of the furnace was replaced with N2 flow. Then the end of the furnace was open with the continuous N2 flow pumping to slowly exposure the derived nitride to the air before taking it out.
Preparation of CoN0.73Co3@CoFeN(OH)x-Y: A solution containing 50 mL of deionized water was prepared, to which 10, 30, 50, 70 and 90 mg of FeCl3·6H2O was added. The solution was then stirred thoroughly and CoN0.73Co3 was transferred into the prepared solution for 30 min. After that, the products were washed with deionized water and ethanol for three times, respectively. The collected product was dried at an oven at 60 ℃ for 12 h. The obtained catalysts were labeled as CoN0.73Co3@CoFeN(OH)x-1, CoN0.73Co3@CoFeN(OH)x-2, CoN0.73Co3@CoFeN(OH)x-3 (CoN0.73Co3@CoFeN(OH)x), CoN0.73Co3@CoFeN(OH)x-4, CoN0.73Co3@CoFeN(OH)x-5.
Characterizations: XRD analysis was conducted on a Rigaku MiniFlex 600 (Rigaku, Japan) using Cu Kα (λ = 1.5406 Å, 40 kV, 15 mA). TEM images, HR-TEM images and HAADF/STEM images are collected from a JEM-2100F transmission electron microscope. XPS analysis was performed on a photoelectron spectrometer Scientific K-Alpha (Thermo Fisher). SEM images were obtained on a Hitachi SU8010. EPR was determined by an electron paramagnetic resonance spectrometer (BRUKE EMX). Raman spectra were tested on a Thermo Fisher DXRxi Evolution spectroscope with a laser excitation wavelength of 532 nm (Thermo Fisher).
Electrochemical measurements: All electrochemical measurements were conducted on a CHI760e (CH Instruments, Inc., Shanghai, China) with a conventional three-electrode system, in which a Hg/HgO (1.0 mol/L KOH) electrode and carbon rod were used as the reference and counter electrodes. The nickel foam (NF, 1 cm × 1 cm) electrode was used as the working electrode. The inks were prepared by mixing 5 mg catalyst powders with 560 µL ethanol, 400 µL deionized water and 40 µL Nafion solution. The catalyst loading was 1.2 mg/cm2. Before collecting the OER and HER polarization curves, the evaluated electrodes would undergo cyclic voltammetry (CV) cycling between 0-0.7 V and -0.8~-1.3 V at 50 mV/s to obtain a stable curve. The OER and HER polarization curves were collected with a scan rate of 5 mV/s. All the collected potentials were converted versus reversible hydrogen electrode (RHE) by equation:
ERHE=EHg/HgO+0.924
(1)
The potentials of the OER and HER polarization curves were processed with 95%iR compensation. The electrochemical impedance spectroscopy (EIS) was collected over the frequency between 0.1 Hz and 105 Hz at different potentials. The electrochemical surface area (ECSA) was measured according to the capacitance area of double layers on catalysts-coated NF. The double-layer capacitance (Cdl) of OER can be calculated from the following equation:
Cdl=(ia−ic)/2ν
(2)
where the ia, ic, and ν are the anode current (at 0.15 V), cathode current (at 0.15 V) and scan rate of the CV curves collected between 0.1 V and 0.2 V with 10, 20, 40, 60, 80 and 100 scan rates, respectively. The Cdl of HER can be calculated from Eq. 2, where the ia, ic, and ν are the anode current (at -0.85 V), cathode current (at -0.85 V) and scan rate of the CV curves collected between -0.9 V and -0.8 V with 10, 20, 40, 60, 80, and 100 scan rates, respectively.
The ECSA can be calculated by the followed equation:
ECSA=Cdl/Cs
(3)
where the Cs is 0.04 mF/cm2.
The mass activity is calculated in this paper by the following formula:
MA=I/M
(4)
where the M is the loading amount of the catalyst. For HER, I is the current density at a catalyst overpotential of 100 mV. For OER, I is the current density at a catalyst overpotential of 300 mV.
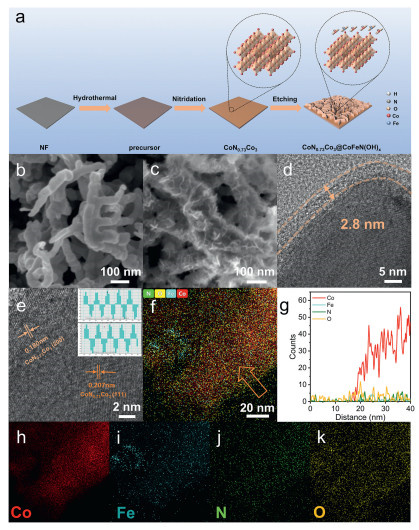
A modified hydrothermal method reported in a previous study was employed to synthesize the precursors of CoN0.73Co3 [26] and CoN0.73Co3@CoFeN(OH)x-Y, which is schematically shown in Fig. 1a (see details in the Experimental in Supporting information). In brief, the precursor was prepared via a straightforward hydrothermal method and subsequently annealed in a tube furnace at 420 ℃ for 2 h to yield CoN0.73Co3. The obtained CoN0.73Co3 was then subjected to FeCl3·6H2O solution to realize etching, resulting in the formation of CoN0.73Co3@CoFeN(OH)x-Y (Y = 1, 2, 3, 4 and 5). Since CoN0.73Co3@CoFeN(OH)x-3 delivers the best catalytic activity among the samples (will be talked about in detail hereinafter), CoN0.73Co3@CoFeN(OH)x-3 is termed as CoN0.73Co3@CoFeN(OH)x for simplicity, unless otherwise noted. This etching is similar to the reaction of the introduction of Fe with metallic Cu in traditional printed circuit boards. However, differently, there is an electron-enriched N Lewis base in the metallic CoN0.73Co3, which gives rise to the difference in the behavior of the leaching cations between these two reactions.
Figure 1
Figure 1.
(a) Schematic illustration for fabricating CoN0.73Co3 and CoN0.73Co3@CoFeN(OH)x.. (b, c) SEM images of CoN0.73Co3 and CoN0.73Co3@CoFeN(OH)x. (d, e) HRTEM images of CoN0.73Co3@CoFeN(OH)x. (f) EDS mapping of CoN0.73Co3@CoFeN(OH)x. (g) Line profiles of Co, Fe, N and O extracted from the position marked by a yellow arrow in (f). (h-k) the corresponding EDS mapping of Co, Fe, N and O in CoN0.73Co3@CoFeN(OH)x.
The corresponding antiperovskite crystal structure of CoN0.73Co3 is shown in the inset of Fig. 1a, as we can see that the cobalt occupies the vertex and face-center positions, respectively, while nitrogen occupies the center position [20,26]. To investigate the effect of the introduction of Fe on the surface morphology and textural details of the catalysts, SEM and TEM were carried out. The CoN0.73Co3 were immersed in FeCl3 solution for different pretreated concentrations of the introduction of FeCl3 (10, 30, 50, 70, and 90 mg). As can be seen the NF exhibited a smooth surface (Fig. S1a in Supporting information) and CoN0.73Co3 exhibited the formation of a multitude of dendritic structures (Figs. S1b and S2 in Supporting information). Notably, the CoN0.73Co3@CoFeN(OH)x exhibited the growth of a considerable number of sheet structure on the surface of the dendritic structure (Figs. 1b and c). As the concentration of Fe increased, the external structure became increasingly rough, and the sheet structures began to agglomerate when the concentration exceeded 50 mg (Figs. S3a-f in Supporting information). This indicates that the optimal introduction of Fe increases both the reaction contact area and the active sites of the catalyst. Conversely, excessive introduction of Fe leads to thicker agglomeration on the surface, covering the original active sites to some extent. It is hypothesized that optimizing the catalyst’s surface morphology with the ideal Fe concentration is a key factor in enhancing performance. The representative TEM image with close observation revealed the formation of a 2.8 nm thick amorphous layer on the outer surface of CoN0.73Co3@CoFeN(OH)x (Fig. 1d and Fig. S4 in Supporting information), demonstrating a typical core-shell structure. The interfacial region of CoN0.73Co3 exhibits a complete absence of an amorphous phase (Fig. S5 in Supporting information). The HRTEM images in Fig. 1e and Fig. S6 (Supporting information) reveal lattice spacings of 0.207 and 0.180 nm, corresponding to the (111) and (200) interplanar spacings of CoN0.73Co3. The result of line scanning (Figs. 1f and g) shows that the amorphous layer on the catalyst surface consists of elements such as Co, Fe, N, and O, which is consistent with the amorphous layer observed in the TEM image [27]. Furthermore, EDS elemental mapping further confirms that the catalyst is composed of elements such as Co, Fe, N, and O (Figs. 1h−k). From the aforementioned tests, it is tentatively concluded that the introduction of Fe leads to the formation of Co, Fe, N oxides or hydroxides on the surface.
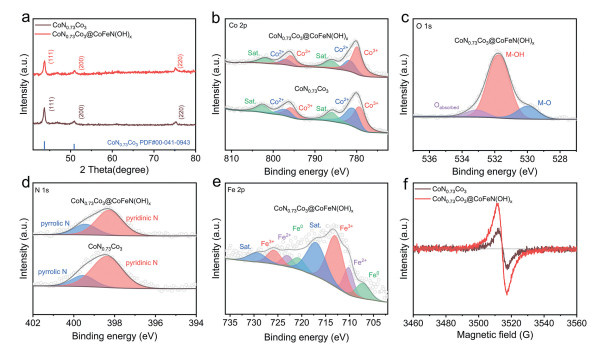
To reveal the structure and composition of the various prepared samples, XRD measurements were first performed. As illustrated in Fig. 2a, the CoN0.73Co3 sample displayed three diffraction peaks at 2θ = 43.72°, 50.86°, and 74.96°, corresponding to the (111), (200), and (220) crystal planes of CoN0.73Co3 (PDF #00-041-0943), respectively. XPS analysis was further performed to analyze the chemical composition and valence states of the CoN0.73Co3 and CoN0.73Co3@CoFeN(OH)x catalysts. When CoN0.73Co3 is immersed in the FeCl3 solution, it can form Fe-O-Co coordination bonds with Fe3+. Given that the Co sites in CoN0.73Co3 exhibit a relatively low valence state, they tend to lose electrons, leading to charge transfer and subsequent oxidation to Co3+. This is corroborated by the increased area ratio of the Co3+ characteristic peak in the Co 2p XPS spectra. In the Co 2p XPS spectra of the catalyst (Fig. 2b), the peaks at 780.0 and 795.8 eV are characteristic peaks of Co3+, the peaks at 781.7 and 797.1 eV are Co2+, and the peaks at 786.2 and 802.1 eV are satellite peaks [28]. The increase in the peak area of Co3+ after the introduction of Fe indicates that part of Co2+ is converted to Co3+ [29]. As illustrated in Fig. 2c, the O 1s spectra can be deconvoluted into three peaks: 529.9 eV for metal oxide (M-O), 531.8 eV for metal hydroxide (M-OH), and 533.2 eV for adsorbed oxygen (Oabsorbed) [23,30]. The peak area of M-OH is larger. This suggests that metal hydroxides are predominantly present on the catalyst surface [31,32]. In the N 1s spectrum, the signal peaks observed at 398.1 and 399.4 eV can be attributed to pyridinic N and pyrrolic N, respectively (Fig. 2d) [33]. Fig. 2e illustrates the Fe 2p spectra of the catalysts following the introduction of Fe. The peaks at 707.2 and 720.8 eV can be assigned to Fe monomers, while the peaks at 710.3 and 723.1 eV correspond to Fe2+ [34], the peaks at 713.1 and 725.8 eV correspond to Fe3+, and the peaks at 717.1 and 729.5 eV correspond to satellite peaks [35-37]. The initial stage of Fe etching is characterized by the formation of a passive film. At localized sites where the film experiences rupture, the exposed Fe substrate is prone to undergo either direct dissolution or disproportionation reactions, which in turn facilitate the formation of Fe aggregates. This mechanistic pathway plausibly rationalizes the detection of metallic Fe0 in the Fe 2p XPS spectrum of the catalyst. The EPR spectra shown in Fig. 2f indicate that more nitrogen vacancies were formed after the introduction of Fe. This suggests that the introduction of Fe may have altered the electronic structure of the catalyst, thereby enhancing its electrocatalytic performance to some extent.
Figure 2
Figure 2.
(a) XRD patterns of CoN0.73Co3 and CoN0.73Co3@CoFeN(OH)x. (b) Co 2p XPS spectra of CoN0.73Co3 and CoN0.73Co3@CoFeN(OH)x. (c) O 1s XPS spectrum of CoN0.73Co3@CoFeN(OH)x. (d) N 1s XPS spectra of CoN0.73Co3 and CoN0.73Co3@CoFeN(OH)x. (e) Fe 2p XPS spectrum of CoN0.73Co3@CoFeN(OH)x. (f) EPR spectra of CoN0.73Co3 and CoN0.73Co3@CoFeN(OH)x.
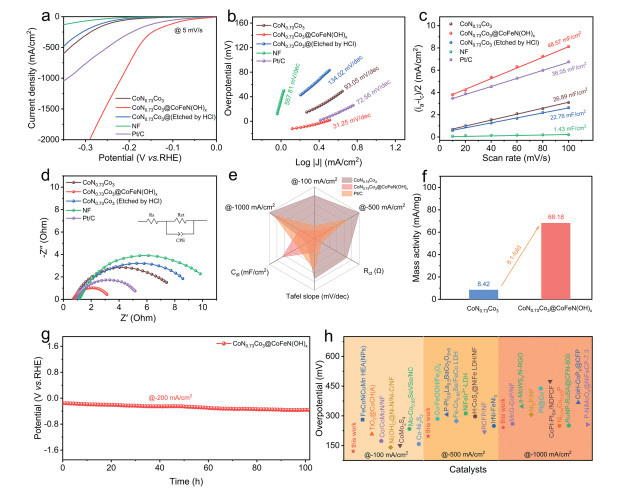
To further investigate the electrocatalytic performance of the catalysts, electrochemical measurements were conducted on control samples prepared under various conditions (CoN0.73Co3@CoFeN(OH)x-Y, where Y = 1, 2, 3, 4, 5) using a three-electrode system in a 1 mol/L KOH electrolyte [38]. To visually demonstrate the etching effect of Fe, the catalyst was also etched with HCl (be referred to as “CoN0.73Co3 (etched by HCl)”). As shown in Fig. 3a, the linear sweep voltammetry (LSV) curves for the hydrogen evolution reaction (HER) revealed that the CoN0.73Co3@CoFeN(OH)x electrode exhibited significantly enhanced HER activity compared to the pristine CoN0.73Co3. The overpotentials of CoN0.73Co3@CoFeN(OH)x-Y (Y = 1, 2, 3, 4, 5) at a current density of -500 mA/cm2 were 289, 257, 179, 258, and 283 mV, respectively (Fig. S7 in Supporting information). These values indicate a substantial improvement in performance compared to the pristine CoN0.73Co3 (335 mV). Furthermore, the CoN0.73Co3@CoFeN(OH)x catalyst achieved current densities of -100, -500, and -1000 mA/cm2 at overpotentials of 94, 179, and 218 mV, respectively. This enhancement can likely be attributed to the synergistic interaction between Co and Fe in the catalyst. In the high-current region, the performance of CoN0.73Co3@CoFeN(OH)x surpassed that of Pt/C, which may be due to the efficient mass transport facilitated by its porous structure. The excellent HER activity was further supported by the Tafel slope derived from LSV curve analysis, which showed that CoN0.73Co3@CoFeN(OH)x exhibited a low Tafel slope of 31.25 mV/dec (Fig. 3b and Fig. S8 in Supporting information). Additionally, the bilayer capacitance, calculated from tests conducted at different scan rates within the non-Faradaic region, is presented in Fig. 3c. The results demonstrate that CoN0.73Co3@CoFeN(OH)x had an electrochemical capacitance of 48.57 mF/cm2, which is higher than that of the other catalysts (Fig. S9 in Supporting information). This indicates that the CoN0.73Co3@CoFeN(OH)x catalyst, treated at the optimal concentration, possesses a greater number of active sites [39]. This suggests that the addition of the introduction of Fe further enhanced the electrocatalytic activity. The introduction of Fe significantly reduced the charge transfer resistance (Fig. 3d) [5,40], and CoN0.73Co3@CoFeN(OH)x exhibited the lowest charge transfer resistance (2.5 Ω), demonstrating the excellent charge transfer ability of the catalyst. The radar plot of Fig. 3e and Table S1 (Supporting information) can be visualized in a more intuitive manner by noting that CoN0.73Co3@CoFeN(OH)x has the lowest overpotential, impedance and Tafel slopes, and the largest electrochemically active area. As illustrated in Fig. 3f and Figs. S10 and S11 (Supporting information), CoN0.73Co3@CoFeN(OH)x exhibited the highest ECSA and mass activity (68.18 mA/mg), which was approximately 8.1-fold that of CoN0.73Co3 (8.42 mA/mg). In addition to the lower overpotential, the stability of the catalyst is an important criterion for the excellence of the catalyst. Therefore, a stability test was performed at current density of -200 mA/cm2 for 100 h (Fig. 3g). The voltage in the HER stability exhibited a more pronounced change over time, which we inferred was due to the oxidation of the carbon rods (Fig. S12 in Supporting information). This was evidenced by the observation that the rods were almost completely consumed after the stability test. Compared with other catalysts, the lower overpotential of CoN0.73Co3@CoFeN(OH)x demonstrates a significant competitive advantage (Fig. 3h and Table S3 in Supporting information). Furthermore, cyclic voltammetry (CV) stability tests (Fig. S13 in Supporting information) revealed exceptional durability of the catalyst, which maintained its structural and electrochemical integrity over 5000 cycles. Notably, the overpotential increased by only 17.8 mV at a current density of -1000 mA/cm2, demonstrating minimal degradation under high-current-density conditions.
Figure 3
Figure 3.
(a) Polarization curves of catalysts. (b) Tafel plots of the catalysts. (c) Double-layer capacitance obtained by the current density at different scan rates of the catalysts. (d) Nyquist plots of the catalysts. (e) Plots of overpotentials at -100, -500, -1000 mA/cm2, Rct, Cdl and Tafel slope. (f) Comparison of mass activity plots of CoN0.73Co3 and CoN0.73Co3@CoFeN(OH)x. (g) chronopotentiometry result of CoN0.73Co3@CoFeN(OH)x at -200 mA/cm2. (h) Potential plots of catalysts used for the HER (-100, -500 and -1000 mA/cm2).
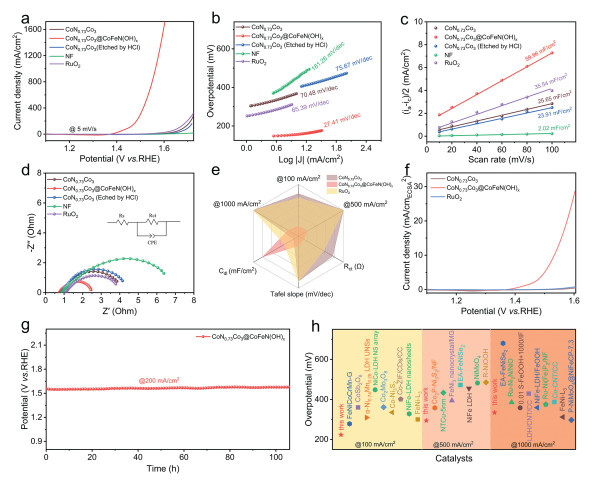
The OER performance the as-obtained catalysts were tested using the same three-electrode system. The typical LSV polarization curves of the catalysts are displayed in Fig. 4a, as we can see that CoN0.73Co3@CoFeN(OH)x exhibited the lowest overpotential (162 mV) at a current density of 10 mA/cm2, lower than that of the other catalysts of CoN0.73Co3@CoFeN(OH)x-Y (Fig. S14 in Supporting information) and NF. Moreover, the catalyst exhibits superior OER performance at high current densities, demonstrating overpotentials of only 334 mV and 363 mV to reach 1000 and 1500 mA/cm2, respectively. Fig. 4b and Fig. S15 (Supporting information) illustrate the Tafel slopes of the various catalysts, with CoN0.73Co3@CoFeN(OH)x exhibits the lowest Tafel slope (27.41 mV/dec), which is significantly lower than that of CoN0.73Co3 (70.48 mV/dec), CoN0.73Co3@CoFeN(OH)x-1 (49.19 mV/dec), CoN0.73Co3@CoFeN(OH)x-2 (42.21 mV/dec), CoN0.73Co3@CoFeN(OH)x-4 (44.81 mV/dec), CoN0.73Co3@CoFeN(OH)x-5 (55.74 mV/dec), and CoN0.73Co3 (etched by HCl) (75.67 mV/dec). The lowest Tafel slope of CoN0.73Co3@CoFeN(OH)x indicates the fastest OER kinetics [41]. The CoN0.73Co3@CoFeN(OH)x sample exhibited the largest double-layer capacitance of 59.96 mF/cm2 among the samples (Fig. 4c and Fig. S16 in Supporting information) tested at different scan rates. This suggests that CoN0.73Co3@CoFeN(OH)x retains the highest activity in the OER [42]. Additionally, CoN0.73Co3@CoFeN(OH)x also exhibited the highest mass activity of 256.66 mA/mg (Fig. S18 in Supporting information). The CoN0.73Co3@CoFeN(OH)x sample shown in Fig. 4d illustrates the lowest impedance (1.6 Ω), corroborating the enhanced capacity to transfer electrons. In addition, the radar plot shown in Fig. 4e and Table S4 (Supporting information) provide a more intuitive view of the catalyst’s excellent OER performance. The ECSA normalized curves of Fig. 4f shows that CoN0.73Co3@CoFeN(OH)x has the best intrinsic activity. This is also demonstrated by the TOF calculations in Fig. S20 (Supporting information). To further investigate the stability of the catalysts in OER, we performed stability tests at 200 mA/cm2 for more than 100 hours (Fig. 4g), which showed that the catalysts had excellent stability. The performance of CoN0.73Co3@CoFeN(OH)x is significantly superior to other catalysts at different current density (Fig. 4h and Table S6 in Supporting information), demonstrating the advantages of this approach. Accelerated durability testing via 5000 cyclic voltammetry (CV) cycles (Fig. S21 in Supporting information) revealed excellent electrochemical stability, with a marginal overpotential increase of merely 12.1 mV at 1000 mA/cm2. This negligible degradation underscores the catalyst’s exceptional operational stability under high-current-density conditions.
Figure 4
Figure 4.
(a) Polarization curves of catalysts. (b) Tafel plots of the catalysts. (c) Double-layer capacitance obtained by the current density at different scan rates of the catalysts. (d) Nyquist plots of the catalysts. (e) Plots of overpotentials at 100, 500, 1000 mA/cm2, Rct, Cdl and Tafel slope. (f) Comparison of ECSA normalization plots of CoN0.73Co3and CoN0.73Co3@CoFeN(OH)x. (g) chronopotentiometry result of CoN0.73Co3@CoFeN(OH)x at 200 mA/cm2. (h) Potential plots of catalysts used for the OER (100, 500 and 1000 mA/cm2).
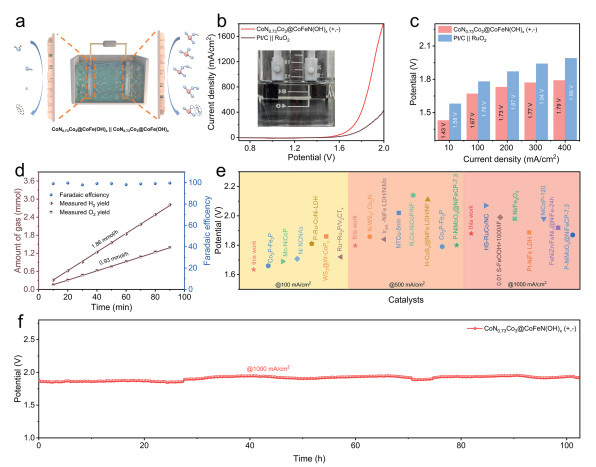
Given that CoN0.73Co3@CoFeN(OH)x exhibits desirable conductivity and mass transfer performance, and satisfactory bifunctional properties for HER and OER. For concept verification, a water-splitting device constructed using a CoN0.73Co3@CoFeN(OH)x electrode as both the anode and cathode (denoted as CoN0.73Co3@CoFeN(OH)x (+, -)) was assembled to evaluate the catalytic performance in 1 mol/L KOH electrolyte. The schematic diagram of the test setup is shown in Fig. 5a. The electrocatalytic activity of CoN0.73Co3@CoFeN(OH)x (+, -) for monolithic water splitting was investigated at different current densities. As illustrated in Fig. 5b, the catalysts exhibited a voltage requirement of only 1.67, 1.82, 1.89, and 1.95 V for water splitting at current densities of 100, 500, 1000 and 1500 mA/cm2, respectively. And this voltage is much lower than commercial RuO2||Pt/C electrode (Fig. 5c). During the water splitting process, demonstrating the excellent performance of those two electrodes. The Faraday efficiency was calculated based on the exhaust gas method. As we can see from Fig. 5d, the actual H2 and O2 yields were nearly identical to the theoretical yields, and the H2 and O2 yields were 2:1. The Faraday efficiency was close to 100%, indicating that the no by-product was generated during the reaction process. Compared to recently reported high-performance bifunctional catalysts (Fig. 5e and Table S7 in Supporting information), CoN0.73Co3@CoFeN(OH)x (+, -) exhibits a lower cell voltage, which remained stable over 100 h at a current density of 1000 mA/cm2 (Fig. 5f). The theoretical voltage efficiency was determined by analyzing the voltage differential at 1000 mA/cm2 before and after 5000 CV cycles (Fig. S22 in Supporting information). Based on this evaluation, the overall water-splitting catalyst demonstrated a remarkable voltage efficiency of 98.7%, highlighting its exceptional electrochemical stability and energy conversion performance.
Figure 5
Figure 5.
(a) Schematic illustration of the overall water splitting reaction device. (b) Polarization curves of CoN0.73Co3@CoFeN(OH)x||CoN0.73Co3@CoFeN(OH)x. (c) Comparison plots of Pt/C||RuO2 and CoN0.73Co3@CoFeN(OH)x||CoN0.73Co3@CoFeN(OH)x. (d) H2 and O2 yields and Faraday efficiency plots during the overall water splitting reaction. (e) Potential plots of catalysts used for the overall water splitting reaction (100, 500, 1000 mA/cm2). (f) Stability test curve of the overall water splitting reaction at 1000 mA/cm2.
Given that the transition metal nitrides are prone to decomposition into other substances after the reaction, and previous studies have frequently reported significant changes in the surface morphology of catalysts post-reaction, we characterized the catalysts after the HER and OER processes. Comparative SEM images before and after the HER showed that the original morphology of the catalysts was retained (Fig. S24 in Supporting information). The HRTEM images revealed that the boundary layer persisted after the reaction (Fig. S25a in Supporting information). The HRTEM images demonstrated that the lattice stripes on the main crystal surface (111) of CoN0.73Co3 remained discernible after the reaction (Fig. S25b in Supporting information). The EDS images showed uniform elemental distribution after the reaction, with no signs of agglomeration (Fig. S26 in Supporting information). SEM images of the catalyst after OER showed that a small portion of the nanosheets had disappeared, but the overall structure remained largely intact, indicating that the metal hydroxide layer on the outside of the catalyst was involved in OER (Fig. S27 in Supporting information). The post-reaction HRTEM image shows a clear amorphous layer at the edge of the catalyst (Fig. S28 in Supporting information), and a clear lattice stripe of CoN0.73Co3 can still be seen in the interior of the amorphous layer, suggesting that the overall structure is still preserved after the OER. Interestingly, a clear lattice stripe appears in part of the amorphous layer after the OER, which was determined to be the (012) crystalline surface of CoOOH, suggesting that the metal hydroxide on the catalyst surface was converted to CoOOH during the OER. As shown in the Fig. S29 (Supporting information), lattice fringes corresponding to the (012) crystal plane of CoOOH are observed in the interior of CoN0.73Co3 after the OER. In contrast, the internal structure of the Fe3+-etched CoN0.73Co3@CoFeN(OH)x catalyst remains intact. These observations indicate that the surface amorphous layer protects the internal anti-perovskite structure of the catalyst to a certain extent [43]. The EDS images (Fig. S30 in Supporting information) confirmed that the elements remained uniformly distributed after the OER, providing further evidence of the catalyst’s stability. In conclusion, from the combination of HRTEM and SEM images, it can be speculated that the amorphous layer formed on the surface of the catalyst plays a protective role, which to some extent reduces the occurrence of reconstruction of the antiperovskite structure. The unique core-shell structure facilitates the enhancement of the interfacial interaction between the antiperovskite phase and the surface metal hydroxide, thus optimizing the electronic configuration of the composite system. This structural modification not only significantly improves the catalytic efficiency, but also contributes to the stability of the catalyst under operating conditions.
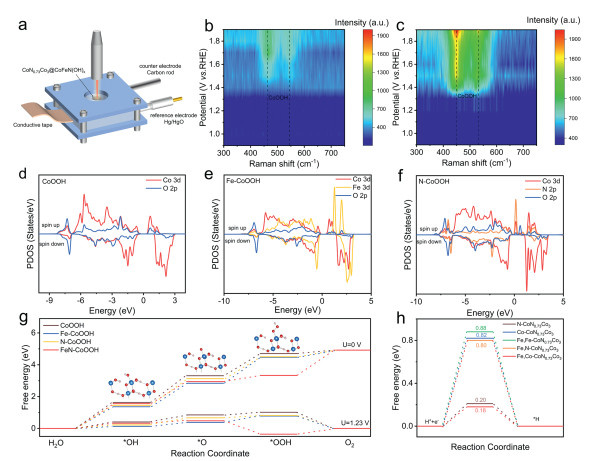
To investigate the catalytic mechanism and better understand the underlying reasons for the high electrochemical performance of this material, in situ Raman spectroscopy was conducted. The schematic diagram of the in situ Raman device is shown in Fig. 6a. The prepared CoN0.73Co3 and CoN0.73Co3@CoFeN(OH)x were mounted on the conductive adhesive, and the in situ Raman data obtained by applying different voltages are presented in Figs. 6b and c and Fig. S31 (Supporting information). Two characteristic peaks gradually emerged as the voltage increased throughout the OER. Among them, the peaks at about 455 cm−1 and 549 cm−1 correspond to CoOOH [44,45], which indicates that the active site during the OER is Co. The two observed Raman peaks were further assigned to Co-O vibrational modes of the γ-CoOOH intermediate. The CoN0.73Co3@CoFeN(OH)x catalyst inherently features enhanced unsaturated coordination, which establishes a favorable chemical environment for γ-CoOOH formation. Given the superior catalytic activity of γ-CoOOH, this facilitates improved electrocatalytic performance of the material. Notably, as the applied voltage increases incrementally, no significant shifts in the Eg and Ag vibrational peaks of CoOOH are observed, confirming its chemical stability under operating conditions. It is noteworthy that the voltages at which the characteristic peaks exhibit a significant disparity between the two samples. For CoN0.73Co3, the characteristic peaks at approximately 1.5 V (Fig. 6b and Fig. S31a in Supporting information), whereas for CoN0.73Co3@CoFeN(OH)x (Fig. 6c and Fig. S31b in Supporting information), stronger characteristic peaks emerge at approximately 1.35 V. In brief, the phenomenon suggests that the introduction of Fe is conducive to the formation of intermediate oxygen species during OER process, reduces the potential of OOH production during the OER, thereby promoting the reaction and enhancing the catalyst’s performance.
Figure 6
Figure 6.
(a) Schematic diagram of the in situ Raman device. Potential-dependent in situ Raman spectra of (b) CoN0.73Co3 and (c) CoN0.73Co3@CoFeN(OH)x during alkaline OER process. PDOS curves of (d) CoOOH with (e) Fe doping and (f) N doping. (g) Free energy diagrams of OER. (h) Free energy diagrams of HER.
To further investigate the influence of the introduction of Fe on HER and OER performance, density functional theory (DFT) calculation was carried out. OER activity was discussed based on the four-proton-coupled electron transfer mechanism proposed by Nørskov. We selected CoOOH as the basis for establishing the catalytic model (Fig. S32 in Supporting information) because that OER suffer from surface reconstruction. As shown in Figs. 6d-f, Fe and N doping can significantly change the charge distribution of Co, which can regulate the adsorption energy of intermediate to affect the OER performance [46]. Moreover, N doping introduces impurity levels near Fermi level, which can decrease the band gap and boosted conductivity. The Gibbs free energies of OER process have been calculated in Fig. 6g. As shown in Fig. 6g, CoOOH has high OER overpotential of 0.45 V due to the unsubstantial adsorbs oxygen intermediates. Fortunately, Fe and N dopants can effectively optimize adsorption energies of oxygen intermediates. The adsorption of *OH and *O can significantly strengthen, which can decrease the energy barrier from *OH to *O for CoOOH. Moreover, N atom can provide an additional adsorption energy for H atom in *OOH due to the different electronic configuration of N (three coordinating hydrogens) and O (two coordinating hydrogens), which lead to a lowing of adsorption energy of *OOH. As shown in Fig. S34 (Supporting information), Fe atom can reduce *OOH adsorption energy and break the linear relationships between the *OH and *OOH adsorption energy. The free energy of hydrogen adsorption (ΔGH), an important descriptor of activity for hydrogen studies, was subsequently calculated. Furthermore, we also calculated the electron localization function (ELF) and Bader charge (Fig. S35 in Supporting information), and the calculations showed that Fe doping can induce the formation of high valence state Co, which is consistent with the XPS results. As shown in Fig. 6h, the pristine CoN0.73Co3 possesses weaker hydrogen adsorption strength, the ΔGH of N-CoN0.73Co3 and Co-CoN0.73Co3 are 0.2 and 0.82 eV, respectively. With the Fe element introduced, the hydrogen adsorption strength is closer to the thermal equilibrium where N atom in Fe-CoN0.73Co3 have more optimized ΔGH of 0.18 eV, suggesting Fe doping can enhance hydrogen adsorption strength to obtain better HER activity, which can be elucidated via corresponding partial density of states [47]. As shown in Fig. S37 (Supporting information), Fe 3d is closer to the Fermi level compared with Co 3d, which can lift the d-band center of Co and p-band center of N, resulting in the increased hydrogen adsorption strength.
In summary, CoN0.73Co3@CoFeN(OH)x is successfully grown on nickel foam (NF) via a hydrothermal synthesis method and a self-developed oxidation strategy. The derived catalyst enables site-specific modulation of Co active sites to regulate electrocatalytic activity; through a relatively straightforward modification strategy, both hydrogen evolution reaction (HER) and oxygen evolution reaction (OER) performance are significantly enhanced. Compared to the most reported antiperovskite nitride catalysts, advanced catalytic activities are achieved, with 218 mV (HER) and 334 mV (OER) for yielding a current density of 1000 mA/cm2. The enhanced reaction kinetics of our as-prepared antiperovskite could be further evidenced for the configured electrolyzer (with 1.0 mol/L KOH electrolyte), representing 1.89 and 1.95 V at 1000 and 1500 mA/cm2, respectively. Besides, the as-assembled alkaline electrolyzer also displays excellent endurance feature after working at 1000 mA/cm2 for 100 h. Upon analysis, it is noticed that the introduction of Fe not only increased the electrocatalytic active area of the catalyst, but also formed a new CoFeN hydroxide layer on the surface of the catalyst. During the reaction process, the as-formed hydroxide skin layers optimize the adsorption of the generated intermediate species, which finally enhance the electrocatalytic activity.
The authors declare that they have no known competing financial interests or personal relationships that could have appeared to influence the work reported in this paper.
Acknowledgments
This work was financially supported by Young Talent Project of the “Xing Dian Talent Support Program of Yunnan Province” (No. KKXX202452057), Yunnan Fundamental Research Projects (No. 202101AU070183), the Yunnan Major Scientific and Technology Projects (No. 202202AG050017-02), and the National Natural Science Foundation of China (Nos. 52272202, W2421027). The authors acknowledge the technical support from the Analysis and Testing Center of Kunming University of Science and Technology.
Supplementary materials
Supplementary material associated with this article can be found, in the online version, at doi:10.1016/j.cclet.2025.111699.
[1]
A. Nairan, C. Liang, S.W. Chiang, et al., Energy Environ. Sci. 14 (2021) 1594-1601. doi: 10.1039/d1ee00106j
[2]
X. Wang, D. Li, Z. Gao, et al., J. Am. Chem. Soc. 145 (2023) 905-918. doi: 10.1021/jacs.2c09437
[3]
Y. Wang, D. Chen, J. Zhang, et al., Adv. Funct. Mater. 32 (2022) 2112738. doi: 10.1002/adfm.202112738
[4]
C.L. Huang, K. Sasaki, D. Senthil Raja, et al., Adv. Energy Mater. 11 (2021) 2101827. doi: 10.1002/aenm.202101827
Figure 1
(a) Schematic illustration for fabricating CoN0.73Co3 and CoN0.73Co3@CoFeN(OH)x.. (b, c) SEM images of CoN0.73Co3 and CoN0.73Co3@CoFeN(OH)x. (d, e) HRTEM images of CoN0.73Co3@CoFeN(OH)x. (f) EDS mapping of CoN0.73Co3@CoFeN(OH)x. (g) Line profiles of Co, Fe, N and O extracted from the position marked by a yellow arrow in (f). (h-k) the corresponding EDS mapping of Co, Fe, N and O in CoN0.73Co3@CoFeN(OH)x.
Figure 2
(a) XRD patterns of CoN0.73Co3 and CoN0.73Co3@CoFeN(OH)x. (b) Co 2p XPS spectra of CoN0.73Co3 and CoN0.73Co3@CoFeN(OH)x. (c) O 1s XPS spectrum of CoN0.73Co3@CoFeN(OH)x. (d) N 1s XPS spectra of CoN0.73Co3 and CoN0.73Co3@CoFeN(OH)x. (e) Fe 2p XPS spectrum of CoN0.73Co3@CoFeN(OH)x. (f) EPR spectra of CoN0.73Co3 and CoN0.73Co3@CoFeN(OH)x.
Figure 3
(a) Polarization curves of catalysts. (b) Tafel plots of the catalysts. (c) Double-layer capacitance obtained by the current density at different scan rates of the catalysts. (d) Nyquist plots of the catalysts. (e) Plots of overpotentials at -100, -500, -1000 mA/cm2, Rct, Cdl and Tafel slope. (f) Comparison of mass activity plots of CoN0.73Co3 and CoN0.73Co3@CoFeN(OH)x. (g) chronopotentiometry result of CoN0.73Co3@CoFeN(OH)x at -200 mA/cm2. (h) Potential plots of catalysts used for the HER (-100, -500 and -1000 mA/cm2).
Figure 4
(a) Polarization curves of catalysts. (b) Tafel plots of the catalysts. (c) Double-layer capacitance obtained by the current density at different scan rates of the catalysts. (d) Nyquist plots of the catalysts. (e) Plots of overpotentials at 100, 500, 1000 mA/cm2, Rct, Cdl and Tafel slope. (f) Comparison of ECSA normalization plots of CoN0.73Co3and CoN0.73Co3@CoFeN(OH)x. (g) chronopotentiometry result of CoN0.73Co3@CoFeN(OH)x at 200 mA/cm2. (h) Potential plots of catalysts used for the OER (100, 500 and 1000 mA/cm2).
Figure 5
(a) Schematic illustration of the overall water splitting reaction device. (b) Polarization curves of CoN0.73Co3@CoFeN(OH)x||CoN0.73Co3@CoFeN(OH)x. (c) Comparison plots of Pt/C||RuO2 and CoN0.73Co3@CoFeN(OH)x||CoN0.73Co3@CoFeN(OH)x. (d) H2 and O2 yields and Faraday efficiency plots during the overall water splitting reaction. (e) Potential plots of catalysts used for the overall water splitting reaction (100, 500, 1000 mA/cm2). (f) Stability test curve of the overall water splitting reaction at 1000 mA/cm2.
Figure 6
(a) Schematic diagram of the in situ Raman device. Potential-dependent in situ Raman spectra of (b) CoN0.73Co3 and (c) CoN0.73Co3@CoFeN(OH)x during alkaline OER process. PDOS curves of (d) CoOOH with (e) Fe doping and (f) N doping. (g) Free energy diagrams of OER. (h) Free energy diagrams of HER.


 DownLoad:

 下载:


 下载:

