Citation:
LUO Xue-Fei, GUO Lei, WEI Qian-Qian, XU Jiang-Yan, WANG Kuai-Bing, LÜ Bo. Influence of Crystallinity and Binder on the Energy Delivery Efficiency for Porous Magnesium Cobaltate Supercapacitor Electrodes[J]. Chinese Journal of Inorganic Chemistry,
2018, 34(5): 823-833.
doi:
10.11862/CJIC.2018.119
Received Date:
18 October 2017 Revised Date:
22 March 2018 Available Online:
10 May 2018
Abstract:
The magnesium/cobalt ternary oxide, porous MgCo2O4 nanostructures were synthesized by thermal decomposition of crystalline bimetallic coordination polymer precursors. As a result, various hydrothermal reaction time results in isostructural precursors with different crystallinity. When the pyrolysis temperature and binder are chose to be 500℃ and PTFE respectively, the superior practical capacitance with good energy delivery efficiency (η) is obtained. The corresponding MgCo2O4 electrode with high surface area and moderate crystallinity achieves a largest specific capacitance of 348 F·g-1, maximum η value (92.9%) and 93.7% of capacitance retention after 1 000 continuous charge-discharge cycles.
Speed of scientific and technological advance-ment is getting faster along with a huge consumption of natural recourse, which propels the exploration and development of smarter production, proper usage and storage of energy. Supercapacitor is a kind of energy storage device, employing non-faradic charge accu-mulation process (electric double layer capacitance, EDLC), faradic charge transfer process (pseudo-capacitance) or combination of both processes (hybrid capacitance)[1-6]. Considering the higher specific capa-citance and the bigger power density for the practical applications, studies related to metal-oxides-based materials have drawn too much attention due to their high theoretic capacitance. For example, many transi-tion metal oxides (TMOs) are proposed as candidates for pseudo-capacitive electrodes or as a component part in composition materials, which are extensively reported in recent references[7-10].
Compared with other binary metal oxides, Co3O4 displays high theoretical capacitance (~3 560 F·g-1) which is much higher than that of widely investigated hydrated ruthenium oxide (RuO2·nH2O) (~2 200 F·g-1) and MnO2 (~1 380 F·g-1), and offers superior energy-storage performance in experimental process[11-13]. Many efforts have been made to optimize its morphologies or introduce new metal ions (M2+) to occupy the Co(Ⅱ) sites to form TTMOs (ternary transition metal oxides), such as CuCO2O4, ZnCO2O4, NiCO2O4, MnCO2O4 and so on, which also possess high theoretic capacitance (~3 000 F·g-1) and display high cycle stability[14-20]. That′s because the combination of two metals in TTMOs encourages oxidation-reduction reactions and their structural variations offer more chances to make the performance more superior. In comparison with the introduction of transition metal ions, that of alkaline-earth metal ions is scarce to date. Krishnan and co-workers prepare an MgCO2O4 sample using molten salt method and demonstrate that the MgCO2O4 electrode[15], in comparison with the other two cobaltites (CuCO2O4 and MnCO2O4), exhibits the superior electrochemical performance with a largest capacitance of ~320 F·g-1.
In this regard, porous MgCO2O4 samples with different morphologies have been synthesized through a different method that decomposing the hybrid coordination polymer particles (CPPs). CPPs, classified as crystalline metal-organic-frameworks (MOFs) and amorphous structures, are a class of inorganicorganic hybrid materials formed by the assembly by metal ions and organic building blocks under mild conditions. Using as a kind of soft template to synthesize inorganic compounds extend the utilization range of CPPs and has even been proven very effective in the synthesis of a wide variety of hollow or porous particles[21-23]. This CPPs-conversion method has potential advantages, including simple procedure, high product purity and yield, and the morphology of precursor can easily manipulated by choosing or designing various organic ligands. Herein, Mg2+ and CO2+ are adopted as inorganic sources and choose O, N-bifunctional 8-hydroxyquino-line ligand as an organic linker. Moreover, in order to find out the best reaction conditions for good electro-chemical properties of MgCO2O4, cyclic voltammetry tests and chronopotentiometry measurements are implemented to investigate the electrochemical perfor-mance of MgCO2O4 materials under different condi-tions, such as calcination temperature and hydro-thermal treatment duration. Besides, PTFE and PVDF binder used in electrode-preparing process are also investigated separately and compared with each other.
1.
Experimental
1.1
Synthesis of Mg/Co-based coordination polymer precursors
First, the 8-hydroxyquinoline (HQ, 5.806 4 g, AR) was documented and dissolved in 100 mL ethanol solution (AR) to form a 0.2 mol·L-1 HQ-ethanol solution. Then the magnesium chloride (10.165 0 g) and the cobalt acetate (12.454 0 g) were dissolved in deionized water respectively to form 0.5 mol·L-1 MgCl2 and 0.5 mol·L-1 Co(OAc)2 aqueous solution.
For the synthesis of the precursors, in a mixed solvent (20 mL water+20 mL ethanol), 0.2 mol·L-1 HQ-ethanol solution was introduced into MgCl2 aqueous solution (2 mL) and Co(OAc)2 aqueous solution (4 mL) drop by drop under vigorous stirring for a while, and then transferred into three 50 mL Teflon-lined stained steel autoclaves which were sealed. The samples were maintained at 160 ℃ for 4, 8 and 12 h in the drying oven respectively, and cooled at room temperature naturally. The solid materials were collected by centrifugation and washed with deionized water and ethanol for five times, respectively, then dried using lyophilizer (Telstar LyoQuest) for 24 h, and denoted as 4 h-pre, 8 h-pre and 12 h-pre respectively.
1.2
Synthesis of ternary oxides MgCO2O4
MgCO2O4 was prepared by thermal decomposition method. The solid precursors of 4 h-pre, 8 h-pre and 12 h-pre were separately ground and dispersed in ethanol, and dried under vacuum in the porcelain combustion boats to make precursors pave on the bottom of vessels. Then these precursors were calcined under air surroundings at 500, 600 and 700 ℃ respectively (the heating rate: 1 ℃·min-1) for 2 h in a tube furnace to decompose the polymer into MgCO2O4 nanomaterials. After the mixtures were slowly cooled down to the room temperature, nine calcined samples were obtained, namely 4 h-500, 4 h-600, 4 h-700, 8 h-500, 8 h-600, 8 h-700, 12 h-500, 12 h-600 and 12 h-700, respectively.
1.3
Electrode preparation
In a typical procedure, the paste of electrode material was prepared by well mixing and properly grinding with 80% (w/w) active material, 10% (w/w) acetylene black and 10% (w/w) polytetrafluoroethylene (PTFE). Then the mixture was incorporated onto nickel foams, the mass loading of the pressed electrode (Manual Rolling press) ranges from 2.5 to 4.2 mg. The geometrical area of working electrode was 1 cm×1 cm. For comparison, polyvinylidene fluoride (PVDF) served as the other binder to replace PTFE and the electrode was prepared with the same method. Furthermore, these electrodes were separately soaked into 6.0 mol·L-1 KOH solution overnight before the electrochemical test.
1.4
Methods and measurements
Solvents and all other chemicals were obtained from commercial sources and used as received unless otherwise noted; water used throughout all experiment was purified with the Millipore system (18.2 MΩ·cm). X-ray powder diffraction (XRD) data were collected on a Bruker D8 Advance instrument using Cu Kα radia-tion (λ=0.154 nm, working voltage and general current: 40 kV and 40 mA, 2θ=5°~90°) at room temperature. Thermo-gravimetrical analyses (TGA) were performed in a N2 atmosphere (a flow rate of 100 mL·min-1) on a simultaneous SDT 2960 thermal analyzer from room temperature up to 700 ℃, with a heating rate of 10 ℃·min-1. The morphology of the as-prepared samples and the corresponding energy dispersive X-ray (EDX) spectroscopy were obtained by using a JEOL JSM-7500F field-emission scanning electron microscope (FE-SEM, working voltage: 5~20 kV). The adsorption isotherm of nitrogen was measured at 77 K by using V-Sorb 2800P adsorption equipment. X-ray photoelec-tron spectroscopy (XPS) was collected on an ESCALab MKII X-ray photoelectron spectrometer by using nonmonochromatized Al Kα X-ray as excitation source. N2 adsorption-desorption measurement is carried out to test the BET specific surface area. The electrochem-ical measurements were carried out by an electro-chemical analyzer system, CHI660E (Chenhua Instru-ment, Shanghai, China) in a three-compartment cell with a platinum wire counter electrode, an Hg/HgO reference electrode and a working electrode. The electrolyte was a 6.0 mol·L-1 KOH aqueous solution and electrochemical impedance spectroscopy (EIS) measurements of as-synthesized samples were condu-cted at open circuit voltage in the frequency range of 100 kHz to 10 mHz.
2.
Results and discussion
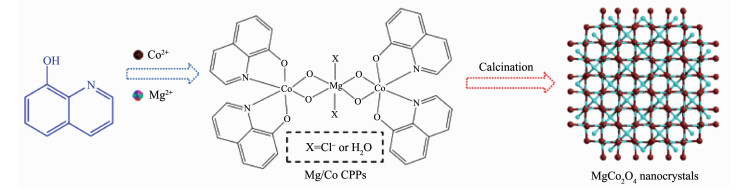
In a typical experiment, the HQ ligand was chosen for Co/Mg-based coordination polymer nano-structure precursors, namely 4 h-pre, 8 h-pre and 12 h-pre, by reacting with Mg2+ ions and CO2+ ions over different durations (Scheme 1). Fig.S1a shows a SEM image of 4 h-pre sample. It displays flake-like motifs with irregular shapes and sizes on a large scale. The magnified SEM image (Fig.S1b) reveals that the surface of each flake is almost wrinkled and no holes found. The length and the mean thickness of the flake are about 0.5~10 μm and 200 nm, respectively. Increa-sing the hydrothermal reaction time up to 8 h or 12 h, a mass of flake-like styles can still be obtained. However, the high-magnification image reveals that the surface of 8 h-pre is glossier than that of 4 h-pre (Fig.S1c). Moreover, two flakes are gathered together and the edge involves some pores, the diameter of which ranges from 20 to 200 nm and their average thickness is add to 1.2 μm (inset of Fig.S1c). The similar plate-like structure for 12 h-pre is shown in Fig.S1d. In contrast with 8h-pre sample, cumulate flakes increase up to three pieces and the mean thickness of which reaches up to 2.8 μm. The corresponding aperture soars to 40~600 nm. The result demonstrates that controlling nucleation time and coordination equibrillium between the same organic linkers and metal ions can effectively adjust the resulting size, morphology and crystallinity of CPPs.
图 Scheme 1
图 Scheme 1
Preparation process for coordination polymer precursors and the corresponding calcination products
Figure Scheme 1.
Preparation process for coordination polymer precursors and the corresponding calcination products
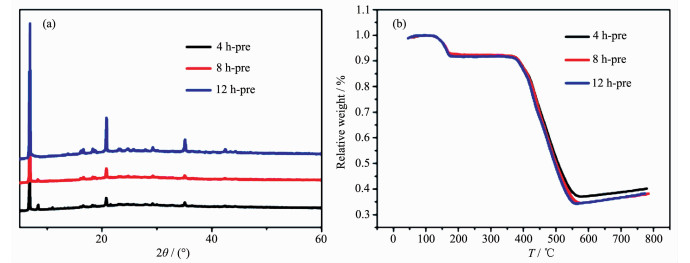
All these coordination polymer precursor species are well supported by X-ray powder diffraction as displayed in Fig. 1a, in which the diffraction peaks of the species can be readily indexed to the same compound. Furthermore, with the duration of hydrothermal reaction rising from 4 to 12 h, the diffraction peaks become sharper, which means better crystallinity. This result is in line with the gathering phenomenon for nanoflakes.
图 1
图 1
(a) XRD patterns and (b) TGA curves of 4 h-pre, 8 h-pre and 12-pre samples
Figure 1.
(a) XRD patterns and (b) TGA curves of 4 h-pre, 8 h-pre and 12-pre samples
The nature of the isostructure can also be proved by the result of TGA, as shown in Fig. 1b, reveals that three precursor samples possess the same weight loss curves. All samples were stable up to 400 ℃ after an initial weight loss of 10% due to solvent liberation. In this regard, the MgCO2O4 nanoparticles are then prepared by the calcinations of the precursors at 500, 600 and 700 ℃ separately for 2 h, using a muffle furnace. According to the later electrochemical results, the samples calcined at 500 ℃ were chosen as the representatives in the following structure characteriza-tion.
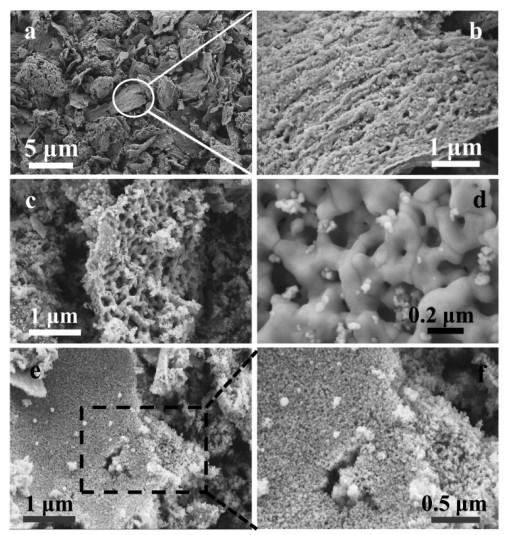
The structure of 4 h-500 maintains irregularly plate-like motif which basically inherits from precursor (Fig. 2a). From the higher magnification SEM image (Fig. 2b), the plate displays porous forms that are assembled by aggregation of a great quantity of particles with mean diameter of 10~50 nm. In contrast, the smooth fragments of 4 h-pre are mostly destroyed and transformed to a porous material that hierarchically constructed by small nanoparticles. It is reasonable because during the thermal decomposition the remarkable shrinkage would occur as gases (such as COx, NOx and H2O) are released. Except of the smooth surface, the thickness for 4 h-500 reduces to ca. 100 nm in pyrolysis process.
图 2
图 2
SEM images for 4 h-500 (a, b), 8 h-500 (c, d) and 12 h-500 (e, f)
Figure 2.
SEM images for 4 h-500 (a, b), 8 h-500 (c, d) and 12 h-500 (e, f)
By keeping other parameters unchanged, the sample of 8 h-500 can be obtained, as illustrated in Fig. 2c, which suggests that border between the pores become clearer and the morphology changes into the net-like structure in contrast with 4 h-500. The border could be gradually constructed from the nanoparticles due to the high surface energy (Fig. 2d). Besides, there are many tiny nanoparticles still adhere onto the pores of 8 h-500 and the diameter of these particles is 10~20 nm. As to 12 h-500, flake forms and the thickness of 12 h-pre are totally maintained under high-heat conditions, as shown in Fig. 2(e, f). The entirely structure was turned loosened and tightly constituted by lots of nanoparticles with the mean size of 10 nm, and therefore no porous structure were generated in comparison with the sample of 4 h-500 and 8 h-500.
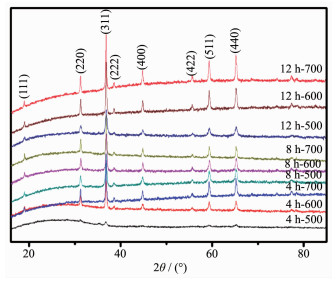
XRD patterns in Fig. 3 indicate that the phase information and the cubic structure nature of samples. The positions and intensity distributions are similar, suggesting that the materials are iso-structural. All the peaks fit well to the reported cubic spinel MgCO2O4 structure[15], corresponding to the standard card (PDF No.81-0667). The result also shows that when the calcination temperature increases from 500 to 700 ℃, the Bragg diffraction peak gets sharper, which interprets that the higher calcination temperature implemented in the tube furnace, the higher crystall-inity obtained in the final.
图 3
图 3
XRD patterns of MgCO2O4 samples calcined at different temperatures
Figure 3.
XRD patterns of MgCO2O4 samples calcined at different temperatures
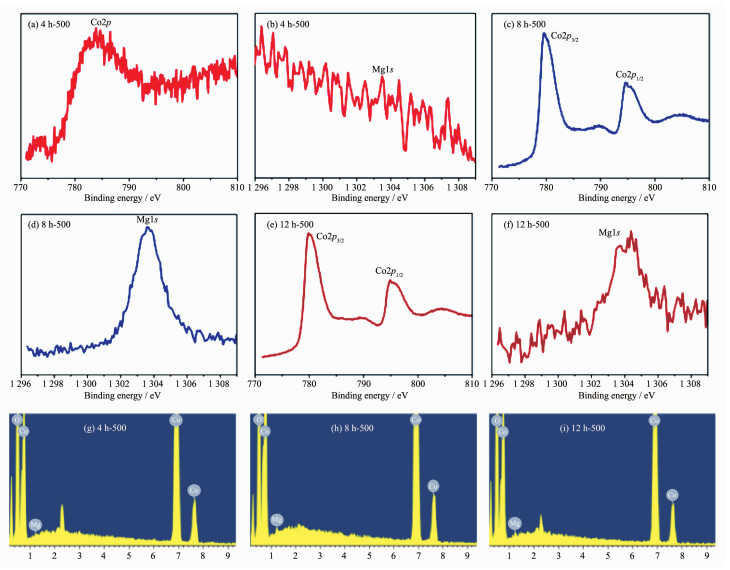
To further illustrate the composition of these compounds, the XPS experiment was carried out. Within the survey scan region (0~1 350 eV, Fig.S2), the Co and Mg species were detected as displayed in Fig. 4. The intensity of the CO2p peak and the Mg1s peak for 4 h-500 is weak in Fig. 4(a, b), which suggests that the amount of the two elements is slight on the surface for the tested samples. Fig. 4(c, e) reveals that the CO2p3/2 peak positions (779.6 and 779.8 eV for corresponding 8 h-500 and 12 h-500) and CO2p1/2 peak positions (794.8 and 794.9 eV for 8 h-500 and 12 h-500, respectively) are consistent with the expected values for MgCO2O4[24-26]. Furthermore, the splitting widths between CO2p3/2 and CO2p1/2 for 8 h-500 and 12 h-500 are 15.2 and 15.1 eV respectively, which further verify that the characteristic of Co(Ⅲ). In Fig. 4(d, f), the results of the broadening of Mg1s peak for 12 h-500 and the strong Mg1s peak for 8 h-500 are in conformity to information of XRD. Energy-dispersive X-ray (EDX) was further implemented to prove that Mg, Co and O elements were detected (Fig. 4(g~i)).
图 4
图 4
XPS spectra of Co2p and Mg1s of 4 h-500 (a, b), 8 h-500 (c, d) and 12 h-500 (e, f) samples; (g~i) EDX spectra of samples
Figure 4.
XPS spectra of Co2p and Mg1s of 4 h-500 (a, b), 8 h-500 (c, d) and 12 h-500 (e, f) samples; (g~i) EDX spectra of samples
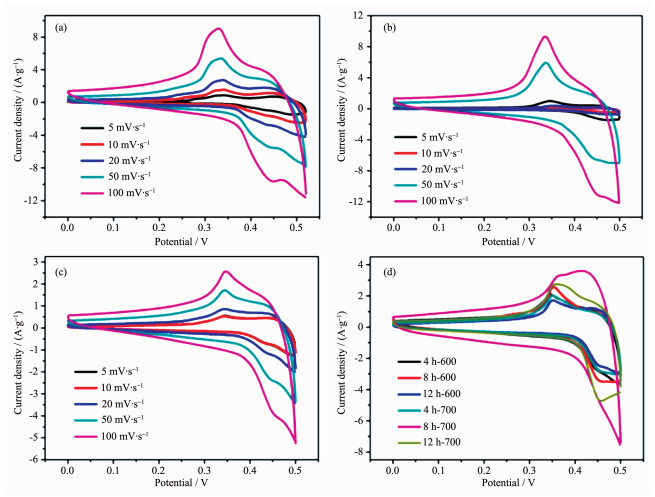
To testify the applicability of as-synthesized MgCO2O4 nanostructures as supercapacitor electrodes, their redox behaviour was studied by cyclic voltammetry (CV) in 6 mol·L-1 KOH electrolyte. For comparison, two different binders (PVDF and PTFE) were also determined to investigate the influence of different electrode-preparation techniques. CV was firstly studied using the binder PVDF to measure the capacitance of 4 h-500, 8 h-500 and 12 h-500. The CV curves show oxidation and reduction peaks during charging and discharging, indicating faradic reaction process (Fig. 5(a~c)). The redox peaks for the electrode can be ascribed to the conversion of CO4+/Co3+ with OH ions as follows.
图 5
CV curves for the as-synthesized 4 h-500 (a), 8 h-500 (b) and 12 h-500 (c) samples using PVDF binder at different scan rates; (d) CV curves for the rest of electrodes at a scan rate of 50 mV·s-1
Figure 5.
CV curves for the as-synthesized 4 h-500 (a), 8 h-500 (b) and 12 h-500 (c) samples using PVDF binder at different scan rates; (d) CV curves for the rest of electrodes at a scan rate of 50 mV·s-1
From the CV result, 4 h-500 has the largest specific capacitance among three samples. For 4 h-500, the specific capacitance is determined to be 169, 146, 122 and 90 F·g-1 at scan rates of 5, 10, 20 and 50 mV·s-1, respectively. The result shows that the higher the scan rate is, the lower the capacitance will be. This is reasonable because protons transfer process is slow during the redox process. Moreover, the higher scan rate reaches the more possibilities for protons in the electrolyte to obtain either depletion or saturation inside the electrode during the oxidation-reduction process. On the contrary, the lower voltammetric scan rates will contribute to the higher fractions of OH- that will have more favourable condi-tions to reach the electro-active sites, which leads to superior practical capacitance.
Considering the rest of samples decomposed at 600 and 700 ℃, as shown in Fig. 5d, 500 ℃ and 4 or 8 hours are the most favourable calcination tempera-ture and hydrothermal reaction time for the Mg-Co bimetallic system. According to the preceding XRD patterns, the samples decomposed at 500 ℃ have the lowest cystallinity, whilst displaying the highest capacitance. To a certain extent, the reason for above phenomenon could be explained by the crystallinity itself at first. Since the crystallinity of active materials increases with the rise of calcination temperature, the ion diffusion and electron mobility are markedly limited, which leading to the decrease of capacitance. Secondly, the different capacitance could be attributed to the morphology influence, especially the surface area and the distribution of porous structure, which is conducive to the transmission of ions and electrons. Brunauer-Emmett-Teller (BET) gas-sorption measure-ments of the electrodes calcined at 500 ℃ confirmed the conjecture as shown in Fig.S3(a~c). Based on the gas-sorption results, the BET specific surface area for 4 h-500, 8 h-500 and 12 h-500 is 24, 50 and 19 m2·g-1, respectively (Table S1). The result shows that the higher surface area the samples are, the larger the specific capacitance will be.
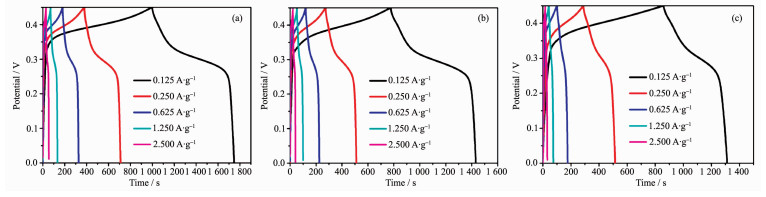
Galvanostatic charge-discharge (GCD) curves can further confirm the different electrochemical results. Fig. 6(a~c) presents the variation of capacitance as function of specific current density for 4 h-500, 8 h-500 and 12 h-500 in 0~0.45 V, respectively. The increase in charging time represents the higher capacitance, indicating 4 h-500 and 8 h-500 has similar capacitance data, which is in good agreement with the CV results and BET results. Specifically, the maximum capacitance for 4 h-500 and 8 h-500 is determined to be 208 and 182 F·g-1 at a current density of 0.125 A·g-1. The value is much higher than that of 12 h-500 (126 F·g-1), which is in agreement with the CV results. Interestingly, when the working voltage window increased up to 0.5 V, the asymmetrical curves appeared (long charging time and short discharging time, Fig.S4), especially for the samples decomposed at 600 and 700 ℃. This phenomenon suggests that the redox reaction is irreversible in high potential window and the samples decomposed at 600 and 700 ℃ may generate larger polarization and resistance effect, preventing the ions and electrons effectively diffusion and transmission which reduces the resulting capacitance.
图 6
图 6
GCD curves for the as-synthesized 4 h-500 (a), 8 h-500 (b) and 12 h-500 (c) using PVDF binder at various current densities
Figure 6.
GCD curves for the as-synthesized 4 h-500 (a), 8 h-500 (b) and 12 h-500 (c) using PVDF binder at various current densities
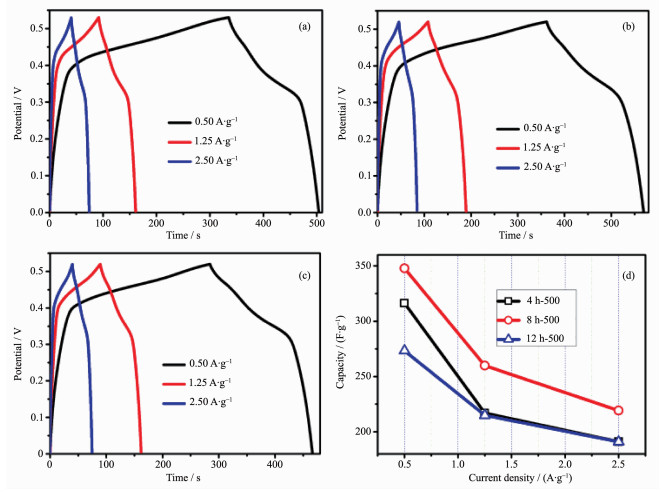
For comparison, GCD test was continuously performed to examine the electrochemical performance for the electrodes using PTFE binder as shown in Fig. 7(a~c). The performance for 8 h-500 is superior to that of the other electrodes and the capacitance is determined to be 348, 256 and 219 F·g-1 at 0.25, 0.5 and 1.25 A·g-1, respectively (Fig. 7d). This data is higher than that of the electrode using PVDF binder and can also be compared with that of recently reported magnesium cobaltites (Table S2)[15, 27-30].
图 7
图 7
GCD curves (a~c) and specific capacitance variations (d) of the as-synthesized samples using PTFE binder at different current densities
Figure 7.
GCD curves (a~c) and specific capacitance variations (d) of the as-synthesized samples using PTFE binder at different current densities
Except of possessing different capacitances, the detailed comparison between two binders can be determined directly by the energy delivery efficiency. The energy deliverable efficiency (η) information can be calculated as η=Td /Tc×100 (Td and Tc are the discharg-ing and charging time respectively) from charge-discharge curves shown in Fig. 7. The deliverable efficiency for 4 h-500, 8 h-500 and 12 h-500 electrodes using PTFE binder reaches up to 91.6%, 92.9% and 89.8% at 2.5 A·g-1, respectively, which are superior to that of the electrode using PVDF binder (88.7%, 88.6% and 82.4%). However, the η value decreases to 75%, 80% and 53% for 4 h-500, 8 h-500 and 12 h-500 electrodes respectively at a low current density of 0.125 A·g-1 when using PVDF binder.
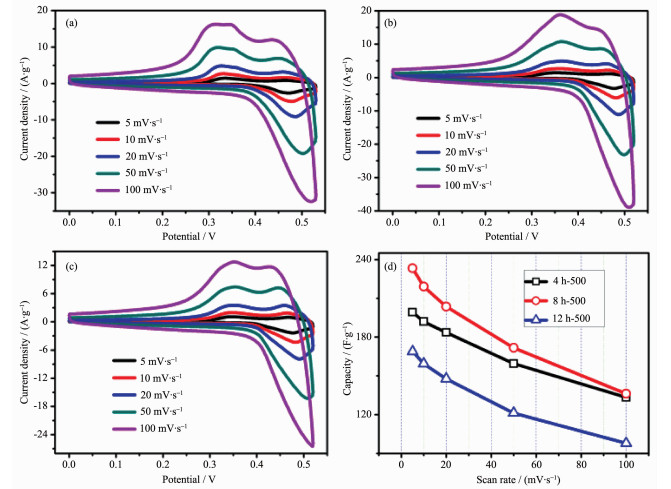
According to the observed electrochemical results, the optimum calcination temperature for MgCO2O4 has been substantiated to be 500 ℃, hence, CV measure-ments with series of scan rates were further investi-gated when the binder was PTFE (Fig. 8(a~c)). To be calculated (Fig. 8d), the specific capacitance of samples with PTFE is apparently higher than those of PVDF, which is in accordance with the GCD test. The result demonstrates that the binder PTFE may be more suitable for the MgCO2O4 system in testing process.
图 8
图 8
CV curves (a~c) and specific capacitance variations (d) of the as-synthesized samples using PTFE binder at different scan rates
Figure 8.
CV curves (a~c) and specific capacitance variations (d) of the as-synthesized samples using PTFE binder at different scan rates
Fig. 9a shows the Nyquist plots for the as-synthesized electrodes, which can further explain the better electrochemical results for the electrodes with PTFE binder. The electrochemical impedance data can be simulated with a fitting equivalent circuit (consisting of a bulk solution resistance Rs, a charge-transfer resistance Rct, a constant phase element CPE to account for the double layer capacitance, and a pseudo-capacitive element Cp from the redox process of MgCO2O4, Fig.S5). According to the point intersecting with the real impedance (Z′) axis at the high frequency region, the Rs value for 4 h-500, 8 h-500 and 12 h-500 with PTFE binder is determined to be 0.56, 0.61 and 0.58 Ω, respectively, whilst the corresponding Rct values is calculated (using ZsimpWin software) to be 0.64, 0.73 and 1.02 Ω separately. As to PVDF binder, the Rct values are determined to be 1.18, 0.96 and 0.94 Ω, respectively. It is noticed that the electrodes with PTFE binder exhibit smaller electrochemical reaction impedance, indicating that there have smaller charge transfer resistance. Moreover, the angle of the straight line in low frequency for the electrodes is greater than 45° suggesting faster ion diffusion rate in PTFE systems, which are consistent with the electrochemical results above.
图 9
图 9
(a) Electrochemical impedance spectra of as-prepared samples calcined at 500 ℃ using different binders;
(b) Cycling test of 8 h-500 electrode at a constant current of 1.5 A·g-1
Figure 9.
(a) Electrochemical impedance spectra of as-prepared samples calcined at 500 ℃ using different binders;
(b) Cycling test of 8 h-500 electrode at a constant current of 1.5 A·g-1
Even though 8 h-500 display the slightly bigger charge transfer resistance than 4 h-500, the moderate crystallinity and higher surface area may be beneficial to electron transmission and thus displaying superior electrochemical performance. Because it is important for a supercapacitor material to have good cycling performance, an endurance test for 8 h-500 was conducted by using GCD measurement at 1.5 A·g-1, as shown in Fig. 9b. After a quick decrease in 1st charge-discharge cycle, the capacitance decreases slowly and the retention is 93.7% for MgCO2O4 electrode after 1 000 continuous charge-discharge cycles. The quick decrease might be due to an unstably electrochemical activation process of electrode. The result suggests good electrode stability is observed for the as-synthesized MgCO2O4 sample with moderate crystallinity and high surface area, which is a crucial concern for high-power supercapacitor applications.
3.
Conclusions
In conclusion, a ternary compound MgCO2O4 has been synthesized by template decomposition of bimetallic coordination polymer precursors and used as supercapacitors electrode. In terms of using PTFE as the binder, the MgCO2O4 electrode with high surface area and moderate crystallinity shows superior electro-chemical performance and better symmetric charging-discharging curves. The corresponding MgCO2O4 elec-trode achieves a largest specific capacitance of 348 F·g-1 at 0.25 A·g-1 with low charge transfer resistance of 0.73 Ω and maintains a retention of 93.7% after 1 000 continuous charge-discharge cycles. Except of PTFE, 8 h and 500 ℃ are regarded as the appropriate hydrothermal reacted time and calcination tempera-ture, respectively. The results demonstrated that the introduction of Mg2+ into Co3O4 lattice can improve the cycling stability and show a promise for MgCO2O4 to be developed as a potential supercapacitive electrode. Moreover, the low-cost coordination-polymer template strategy is found to be a versatile method to prepare bimetallic oxides.
Figure 5
CV curves for the as-synthesized 4 h-500 (a), 8 h-500 (b) and 12 h-500 (c) samples using PVDF binder at different scan rates; (d) CV curves for the rest of electrodes at a scan rate of 50 mV·s-1
Figure 9
(a) Electrochemical impedance spectra of as-prepared samples calcined at 500 ℃ using different binders;
(b) Cycling test of 8 h-500 electrode at a constant current of 1.5 A·g-1


 下载:
下载:


 下载:
下载:


 下载:
下载:

