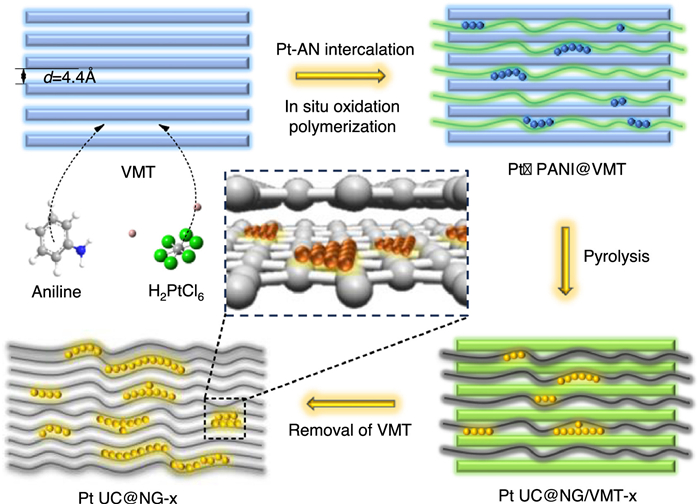
Figure 1.
Schematic representation of the synthesis of Pt UC@NG-x.

Ultrafine Pt nanoclusters with rich pyri-N for high performance oxygen reduction reaction
Shaojie Lu , Dongsheng Ma , Zhenwen Li , Yiping Hu , Mingze Hao , Ruiming Liu , Lei Xiong , Qin Yue


Proton exchange membrane fuel cells (PEMFCs) have been recognized as a promising technology for the hydrogen energy conversion to electricity without CO2 emission. However, it remains great challenges for the sluggish kinetics in the cathodic oxygen reduction reaction (ORR) [1-3]. Pt-based materials are currently the most effective catalysts for ORR, but the high cost and limited availability hinders the widespread commercialization of PEMFCs [4-7]. Therefore, it is the major mission to maintain or even improve the catalytic activity while reducing the Pt usage in respect to the industrial application of the PEMFCs [8-11]. Till now, several strategies are proposed to improve the Pt utilization and mass activity (MA) towards ORR, including the alloying with other metal (Pd, Ni, Co, Fe, etc.), constructing Pt-based core-shell structure (Pd@Pt, Ru@Pt, etc.) and designing single atoms catalysts (SACs) and so on [12-18]. However, all these strategies display distinct limitations. Specifically, the dealloying of the transition metal for the Pt-based alloys leads to the irreversible decay of activity as well as the contamination of the membrane electrode assembly [19]. Moreover, the scalability or large-scale production like the Pt-based core-shell catalysts and SACs suffers great challenges [16,17,20]. These drawbacks significantly restrain their application in PEMFCs.
It is well-recognized that only the surface-layer Pt atoms involve in the catalytic reaction, while the unexposed Pt atoms in the interior have a very low utilization rate [21,22]. Therefore, decreasing the particle size of Pt are proposed as a strategy to increase the Pt utilization and improve its intrinsic activity [23-26]. Small-size Pt nanoparticles (NPs) always display higher low-coordinated atoms and optimized orbital hybridization, which facilitates the catalytic reaction [27-32]. However, the easy migration, aggregation and even detachment of Pt NPs on the carbon supports under severe electrochemical environments (high working potential, low pH) will result in the significant degradation of the catalytic activity and durability [33-36]. Hence, establishing a strong interaction between small Pt NPs and carbon supports is crucial for obtaining the highly active and highly stable ultrafine low-Pt nanocatalysts.
Herein, the composite catalyst (Pt UC@NG-x, x = 700, 800 and 900 representing calcination temperature) consisting of ultrafine Pt clusters over N-doped graphene carbon (NG) carrier were constructed via the space-confined growth within the angstrom-level (Å) interlayer cavities of natural vermiculite (VMT) to achieve robust ORR. The characterizations like XRD, XPS, Raman, HRTEM and EDS mapping verify the strong metal-support interaction (SMSI) between Pt clusters and the NG carrier, while Pt UC@NG-800 shows much higher content of pyridine N (pyri-N). The Pt UC@NG-800 catalyst exhibits exceptional ORR performance (E1/2 of 0.99 in alkaline and 0.93 V in acidic) and long-term stability over 120 h in both media. Compared with the commercial Pt/C (20%), Pt UC@NG-800 has much higher intrinsic catalytic activity with the enhancement of the MA and specific activity (SA) by several orders of magnitude. The outstanding ORR activity and stability of the Pt UC@NG-800 with average size of 2.2 nm can be ascribed to the highly exposed and stable Pt active sites as well as rich pyri-N, which is conducive for the O2 adsorption, transfer and conversion.
The synthesizing procedure of Pt UC@NG-x is illustrated in Fig. 1. The interlayer of vermiculite (VMT) was firstly intercalated by the aniline (AN) monomer accompanied with the electrostatic adsorption of metal salt precursor (H2PtCl6), forming the initial coordination complex. Subsequently, the in-situ oxidation polymerization of AN to polyaniline (PANI) complex was started (detailed mechanism provided in Figs. S1-S3 in Supporting information). Then the composite was dehydrated and pyrolyzed under H2/Ar atmosphere at different temperatures (700, 800 or 900 ℃) to obtain the composite of Pt UC@NG/VMT-x (x = 700, 800, 900). After removing the template of VMT, Pt UC@NG-x was obtained. The actual Pt contents are determined to be 4.4, 4.6 and 4.3 wt% for Pt UC@NG-700, Pt UC@NG-800 and Pt UC@NG-900 via inductively coupled plasma-atomic emission spectrometry (ICP-AES), respectively (Table S1 in Supporting information). AN serve not only as a dual carbon and nitrogen source but also as a multifunctional agent including reductant, structure-directing agent, and stabilizer to confine the Pt precursors within the VMT interlayers via the coordination between its -NH2 groups and Pt ion (Fig. S4 in Supporting information). This approach leverages the spatial confinement of VMT with Å-level interspacial widths to induce the 2D growth of Pt clusters and NG supports.
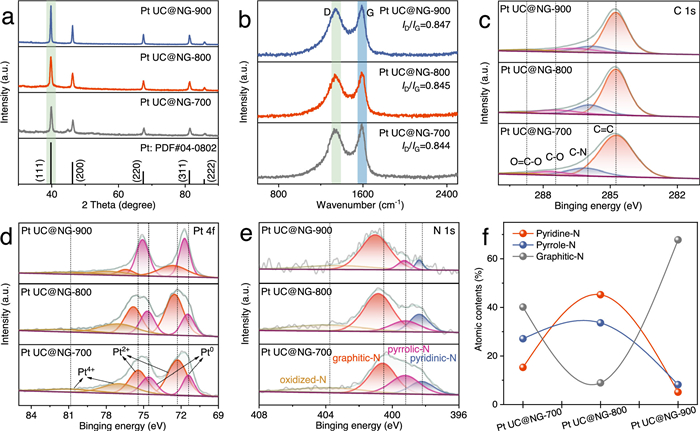
The powder X-ray diffraction (XRD) patterns (Fig. 2a) exhibit that all the Pt UC@NG-x samples maintain the typical phase structure of face-centered cubic (fcc) Pt [37,38]. In the Raman spectroscopy (Fig. 2b), mainly two bands are detected that are D band at about 1340 cm-1 and the G band at around 1580 cm-1 ascribed to the graphite structure. The similar values of ID/IG ratio indicate that the pyrolysis temperature has negligible effect on the graphitization degree. The X-ray photoelectron spectroscopy (XPS) analysis confirms the presence of Pt, C, and N elements in all catalysts (Fig. S5 in Supporting information). The high-resolution XPS of C 1s (Fig. 2c) can be classified into four primary bonding types that are C=C (284.6 eV), C—N (286 eV), C—O (287.6 eV), and O=CO (288.7 eV) for the three samples. After the fitting of Pt 4f spectra in Fig. 2d, the coexistence of Pt0, Pt2+ and Pt4+ are observed on the three Pt UC@NG-x samples. The relative content of these Pt species is calculated based on the relative peak area (Table S2 in Supporting information). As a result, Pt UC@NG-800 displays slightly higher proportion of high-valence Pt (Pt2+ + Pt4+, 76%) than that of Pt UC@NG-700 (69.9%) and Pt UC@NG-900 (74%), implying a stronger synergistic effect between Pt and N. As shown in Fig. 2e, the N 1s spectra of the three samples can be deconvoluted into four peaks corresponding to pyridine N (pyri-N, 398.2 eV), pyrrole N (pyrr-N, 399.2 eV), graphitic N (grap-N, 400.5 eV), and oxidized nitrogen (oxid-N, 403.8 eV). From the relative content of N species (Table S2), Pt UC@NG-800 shows much higher content of pyri-N (45.2%) than that of Pt UC@NG-700 (15.3%) and Pt UC@NG-900 (5.1%) (Fig. 2f). It was verified previously that pyri-N could promote the adsorption and transfer of O2, thus enhancing the intrinsic activity of ORR [39-41]. Therefore, Pt UC@NG-800 is predicted to have the best ORR activity.
Transmission electron microscopy (TEM) images of Pt UC@NG/VMT-800 show the multilayered structure of VMT (Figs. 3a and b). Moreover, the layer spacing is measured to be about ∼4.4 Å (Fig. 3b) consistent with the small-angle XRD results of VMT (Fig. S6 in Supporting information), which provides a unique Å-level confined 2D space for the growth of Pt clusters. The selected area electron diffraction (SAED) (Fig. 3c) shows polycrystalline characteristic diffraction rings of (111), (200), and (220) crystal planes corresponding to cubic Pt, verifying the successful embedding of Pt clusters within the VMT interlayer. Moreover, the electron diffraction pattern also displays clear hexagonal spots, indicating the complete crystal structure of VMT after pyrolysis, agreeing well with the XRD results (Fig. S7 in Supporting information).
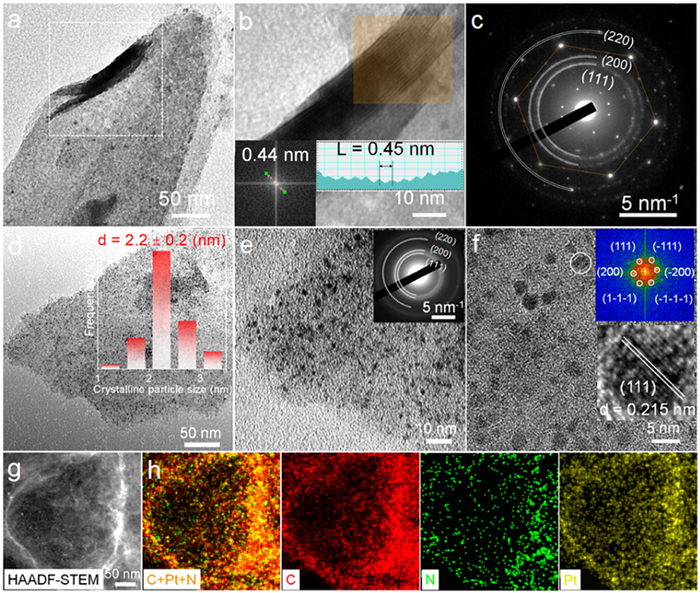
After removing the VMT template, uniformly distribution of ultrafine Pt clusters with an average particle size of about 2.2 ± 0.2 nm are observed on the carbon carrier for Pt UC@NG-800 (Fig. 3d). This particle size is nearly identical to those of Pt UC@NG-700 (∼2.2 ± 0.5 nm, Fig. S8 in Supporting information) and Pt UC@NG-900 (∼2.2 ± 0.5 nm, Fig. S9 in Supporting information), demonstrating excellent resistance to thermal sintering, which is attributed to the strong confinement effect provided by the 2D nanochannels of the VMT. The SAED shows the identical diffraction rings ascribed to the fcc Pt with Pt UC@NG/VMT-800 apart from the absence of the hexagonal spots of VMT (Fig. 3e inset), suggesting no residue of VMT. The high-resolution transmission electron microscopy (HR-TEM) images (Fig. 3f) reveals that the ultrafine Pt clusters exhibit a planar, two-dimensional (2D) structure. An inter-lattice spacing of 0.215 nm is found ascribed to Pt (111) plane (inset of Fig. 3f), which is slightly smaller than the standard Pt lattice spacing of 0.23 nm owing to the compression in the confined space during the growth [42]. The high-angle annular dark-field scanning TEM (HAADF-STEM) accompanied with the energy dispersive spectroscopy (EDS) (Fig. S10 in Supporting information) further verifies the uniform distribution of Pt and N elements across the NG supports (Fig. 3g). As a comparison, the TEM image of the obtained bare NG-800 employing the VMT template without the addition of Pt shows the transparent and ultrathin nanosheet with some areas exhibiting wrinkles due to the interleaving or curling of the graphene lamellae (Figs. S11a-c in Supporting information). Moreover, the nitrogen is also uniformly distributed over the carbon carriers via EDS elemental mapping (Figs. S11d-g and S12 in Supporting information). Above results illustrate that VMT is a superior template to induce the growth of Pt clusters over ultrathin NG carriers.
The electrocatalytic oxygen reduction reaction (ORR) of the Pt UC@NG-x catalyst was evaluated using a standard three-electrode system. The calibration of the reference electrode (RE) to the reversible hydrogen electrode (RHE) potential is shown in Fig. S13 (Supporting information). As displayed in Fig. 4a, Pt UC@NG-800 shows the best ORR activity with apparently higher half-wave potentials (E1/2) of 0.99 V in O2-saturated 0.1 mol/L KOH than that of Pt UC@NG-700 (0.91 V) and Pt UC@NG-900 (0.94 V), which outperform the commercial Pt/C (20%) (0.88 V) with 110 mV improvement ascribed to the highly active and exposed Pt sites. Moreover, Pt UC@NG-800 reaches a limiting current density (JL) of ∼6.1 mA/cm2 at 0.4 V similar with the Pt/C (20%), which is much higher than that of Pt UC@NG-700 (∼4.49 mA/cm2) and Pt UC@NG-900 (∼5.55 mA/cm2). These results illustrate that Pt UC@NG-800 is endowed with the best ability for O2 adsorption and transfer [43-45], which might be owing to the much higher content of pyri-N in the NG carrier.
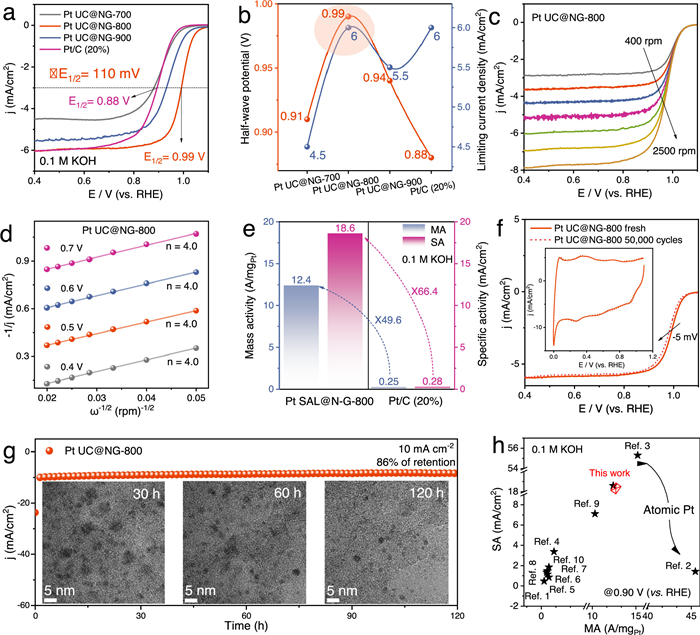
The ORR activity was further studied in 0.1 mol/L HClO4 for Pt UC@NG-800 to make the comparison with commercial Pt/C (20%) (Fig. S14 in Supporting information). Pt UC@NG-800 shows much higher E1/2 value (0.93 V) than that of Pt/C (20%) (0.85 V) with 80 mV improvement (Fig. S14a). As a result, Pt UC@NG-800 exhibits larger onset potentials (Eonset) of 1.06 V and 1.04 V (vs. RHE), improved kinetic current densities (JK) (59.2 and 12.7 mA/cm2@0.9 V) and smaller Tafel slopes (52.7 and 65.7 mV/dec) than the commercial Pt/C (20%) in alkaline and acidic media, respectively, indicating the faster ORR kinetics (Figs. S14b and S15 in Supporting information). The electron transfer number (n) is determined to be ∼4.0 for Pt UC@NG-800 and Pt/C (20%) via Koutecky-Levich (K-L) analysis in both alkaline and acidic media, implying a four-electron (4e-) pathway for the ORR (Figs. 4c and d, Figs. S14c and d). The mass activity (MA) and specific activity (SA) are important parameters to compare the intrinsic activity of Pt-based catalysts for ORR. As shown in Fig. 4e and Fig. S14e, the MA (at 0.9 V) of Pt UC@NG-800 is calculated to be 12.4 A/mgPt and 9.7 A/mgPt, which is 49.6 times and 51.1 times higher than that of Pt/C (20%) (0.25 and 0.19 A/mgPt) in alkaline and acidic media, respectively. Meanwhile, the SA of Pt UC@NG-800 is 18.6 mA/cm2 in alkaline media and 11.5 mA/cm2 in acidic media, representing 66.4- and 54.8-times improvement compared to Pt/C (20%) (0.28 and 0.21 mA/cm2), respectively. These results confirm that Pt UC@NG-800 has much high intrinsic activity owing to its significantly enhanced Pt atom exposure and utilization by constructing ultrafine Pt clusters in a pyri-N rich carbon matrix.
The ORR electrochemical durability tests were conducted in O2-saturated 0.1 mol/L KOH and 0.1 mol/L HClO4 solutions, where the potential was swept between 0.6 V and 1.0 V at a scanning rate of 100 mV/s. After 50,000 potential cycles, the E1/2 decay for Pt UC@NG-800 is minimal (∆E1/2 = 5 mV in alkaline media and ∆E1/2 = 10 mV in acidic media) (Fig. 4f and Fig. S14f). Moreover, the MA retention is 91% and 89% of the initial values in 0.1 mol/L KOH and HClO4 superior to the Pt/C (only 40% and 32%), respectively, demonstrating its exceptional durability (Table S3 in Supporting information). The chronoamperometric responses (I-t) reveals that small (86% retentions) or even little current fading is observed in alkaline and acid conditions after 120 h of long-term test at 10 mA/cm2 (Fig. 4g and Fig. S14g), respectively, further demonstrating its superior durability. The TEM images and EDS elemental mappings of Pt UC@NG-800 after durable test reveal no apparent Pt dissolution, N loss, and carbon corrosion, verifying the stable structure of Pt cluster over the NG carrier (Figs. S16 and S17, Table S4 in Supporting information). Therefore, the strong interaction with the 2D graphene carbon layer can promote the stabilization of Pt clusters and inhibit the corrosion under severe electrochemical environments. The comparative performance results (Fig. 4h and Fig. S14h) show that Pt UC@NG-800 surpasses most previously reported Pt-based catalysts (Tables S5 and S6 in Supporting information) for ORR.
Thereafter, the catalyst's resistance to poisoning by CO or CH3OH was also evaluated in O2-saturated electrolyte. When high concentrations of CH3OH (5.0 or 10.0 mol/L) are injected, Pt UG@NG-800 shows a stable current response (Fig. S18 in Supporting information), primarily due to the barrier effect of the NG support against CH3OH (Fig. S19 in Supporting information). In addition, the oxidation peak potential in the CO stripping curve of Pt UG@NG-800 shifts to a lower potential compared to that of Pt/C (20%), indicating optimized electronic properties to facilitate the removal of CO adsorption intermediates (Fig. S20 in Supporting information). Above electrochemical tests illustrate that Pt UG@NG-800 displays superior ORR performance in both alkaline and acidic environments, with exceptional activity, durability, and resistance to poisoning. These superiorities are attributed to the synergistic effects of Pyri-N-rich carbon and ultrafine Pt clusters, which improves the exposure of active sites, stabilization as well as O2 adsorption and transfer.
In summary, the ultrafine Pt cluster catalyst (Pt UC@NG-x, x = 700, 800 and 900) encapsulated with N doped graphene was successfully synthesized employing the unique Å-level confined layer space of natural VMT. Structural characterization reveals the SMSI between N-doped graphene and Pt clusters, forming the active sites for ORR. Among them, Pt UC@NG-800 displays the highest proportion of pyri-N, which is conducive for the O2 adsorption and transfer. As a result, Pt UC@NG-800 exhibits remarkable 4e- ORR activity with E1/2 of 0.99 V and 0.93 V in alkaline and acidic media, surpassing Pt/C (20%) by 110 and 80 mV, respectively. Meanwhile, Pt UC@NG-800 also shows superior MA of 12.4 (alkaline), 9.7 A/mgPt (acid) and SA of 18.6 (alkaline) and 11.5 mA/cm2 (acid), which are much higher than the commercial Pt/C (20%) by several orders of magnitude. After long-term test of 120 h in both alkaline and acidic environments, Pt UC@NG-800 stile maintains the stable structure of Pt cluster over the NG carrier, without apparent Pt dissolution and carbon corrosion. These findings offer valuable insights into the design of ultrafine clusters employing space confinement effect and pave the way for future advancements in high-performance electrocatalysts.
Shaojie Lu: Writing – original draft, Methodology, Data curation. Dongsheng Ma: Supervision. Zhenwen Li: Supervision. Yiping Hu: Writing – review & editing, Supervision, Funding acquisition. Mingze Hao: Supervision. Ruiming Liu: Supervision. Lei Xiong: Writing – review & editing, Supervision. Qin Yue: Writing – review & editing, Supervision, Methodology, Funding acquisition, Conceptualization.
The authors declare that they have no known competing financial interests or personal relationships that could have appeared to influence the work reported in this paper.
This work was supported by National Natural Science Foundation of China (Nos. 22475031, 22409025), National Youth Top-notch Talent Support Program of China, and Jiangsu Province Cultivation base for State Key Laboratory of Photovoltaic Science and Technology (No. SKLPST 202103).
Supplementary material associated with this article can be found, in the online version, at doi:
J.W. Ager, A.A. Lapkin, Science 360 (2018) 707–708. doi: 10.1126/science.aat7918
Y. Sun, S. Polani, F. Luo, et al., Nat. Commun. 12 (2021) 5984. doi: 10.1038/s41467-021-25911-x
C. Zhao, L. Tan, J. Xu, et al., Adv. Fiber Mater. 7 (2025) 554–562. doi: 10.1007/s42765-024-00503-8
H. Cheng, Z. Cao, Z. Chen, et al., Nano Lett. 19 (2019) 4997–5002. doi: 10.1021/acs.nanolett.9b01221
Z. Zhao, Z. Liu, A. Zhang, et al., Nat. Nanotechnol. 17 (2022) 968–975. doi: 10.1038/s41565-022-01170-9
S. Lu, Y. Hu, F. Xia, et al., Small 20 (2024) 2305296. doi: 10.1002/smll.202305296
S. Lu, S. Niu, J. Yi, et al., Inorg. Chem. 64 (2025) 9735–9743. doi: 10.1021/acs.inorgchem.5c00970
Z.W. Seh, J. Kibsgaard, C.F. Dickens, et al., Science 355 (2017) eaad4998. doi: 10.1126/science.aad4998
J. Huang, L. Sementa, Z. Liu, et al., Nat. Catal. 5 (2022) 513–523. doi: 10.1038/s41929-022-00797-0
J. Fan, M. Chen, Z. Zhao, et al., Nat. Energy 6 (2021) 475–486. doi: 10.1038/s41560-021-00824-7
L. Chong, J. Wen, J. Kubal, et al., Science 362 (2018) 1276–1281. doi: 10.1126/science.aau0630
T. Moriyama, S. Muratsugu, M. Sato, et al., J. Am. Chem. Soc. 147 (2025) 1262–1270. doi: 10.1021/jacs.4c15181
P. Weber, D.J. Weber, C. Dosche, et al., ACS Catal. 12 (2022) 6394–6408. doi: 10.1021/acscatal.2c00514
X. Zhao, K. Sasaki, Acc. Chem. Res. 55 (2022) 1226–1236. doi: 10.1021/acs.accounts.2c00057
W. Zhang, F. Li, Y. Li, et al., Nat. Commun. 15 (2024) 9762. doi: 10.1038/s41467-024-54104-5
B. Ni, P. Shen, G. Zhang, et al., J. Am. Chem. Soc. 146 (2024) 11181–11192. doi: 10.1021/jacs.3c14186
J. Zhang, M. Wang, T. Wan, et al., Adv. Mater. 34 (2022) 2206960. doi: 10.1002/adma.202206960
V.R. Stamenkovic, B.S. Mun, M. Arenz, et al., Nat. Mater. 6 (2007) 241–247. doi: 10.1038/nmat1840
C. Cui, L. Gan, M. Heggen, et al., Nat. Mater. 12 (2013) 765–771. doi: 10.1038/nmat3668
W. Zhou, B. Li, X. Liu, et al., Nat. Commun. 15 (2024) 6650. doi: 10.1038/s41467-024-51157-4
H. Jin, Z. Xu, Z.Y. Hu, et al., Nat. Commun. 14 (2023) 1518. doi: 10.1038/s41467-023-37268-4
M. Escudero-Escribano, P. Malacrida, M.H. Hansen, et al., Science 352 (2016) 73–76. doi: 10.1126/science.aad8892
T. Chen, C. Qiu, X. Zhang, et al., J. Am. Chem. Soc. 146 (2024) 1174–1184. doi: 10.1021/jacs.3c12649
F. Kong, Y. Huang, X. Yu, et al., J. Am. Chem. Soc. 146 (2024) 30078–30090. doi: 10.1021/jacs.4c07185
Y.H. Li, S.N. Zhao, S.Q. Zang, Exploration 3 (2023) 20220005. doi: 10.1002/EXP.20220005
Y. Zeng, J. Liang, C. Li, et al., J. Am. Chem. Soc. 145 (2023) 17643–17655. doi: 10.1021/jacs.3c03345
Y. He, L. Liu, C. Zhu, et al., Nat. Catal. 5 (2022) 212–221. doi: 10.1038/s41929-022-00753-y
Q. Guan, C. Zhu, Y. Lin, et al., Nat. Catal. 4 (2021) 840–849. doi: 10.1038/s41929-021-00679-x
L. Lin, J. Liu, X. Liu, et al., Nat. Commun. 12 (2021) 6978. doi: 10.1038/s41467-021-27116-8
H. Wang, X.K. Gu, X. Zheng, et al., Sci. Adv. 5 (2019) eaat6413. doi: 10.1126/sciadv.aat6413
T. Wu, M.Y. Han, Z.J. Xu, ACS Nano 16 (2022) 8531–8539. doi: 10.1021/acsnano.2c04603
K. Liu, X. Zhao, G. Ren, et al., Nat. Commun. 11 (2020) 1263. doi: 10.1038/s41467-020-14984-9
S. Zaman, Y.Q. Su, C.L. Dong, et al., Angew. Chem. Int. Ed. 61 (2022) e202115835. doi: 10.1002/anie.202115835
L. Liang, H. Jin, H. Zhou, et al., Nano Energy 88 (2021) 106221. doi: 10.1016/j.nanoen.2021.106221
Y. Ma, J. Peng, J. Tian, et al., Sci. Adv. 10 (2024) eado4935. doi: 10.1126/sciadv.ado4935
M. Gao, Z. Yang, H. Zhang, et al., ACS Cent. Sci. 8 (2022) 1633–1645. doi: 10.1021/acscentsci.2c01290
K. Jiang, D. Zhao, S. Guo, et al., Sci. Adv. 3 (2017) e1601705. doi: 10.1126/sciadv.1601705
Y. Kang, O. Cretu, J. Kikkawa, et al., Nat. Commun. 14 (2023) 4182. doi: 10.1038/s41467-023-39157-2
D. Guo, R. Shibuya, C. Akiba, et al., Science 351 (2016) 361–365. doi: 10.1126/science.aad0832
K. Takeyasu, M. Furukawa, Y. Shimoyama, et al., Angew. Chem. Int. Ed. 60 (2021) 5121–5124. doi: 10.1002/anie.202014323
J. Cheng, C. Lyu, H. Li, et al., Appl. Catal. B: Environ. 327 (2023) 122470. doi: 10.1016/j.apcatb.2023.122470
Z. Huang, T. Cheng, A.H. Shah, et al., Nat. Catal. 7 (2024) 678–688. doi: 10.1038/s41929-024-01156-x
K. Wan, A.D. Tan, Z.P. Yu, et al., Appl. Catal. B: Environ. 209 (2017) 447–454. doi: 10.1016/j.apcatb.2017.03.014
D. Moitra, A. Ganesan, F. Wang, et al., J. Am. Chem. Soc. 147 (2025) 3421–3427. doi: 10.1021/jacs.4c13875
G. Zhong, S. Xu, L. Liu, et al., ChemElectroChem 7 (2020) 1107–1114. doi: 10.1002/celc.201902085

Figure 2 Electronic structure analysis of catalysts. (a) Powder XRD patterns, (b) Raman spectra and (c) C 1s, (d) Pt 4f, (e) N 1s XPS profiles of Pt UC@NG-700, Pt UC@NG-800, and Pt UC@NG-900. (f) The atomic contents of pyridinic-N, graphitic-N, and pyrrolic-N for Pt UC@NG-700, Pt UC@NG-800, and Pt UC@NG-900 derived from the XPS results.

Figure 3 Morphology and composition characterization of Pt UC@NG/VMT-800 (pre-template removal) and Pt UC@NG-800 (post-template removal) catalysts. (a) Low-, (b) high magnification TEM images, and (c) SAED pattern of Pt UC@NG/VMT-800. (d) Low (inset: the corresponding histogram of the size distribution from TEM results), (e) high magnification TEM images (inset: the corresponding SAED pattern), and (f) HR-TEM image of Pt UC@NG-800 (inset: the corresponding FFT pattern). (g) The HAADF-STEM image and EDS elemental mapping of C (red), Pt (yellow), and N (green) for Pt UC@NG-800.

Figure 4 Electrocatalytic ORR performances of prepared electrocatalysts. (a) ORR polarization curves of electrocatalysts (RDE rotation rate ω = 1600 rpm). (b) Comparison of the E1/2 and JL of Pt UC@NG-700, Pt UC@NG-800, Pt UC@NG-900, and Pt/C (20%) samples in oxygen-saturated 0.1 mol/L KOH solution. (c) Polarization curves of Pt UC@NG-800 at different rotating speeds. (d) K-L plots for Pt UC@NG-800 catalysts at varying potentials, including the calculated electron transfer number. (e) MA and SA values in 0.1 mol/L KOH (at 0.90 V) for Pt UC@NG-800 and Pt/C (20%) samples. (f) LSV curves recorded before and after 50,000 accelerated degradation tests (ADTs) for Pt UC@NG-800 (inset: corresponding CV curves before and after ADTs). (g) Chronoamperometric responses test of Pt UC@NG-800 at 10 mA/cm2; inset shows the HR-TEM images of Pt UC@NG-800 catalyst. Scale bar, 5 nm. (h) Comparison MA and SA of Pt UC@NG-800 and recently reported Pt-based ORR electrocatalysts in alkaline media (detailed references 1–10 is summarized in Table S5).

 扫一扫看文章


扫一扫关注我们
 DownLoad:

 下载:
 下载: