 图Scheme 1
Typical photoresponses of Ag-graphene-TiO2 fiber under visible light irradiation
Scheme1.
Typical photoresponses of Ag-graphene-TiO2 fiber under visible light irradiation
图Scheme 1
Typical photoresponses of Ag-graphene-TiO2 fiber under visible light irradiation
Scheme1.
Typical photoresponses of Ag-graphene-TiO2 fiber under visible light irradiation
Citation:
WANG Cui-E, WANG Ning, LIU Xin-Hua. Electrospun Fibrous Ag-Graphene-TiO2 with Enhanced Photocurrent Response under Visible-Light Illumination[J]. Chinese Journal of Inorganic Chemistry,
2017, 33(9): 1618-1624.
doi:
10.11862/CJIC.2017.186

微/纳复合型可见光光电材料Ag-石墨烯-TiO2的制备及应用
English
Electrospun Fibrous Ag-Graphene-TiO2 with Enhanced Photocurrent Response under Visible-Light Illumination
Abstract:
A highly-uniform nanofiber of Ag-graphene-TiO2 was successfully fabricated by the electrospinning technique, which exhibited significantly increased visible light absorption (λ > 420 nm) and improved photocurrent response. The Ag nanoparticles (AgNPs) and graphenes located in TiO2 fibers induced an increase in the visible-light photocurrent response. The photocurrent density of Ag-graphene-TiO2 fibers is 4-fold higher than the pristine TiO2 fibers under visible light. The increased photocurrent response in visible light region is resulted from the strong interaction between TiO2 fibers and graphene sheets, as well as the localized surface plasmon resonance of AgNPs.
-
Key words:
- electrospinning
- / TiO2
- / Ag
- / graphene
- / photocurrent
-
0 Introduction
TiO2 has been attracted much attention for their potential application in the field of dye-sensitized solar cells[1], photocatalysts[2], electrocatalysts[3], self-cleaning materials[4], antibacterial coatings[5], and gas sensors[6]. Compared with conventional TiO2 particles, TiO2 fibers have greater surface-to-volume ratio[7], and their porous structure allow for higher surface active sites for effective catalysis. However, the photo activity efficiency of TiO2 fiber using natural sunlight is currently very limited due to wide band gap energy (3.2 eV for anatase)[8], as well as the low quantum yield caused by fast recombination of photo-generated electron-hole pairs. Therefore, to inhibit the recom-bination of photo-generated electron-hole pairs and to make TiO2 responsive to visible light region are two critical ways to improve the photocurrent density of TiO2 under solar irradiation.
Recently, much effort was made by doping with metal or nonmetal elements, such as Au[9], Ag[10], Fe[11], N[12], S[13], I[14], as well as sensitization with organic dyes[15], conducting polymer[16] and semiconductor[17]. Among these attempts, noble metallic nanoparticles have been intensively studied because they can efficiently promote the photo response primarily by extending the optical absorption to the visible light region and increasing the number of photoexcited electrons due to the enhanced near-field amplitude. In these noble metallic nanoparticles, silver nanoparticle is a popular choice, which can result in strong and broad absorption band in the visible light region[18]. Meanwhile, another approach to optimize the photo-current of TiO2 is to retard surface and bulk recom-bination of photogenerated electron-hole pairs in TiO2 during a photocatalytic process. A narrow band gap semiconductor, electron donors/acceptors and hole scavengers have been proven to be available way for inhibiting electron-hole pair recombination[19]. Graphene is a good candidate for scavenging of photogenerated electrons mainly because of its superior charge transport properties, large specific surface area and two-dimensional planar conjugation structure[20].
Motivated by the above concerns, in this work, we describe an efficient way to synthesis of Ag-graphene-TiO2 fiber with high photocurrent density by electrospinning method. The adopted electrospinning approach ensures not only the successful incorporation of AgNPs and graphenes into TiO2 fibers substrate but also the high dispersion of AgNPs and graphenes into TiO2 fibers without aggregation. By simply tuning the precursor concentration or reaction temperature, we can optimize the AgNP or graphene density in fibers. Moreover, the fibrous Ag-graphene-TiO2 allows light to pass through to illuminate.
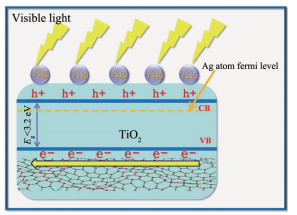
As illustrated in Scheme 1, under simulated solar light irradiation, the electrons in the valence band (VB) of TiO2 are excited to the corresponding conduction band (CB). Then the electrons in the CB of TiO2 migrate into the metal Ag (electron transfer: TiO2 to Ag) through the Schottky barrier because the CB of the TiO2 is higher than that of the loaded metal Ag. This process of electron transfer is faster than the electron-hole recombination between the VB and CB of the TiO2. Thus, the electrons in the CB of TiO2 can be stored in the Ag component. Furthermore, tightly bound graphene to TiO2 accelerates electron transfer from the excited MB to TiO2 via graphene nanosheets, retard the combination of photogenerated electron-hole pairs and thus accelerating visible-light-driven photocurrent.
图Scheme 1
Typical photoresponses of Ag-graphene-TiO2 fiber under visible light irradiation
Scheme1.
Typical photoresponses of Ag-graphene-TiO2 fiber under visible light irradiation
1 Experimental
1.1 Synthesis of Ag-graphene-TiO2 fibers
In a typical procedure, 0.6 mL tetrabutyltitanate (TBT) and 4 g polyvinylpyrrolidone (PVP) were dissolved into a mixture solution of 6 mL ethanol and 0.6 mL acetic acid. After the mixture was stirring for 1 h, 30 mg silver nitrate and different amount of graphene powder were mixed together. The solutions were then homogeneously ultrasonicated for 60 min, and the reducing agent (containing 0.2 mol·L-1 NaBH4) was added dropwise to the above solution still with continuous stirring. The electrospinning was carried out at 16 kV through a DW-P503-1AC high-voltage supplier, and the feed rate was set at 0.4 mL·h-1 by using a JZB-1800D microinfusion pump. The nanofibers were collected on electrically grounded aluminum foil, and the distance between the aluminum foil and the tip of needle was 15 cm. Finally, the as-spun nanofibers were then calcined at 500 ℃ for 2 h in air before cooling to room temperature. Pure TiO2 nanofibers were similarly prepared but without the addition of graphene and AgNO3 solution and the reducing agent, and the Ag-TiO2 fibers were prepared without graphene.
1.2 Preparation of photoelectrodes
In the experiment, glass carbon electrodes (GCEs) with 3 mm diameter were carefully polished to obtain a mirror-like surface. Then, the Ag-graphene-TiO2 fibers dispersion was dripped onto the GCE.
1.3 Photoelectrochemical measurements
The photoelectrochemical performances of the Ag-TiO2, pristine TiO2, and Ag-graphene-TiO2 fibers under visible light irradiation were recorded on an electrochemical workstation (Model CHI660A, CH Instruments Co.). The photoelectron chemical cell was a three-electrode system: an Ag-TiO2, pristine TiO2, or Ag-graphene-TiO2 photoelectrode located in the middle of the cell as a working electrode, Ag/AgCl electrode as reference, and a platinum wire electrode as a counter electrode. The photoelectrode was exposed to visible light to measure closed-circuit photocurrent. The light source was a 160-W high-pressure mercury lamp with a UV cutoff filter (>420 nm). All measure-ments were carried out at room temperature. The electrolyte was 0.5 mol·L-1 Na2SO4 aqueous solution. The working electrode was activated in the electrolyte for 2 h before measurement. The samples were irradiated with lamp located 10 cm away and typically irradiated at intervals of 25 s. Experiments were obtained at different fixed applied potentials, from -0.3 V to +0.5 V.
2 Result and discussion
2.1 Structure and morphology of Ag-graphene-TiO2 nanocomposite
The formation of Ag-graphene-TiO2 nanocomp-osite was confirmed by scanning electron microscopy (SEM) analysis, and its representative images are presented in Fig. 1. Fig. 1(a) and 1(c) show a represen-tative SEM image of low and high magnifications of AgNO3-graphene-Ti(Ⅳ) isopropoxide/PVP composite fibers. The as-made AgNO3-graphene-Ti(Ⅳ)isopropoxide /PVP composite fibers have a smooth surface; the diameters of these fibers are 300~500 nm. Fig. 1(b) and 1(d) show SEM image of low and high magnifica-tions of Ag-gaphene-TiO2 composite fibers, the calcined process would cause some changes of the smooth cylindrical shape of the bers both in general shape and superficial roughness, the diameters of the TiO2 nanofibers are 100~250 nm, and the length of the fibers reached a few millimeters length.
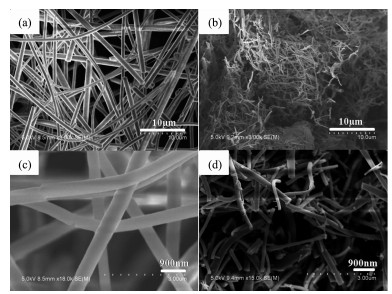 图1
(a) and (c) SEM images of AgNO3-graphene-Ti(Ⅳ) isopropoxide/PVP composite nanofiber surface; (b) and (d) SEM images Ag-gaphene-TiO2 nanofiber suface calcined at 500 ℃
Figure1.
(a) and (c) SEM images of AgNO3-graphene-Ti(Ⅳ) isopropoxide/PVP composite nanofiber surface; (b) and (d) SEM images Ag-gaphene-TiO2 nanofiber suface calcined at 500 ℃
图1
(a) and (c) SEM images of AgNO3-graphene-Ti(Ⅳ) isopropoxide/PVP composite nanofiber surface; (b) and (d) SEM images Ag-gaphene-TiO2 nanofiber suface calcined at 500 ℃
Figure1.
(a) and (c) SEM images of AgNO3-graphene-Ti(Ⅳ) isopropoxide/PVP composite nanofiber surface; (b) and (d) SEM images Ag-gaphene-TiO2 nanofiber suface calcined at 500 ℃
Fig. 2 shows typical TEM images of the products. After calcined, nanofiber with diameters of 200 nm is observed. It indicates that the formation of Ag-gaphene-TiO2 nanofiber.
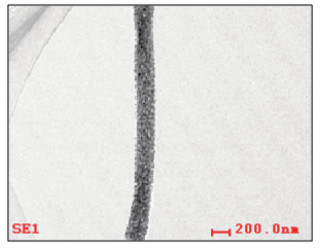 图2
TEM image of Ag-gaphene-TiO2 nanofiber
Figure2.
TEM image of Ag-gaphene-TiO2 nanofiber
图2
TEM image of Ag-gaphene-TiO2 nanofiber
Figure2.
TEM image of Ag-gaphene-TiO2 nanofiber
TG-DSC data for precursors AgNO3-graphene-Ti(Ⅳ) isopropoxide/PVP composite fibers, in air atmos-phere, reveals that the substances show different thermal behaviors. This fact can be explained by the presence of graphene in the nanofiber. Another aspect observed was that the stoichiometry for decomposition, at 175 ℃, where the mass losses 36.4% in the first decline stages, corresponding to a transformation of the tetrabutyltitanate molecules to Ti(OH)4, at 330 ℃, mass losses 28.3% in the second decline stages, due to decomposition and carbonization of polyvinylpyrro-lidone, finally, an aspect which was observed by the tangent TG analysis, between 450 and 500 ℃, was that the carbon oxygenolysis, with 20.1% of mass loss, this mass loss would correspond to carbon oxygenolysis, the carbon is mainly derived from the carbonization of polyvinylpyrrolidone, and graphene on surface of the fiber.
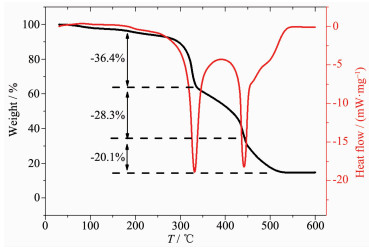 图3
TG-DSC curve of precursors AgNO3-graphene-Ti(Ⅳ) isopropoxide/PVP composite fibers
Figure3.
TG-DSC curve of precursors AgNO3-graphene-Ti(Ⅳ) isopropoxide/PVP composite fibers
图3
TG-DSC curve of precursors AgNO3-graphene-Ti(Ⅳ) isopropoxide/PVP composite fibers
Figure3.
TG-DSC curve of precursors AgNO3-graphene-Ti(Ⅳ) isopropoxide/PVP composite fibers
The obtained samples were further characterized by EDS mapping characterization. The EDS mapping images (Fig. 4) indicate that the sample contains Ti, O, Ag and C elements, suggesting the co-existence of titanium dioxide, Ag nanoparticles and gaphene. It is clearly shown that Ag (Fig. 4c) and C elements (Fig. 4d) are well dispersed in the samples, suggesting that the Ag nanoparticles and gaphene were uniformly distributed throughout the fiber. Hence one can see that at 500 ℃, the graphene embedded in the TiO2 fiber was not oxidized and decomposed, and was successfully retained in the fiber carrier.
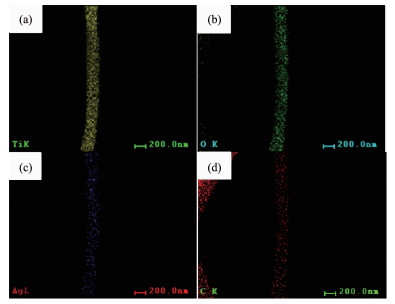 图4
TEM (EDS) mapping image of Ti element (a), O element (b), Ag element (c) and C element (d)
Figure4.
TEM (EDS) mapping image of Ti element (a), O element (b), Ag element (c) and C element (d)
图4
TEM (EDS) mapping image of Ti element (a), O element (b), Ag element (c) and C element (d)
Figure4.
TEM (EDS) mapping image of Ti element (a), O element (b), Ag element (c) and C element (d)
Fig. 5(a) shows the XRD patterns of the TiO2 and Ag/TiO2/graphene fibers sample. The structure of TiO2 was compared with the Joint Committee for Powder Diffraction Standards (JCPDS) data (File Card No.21-1272) and was found to be in anatase and rutile form, and metallic silver phases (JCPDS File Card No.89-3722) were detected in their patterns. However, the reflection peak of graphene is absent because of its low content. EDX measurement results further confir-med the existence of graphene in the composite. As shown in Fig. 5(b), peaks of carbon, appearing clearly at about 0.2 keV is attributable to graphene. Besides, three peaks are clearly located around 0.4, 4.5 and 5 keV, these are related to the characteristics of titanium, while the strong spectrum at about 3 and 0.5 keV originates from the silver and oxygen. Energy dispersive X-ray spectroscopy (EDX) mapping analysis shows that the composite fiber is composed of Ti, O, C, and Ag with uniform distribution (Fig. 4). The mass percent of component Ag and C estimated from EDX spectrum were about 7% and 10%, respectively (Fig. 5b).
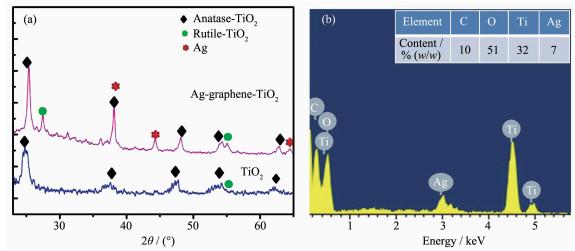 图5
XRD pattern of the TiO2 fibers and Ag-graphene-TiO2 fibers (a) and EDX spectrum (b) of the as-prepared Ag-graphene-TiO2 fibers
Figure5.
XRD pattern of the TiO2 fibers and Ag-graphene-TiO2 fibers (a) and EDX spectrum (b) of the as-prepared Ag-graphene-TiO2 fibers
图5
XRD pattern of the TiO2 fibers and Ag-graphene-TiO2 fibers (a) and EDX spectrum (b) of the as-prepared Ag-graphene-TiO2 fibers
Figure5.
XRD pattern of the TiO2 fibers and Ag-graphene-TiO2 fibers (a) and EDX spectrum (b) of the as-prepared Ag-graphene-TiO2 fibers
Fig. 6(a) shows the Raman spectra of Ag-grapene-TiO2 nanofibers. Two prominent peaks corresponding to the G and D bands of graphene appeared at 1 347 and 1 598 cm-1, respectively. In particular, the bands at 398, 456, and 673 cm-1 are presented implying the existence of the anatase TiO2, Ag NPs are not detected in Raman spectra, due to low content. The nitrogen adsorption-desorption isotherms of the as-obtained Ag-gaphene-TiO2 shown in Fig. 6(b). The Brunauer-Emmett-Teller (BET) specific surface area of the nanofibers was 48 m2·g-1, very similar to TiO2 nanofibers and P-25 TiO2 nanoparticles[21].
 图6
Raman spectrum (a) and Nitrogen adsorption-desorption isotherm (b) of the as-prepared Ag-gaphene-TiO2 nanofibers, respectively
Figure6.
Raman spectrum (a) and Nitrogen adsorption-desorption isotherm (b) of the as-prepared Ag-gaphene-TiO2 nanofibers, respectively
图6
Raman spectrum (a) and Nitrogen adsorption-desorption isotherm (b) of the as-prepared Ag-gaphene-TiO2 nanofibers, respectively
Figure6.
Raman spectrum (a) and Nitrogen adsorption-desorption isotherm (b) of the as-prepared Ag-gaphene-TiO2 nanofibers, respectively
2.2 Photocurrent conversion properties of the electrodes decorated with Ag-gaphene-TiO2 nanofibers
Fig. 7a depicts the typical photocurrent versus time (I-t) response curves for TiO2, Ag-TiO2 and Ag-graphene-TiO2 samples under visible-light irradiation. All the samples presented a rise and fall mode, changes in the photocurrent closely matched illumination over time. As shown in Fig. 5a, the photocurrent density of the pristine TiO2 nanofiber was 0.18 μA·cm-2, while Ag-TiO2 was 0.42 μA·cm-2, which is 2.3 times higher than those of the TiO2. This result may be because of localized surface plasmon resonance of Ag nanoparti-cles on the TiO2 nanofiber surface, which enhance its optical response to visible light region, thereby improving the photocurrent property. As expected, after introducing graphene, the photocurrent density increased remarkably, 4.5 and 1.93 times as much as that of TiO2 and Ag-TiO2, respectively. Ag-graphene-TiO2 exhibited much higher photocurrent property, ascribe to the localized surface plasmon resonance (LSPR) of Ag NPs, high electron transfer and broad absorption in the visible light of graphene induce an activity promotion under visible light. The proportion of graphene is critical for the photocurrent activity, as shown in Fig. 7(b), with increased graphene content from 4% to 8%(w/w), the photocurrent density of Ag-graphene-TiO2 increased from 0.45 μA·cm-2 to 0.81 μA·cm-2, which is higher than those reported for the ZnO nanoparticle-decorated reduced graphene oxide composites[22], CuS/reduced graphene oxide nanocomp-osites[23], graphene oxide[24]. However, further increased graphene content from 8% to 10%(w/w), the photo-current density of Ag-graphene-TiO2 decreased to 0.7 μA·cm-2, This may be due to that high graphene load prevented TiO2 from absorbing visible light, which in a rapid decrease of irradiation. Therefore, the optimum doping content for graphene was 8%(w/w), which may be due to the balance between the increase in highest electron transfer and the decrease in light adsorption. Another important feature of Ag-graphene-TiO2 is the reusability; photocurrent density was measured and repeated ten on-off cycles to examine the reusability. As shown in Fig. 7(c), It was found the photocurrent density still maintained 95% after 10 on-off cycles, indicating high stability of Ag-graphene-TiO2.
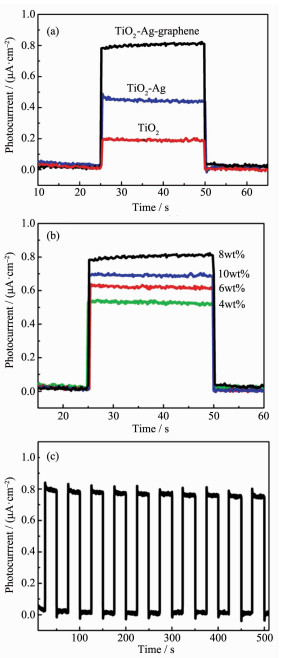 图7
(a) Photocurrent transient responses at a constant potential of 0.5 V for different samples, (b) Recycle stability of Ag-graphene-TiO2 under visible-light irradiation, (c) Photocurrent transient responses for different loaded graphene content in Ag-graphene-TiO2 nanofiber
Figure7.
(a) Photocurrent transient responses at a constant potential of 0.5 V for different samples, (b) Recycle stability of Ag-graphene-TiO2 under visible-light irradiation, (c) Photocurrent transient responses for different loaded graphene content in Ag-graphene-TiO2 nanofiber
图7
(a) Photocurrent transient responses at a constant potential of 0.5 V for different samples, (b) Recycle stability of Ag-graphene-TiO2 under visible-light irradiation, (c) Photocurrent transient responses for different loaded graphene content in Ag-graphene-TiO2 nanofiber
Figure7.
(a) Photocurrent transient responses at a constant potential of 0.5 V for different samples, (b) Recycle stability of Ag-graphene-TiO2 under visible-light irradiation, (c) Photocurrent transient responses for different loaded graphene content in Ag-graphene-TiO2 nanofiber
3 Conclusions
The present study demonstrates a novel method to prepare Ag-graphene-TiO2 nanofibers with good dispersity. As a result, novel nanocomposites shows enhanced visible-light photocurrent activity as compared with those has been previously reported. The high photocurrent activity of the Ag-graphene-TiO2 can be attributed to the synergistic effect originating from the enhanced optical response to visible light with Ag and fast electron transfer with graphene, resulting in increased photocurrent activity. The recycling test revealed that the Ag-graphene-TiO2 prepared in this study was stable and effective for increasing the attainable photocurrent. Therefore, the approach described in this paper help improve the characteristics of photoelectric conversion systems. We estimate that this work provided a simple and effective strategy to fabricate composite photocurrent materials for applications.
-
-
[1]
Kim H S, Lee J W, Yantara N, et al. Nano Lett., 2013, 13(6):2412-2417 doi: 10.1021/nl400286w
-
[2]
(a)Wang D, Zhao L, Guo L H, et al. Anal. Chem. , 2014, 86(21): 10535-10539
(b)Izadyar S, Fatemi S. Ind. Eng. Chem. Res. , 2013, 52(32): 10961-10968 -
[3]
(a)Yang Y, Wang H, Li J, et al. Environ. Sci. Technol. , 2012, 46(12): 6815-6821
(b)Chang X, Thind S S, Chen A. ACS Catal. , 2014, 4(8): 2616-2622 -
[4]
Khajavi R, Berendjchi A. ACS Appl. Mater. Interfaces, 2014, 6(21):18795-18799 doi: 10.1021/am504489u
-
[5]
Virkutyte J, Varma R S. RSC Adv., 2012, 2(4):1533-1539 doi: 10.1039/C1RA00990G
-
[6]
Barreca D, Comini E, Ferrucci A P, et al. Chem. Mater., 2007, 19(23):5642-5649 doi: 10.1021/cm701990f
-
[7]
Kim I D, Rothschild A, Lee B H, et al. Nano Lett., 2006, 6(9):2009-2013 doi: 10.1021/nl061197h
-
[8]
Park J H, Kim S, Bard A J. Nano Lett., 2006, 6(1):24-28 doi: 10.1021/nl051807y
-
[9]
Li J, Cushing S K, Zheng P, et al. J. Am. Chem. Soc., 2014, 136(23):8438-8449 doi: 10.1021/ja503508g
-
[10]
Lu Q, Lu Z, Lu Y, et al. Nano Lett., 2013, 13(11):5698-5702 doi: 10.1021/nl403430x
-
[11]
Su R, Bechstein R, Kibsgaard J, et al. J. Mater. Chem., 2012, 22(45):23755-23758 doi: 10.1039/c2jm34298g
-
[12]
Lo H H, Gopal N O, Sheu S C, et al. J. Phys. Chem. C, 2014, 118(5):2877-2884 doi: 10.1021/jp411723m
-
[13]
Mamba G, Mamo M A, Mbianda X Y, et al. Ind. Eng. Chem. Res., 2014, 53(37):14329-14338 doi: 10.1021/ie502610y
-
[14]
Etgar L, Gao P, Xue Z, et al. J. Am. Chem. Soc., 2012, 134(42):17396-17399 doi: 10.1021/ja307789s
-
[15]
Roiati V, Giannuzzi R, Lerario G, et al. J. Phys. Chem. C, 2015, 119(13):6956-6965 doi: 10.1021/jp5121004
-
[16]
Ngaboyamahina E, Cachet H, Pailleret A, et al. J. Electroanal. Chem., 2015, 737:37-45 doi: 10.1016/j.jelechem.2014.09.029
-
[17]
McEntee M, Stevanovic A, Tang W, et al. J. Am. Chem. Soc., 2015, 137(5):1972-1982 doi: 10.1021/ja511982n
-
[18]
(a)Lian Z, Wang W, Xiao S, et al. Sci. Rep. , 2015, 5: 10461
(b)Choi Y, Kim H, et al. ACS Catal. , 2016, 6(2): 821-828 -
[19]
Linsebigler A L, Lu G, Yates J T. Chem. Rev., 1995, 95(3):735-758 doi: 10.1021/cr00035a013
-
[20]
Wang X, Fan L, Gong D, et al. Adv. Funct. Mater., 2016, 26(7):1143-1143 doi: 10.1002/adfm.v26.7
-
[21]
Mukherjee K, Teng T H, Jose R, et al. Appl. Phys. Lett., 2009, 95(1):012101 doi: 10.1063/1.3167298
-
[22]
Tian J, Liu S, Li H, et al. RSC Adv., 2012, 2:1318-1321 doi: 10.1039/c2ra01114j
-
[23]
Zhang Y, Tian J, Li H, et al. Langmuir, 2012, 28:12893-12900 doi: 10.1021/la303049w
-
[24]
张晓艳, 孙明轩, 孙钰珺, 等.物理化学学报, 2011, 27(12):2831-2835 doi: 10.3866/PKU.WHXB20112831ZHANG Xiao-Yan, SUN Min-Xuan, SUN Yu-Jun, et al. Acta Phys.-Chim. Sin., 2011, 27(12):2831-2835 doi: 10.3866/PKU.WHXB20112831
-
[1]
-

Scheme 1 Typical photoresponses of Ag-graphene-TiO2 fiber under visible light irradiation

Figure 1 (a) and (c) SEM images of AgNO3-graphene-Ti(Ⅳ) isopropoxide/PVP composite nanofiber surface; (b) and (d) SEM images Ag-gaphene-TiO2 nanofiber suface calcined at 500 ℃

Figure 3 TG-DSC curve of precursors AgNO3-graphene-Ti(Ⅳ) isopropoxide/PVP composite fibers

Figure 4 TEM (EDS) mapping image of Ti element (a), O element (b), Ag element (c) and C element (d)

Figure 5 XRD pattern of the TiO2 fibers and Ag-graphene-TiO2 fibers (a) and EDX spectrum (b) of the as-prepared Ag-graphene-TiO2 fibers

Figure 6 Raman spectrum (a) and Nitrogen adsorption-desorption isotherm (b) of the as-prepared Ag-gaphene-TiO2 nanofibers, respectively
-


 下载:
下载:


 扫一扫看文章
计量
- PDF下载量: 6
- 文章访问数: 1718
- HTML全文浏览量: 202
 下载:
下载:
