图 Scheme 1
Structure diagram of the complexes
Figure Scheme 1.
Structure diagram of the complexes

Crystal Structures and Properties of Two Linear Trinuclear Complexes
Li-Wen WANG , Qi-Gao SHANG , Jing-Jing ZHOU , Hong ZHOU , Zhi-Quan PAN , Qing-Rong CHENG


Polynuclear transition complexes containing nitrogen and phenolic oxygen donor atoms are of considerable interest in inorganic and biomimetic chemistry due to their potential application in cataly-sis, their biological relevance, and potentially inter-esting magnetic properties[1-4]. The extensively investi-gated "metallosalen-type" coordination compounds have long been employed as catalysts for the selective epoxidation of olefins and the oxidation of hydro-carbons and in recent years for DNA cleavage[5-8].
Cobalt complexes derived from Schiff bases have attracted an extensive interest in the area of coor-dination chemistry due to their intriguing structural features and various applications covering catalysis in organic synthesis, photochemistry, electrochemistry and important biological applications[9-12]. Ever since the structural determination of Ni3(dpa)4Cl2 in 1991[13], when it was realized that the anion of 2, 2'-dipyridyla-mine (dpa) can support the formation of linear chains of three nickel atoms, studies of extended metal atom chains (EMACs) have attracted considerable attention[14]. Cotton group reported the linear trinuclear complexes and studied the magnetic susceptibility measure-ments[15].
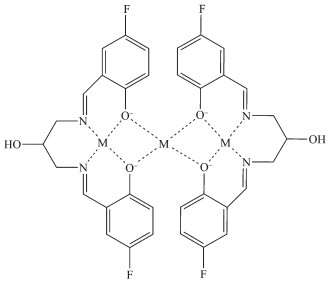
In our recent work we have synthesized a series of dinuclear complexes and studied their DNA cleavage abilities and magnetism[16-23]. As part of on going studies on the polynuclear complex, two linear trinuclear nickel complex and cobalt complex were reported. In order to investigate the synergistic effect between metal ions and ligand, and the magnetic interaction among metal ions, their DNA cleavage abilities and magnetisms were also studied. The structure diagram of two complexes are showed in the Scheme 1.
All solvents and chemicals were of analytical grade and used as received, except that ethanol was purified to absolute by the general method. IR spectra were recorded on a Vector 22 FT-IR spectrophoto-meter using KBr disks. Elemental analyses were performed on a Perkin-Elmer 240 analyzer. Cyclic voltammograms were performed on a CHI model 750B electrochemical analyzer in DMF solution containing tetra(n-butyl) ammonium perchlorate (TBAP) as the supporting electrolyte. A three-electrode cell was used, which was equipped with a glassy carbon-working electrode, a platinum wire as the counter electrode and an Ag/AgCl electrode as the reference electrode. Scanning rates were in the range of 20~200 mV·s-1. The solution was deaerated for 15 min before measurements. The half-wave potentials were calcul-ated approximately from (Epa+Epc)/2, and the measured error was 2 mV. Magnetic susceptibility of a crystalline-powdered sample was measured on a SQUID-based sample magnetic meter in the temperature range of 2.0~300 K, and the diamagnetic corrections were made according to Pascals constants. UV-Vis spectra were recorded on an UV-2450 spectrophotometer. Circular dichroic spectra of DNA were obtained by using a Jasco J-810 spectropolarimeter. Electrospray mass spectrum (ES-MS) was determined on a Finnigan LCQ ES-MS mass spectrograph using methanol as a mobile phase with a sample concentration of 1.0 mmol·L-1.
To the mixture of methanol (1 mL) containing 5-fluorosalicylaldehyde (0.141 g, 1 mmol), 2-hydroxy-1, 3-propane diamine (0.045 g, 0.5 mmol) was slowly added. The mixture was stirred for 6 h, then the yellow resolution was obtained. After adding the mixture of methanol (6 mL) containing Co(CH3COO)2·4H2O (0.249 g, 1 mmol), The mixture was stirred for 8 h, and the color changed to dark red. Then the filtrate was slowly evaporated in air to give red single crystals. Yield: 0.169 g, 39%. Anal. Calcd. for C42H40O14N4F4Co3(%): C, 46.81; H, 3.74; N, 5.19. Found(%): C, 46.84; H, 3.71; N, 5.16. IR(KBr, cm-1): 3 050, 2 911 (C-H), 1 640 (C=N), 1 080, 625 (ClO4-). ESI-MS(m/z): 897.92 for [Co3L2(OAc)]+ (Supporting information).
Complex 2 was prepared by the same method as described above except that Ni(CH3COO)2·4H2O was used instead of Co(CH3COO)2·4H2O. Yield: 0.182 g, 42%. Anal. Calcd. for C40H46O14N4F4Ni3(%): C 45.37, H 4.38, N 5.29. Found(%): C 45.68, H 3.92, N 6.01. IR(KBr, cm-1): 3 049, 2 910 (C-H), 1 641 (C=N), 1 083, 624 (ClO4-). ESI-MS(m/z): 839.17 for [Ni3L2(OH)]+ (Supporting information).
Crystals were measured on a Bruker AXS SMART diffractometer (Mo Kα, λ=0.071 073 nm). Data reduction and cell refinement were performed by SMART and SAINT[24]. The structures were solved by direct methods (Bruker SHELXTL) and refined on F2 by full-matrix least squares (Bruker SHELXTL) using all unique data[25]. The non-hydrogen atoms in the structure were treated as anisotropic. All the hydrogen atoms (except the ones bound to water molecules) were placed in calculated positions with fixed isotropic thermal parameters and included in structures factor calculations in the final stage of full-matrix least-squares refinement. The hydrogen atoms of water molecules were located by difference maps and constrained to ride on their parent O atoms. The crystallographic data and the details about the data collection are presented in Table 1.

 下载:
导出CSV
下载:
导出CSV
| Complex | 1 | 2 |
| Empirical formula | C42H40O14N4F4Co3 | C40H46O14N4F4Ni3 |
| Formula weight | 1 077.57 | 1 058.94 |
| Crystal system | Triclinic | Monoclinic |
| Space group | P1 | P21/n |
| a/nm | 1.375 7(1) | 1.256 0(5) |
| b/nm | 1.607 2(1) | 1.306 4(5) |
| c/nm | 1.897 1(1) | 1.498 8(6) |
| α/(°) | 106.930(1) | |
| β/(°) | 94.018(1) | 113.406(5) |
| γ/(°) | 109.034(1) | |
| V/nm3 | 3.729 8(5) | 2.256 9(15) |
| Z | 3 | 2 |
| Dc/(g·cm-3) | 1.439 | 1.558 |
| μ/mm | 1.068 | 1.324 |
| F(000) | 1 647 | 1 092 |
| Crystal size/mm | 0.10×0.12×0.16 | 0.22×0.24×0.28 |
| T/K | 298 | 291 |
| θ range/(°) | 1.949~25.007 | 2.356~25.998 |
| Nref, Npar | 12 990, 902 | 4 436, 297 |
| Total reflection, unique (Rint) | 12 990, 12 990 (0.230 4) | 12 227, 4 436 (0.058 4) |
| Observed data[I > 2σ(I)] | 10 268 | 2 988 |
| R1, wR2, S | 0.106 7, 0.239 6, 1.156 | 0.058 4, 0.120 6, 1.025 |
| (Δρ)max, (Δρ)min/(e·nm-3) | 1 010, -1 190 | 331, -482 |
CCDC: 1587441, 1; 1587442, 2.
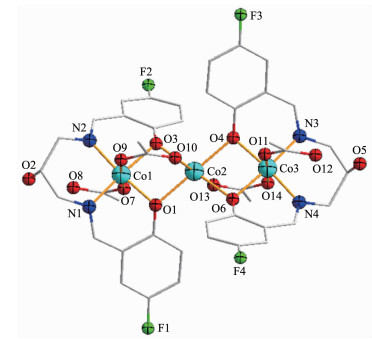
The crystal structures of the complexes are shown in Fig. 1 and Fig. 2, together with the atom numbering scheme. And selected bond lengths (nm) and angles (°) relevant to the metal coordination spheres of the complexes are listed in Table 2.
 下载:
导出CSV
下载:
导出CSV
| Complex 1 | |||||
| Col-01 | 0.l90 3(6) | Co2-0l0 | 0.205 4(7) | Co2-03 | 0.2l6 8(6) |
| Col-03 | 0.l90 l(6) | Co2-0l3 | 0.205 0(6) | Co2-04 | 0.207 7(6) |
| Col-07 | 0.l9l 5(7) | Co3-04 | 0.l93 4(6) | Co3-0ll | 0.l90 3(6) |
| Col-09 | 0.l92 0(6) | Co3-06 | 0.l9l 4(6) | Co3-0l4 | 0.l93 7(6) |
| Col-Nl | 0.l90 7(6) | Col-N2 | 0.l90 9(8) | Co3-N3 | 0.l92 6(7) |
| Co2-06 | 0.2l7 0(6) | Co2-0l | 0.207 2(6) | Co3-N4 | 0.l90 5(7) |
| Nl-Col-N2 | 94.9(3) | 03-Co2-0l3 | l60.l(2) | 04-Co3-06 | 83.7(2) |
| 0l-Col-03 | 82.2(2) | 04-Co2-06 | 74.3(2) | 04-Co3-0ll | 86.8(3) |
| 0l-Col-07 | 87.7(3) | 04-Co2-0l0 | 88.8(2) | 04-Co3-0l4 | 94.0(3) |
| 0l-Col-09 | 92.2(3) | 04-Co2-0l3 | 90.5(2) | 04-Co3-N3 | 89.8(3) |
| 0l-Col-Nl | 90.6(3) | 06-Co2-0l0 | l6l.7(2) | 06-Co3-N3 | l73.2(3) |
| 0l-Col-N2 | l74.2(3) | 06-Co2-0l3 | 85.2(2) | 06-Co3-N4 | 9l.7(3) |
| 03-Col-07 | 86.8(3) | 0l0-Co2-0l3 | 87.8(3) | 0ll-Co3-0l4 | l77.7(3) |
| 03-Col-09 | 93.7(3) | 0l-Co2-03 | 72.2(2) | 0ll-Co3-N3 | 94.5(3) |
| 03-Col-Nl | l72.8(3) | 0l-Co2-04 | l77.l(2) | 0ll-Co3-N4 | 93.2(3) |
| 03-Col-N2 | 92.4(3) | 0l-Co2-06 | l03.0(2) | 0l4-Co3-N3 | 87.7(3) |
| 07-Col-09 | l79.5(2) | 0l-Co2-0l0 | 94.0(2) | 0l4-Co3-N4 | 85.9(3) |
| 07-Col-N7 | 92.2(3) | 0l-Co2-0l3 | 90.2(2) | N3-Co3-N4 | 94.8(3) |
| 09-Col-N2 | 87.3(3) | 03-Co2-04 | l07.5(2) | 06-Co3-0ll | 87.0(3) |
| 09-Col-N6 | 86.2(3) | 03-Co2-06 | l07.5(2) | 06-Co3-0l4 | 90.9(3) |
| 07-Col-N2 | 93.9(3) | 03-Co2-0l0 | 84.2(2) | 04-Co3-N4 | l75.4(3) |
| Complex 2 | |||||
| Nil-0l | 0.l97 l(3) | Nil-Nl | 0.20l 4(4) | Ni2-04 | 0.20l 7(3) |
| Nil-02 | 0.l96 8(3) | Nil-N2 | 0.l98 l(4) | Ni2-04a | 0.20l 7(3) |
| Nil-03 | 0.203 7(3) | Ni2-0l | 0.206 5(3) | ||
| Nil-06 | 0.2l4 6(3) | Ni2-02 | 0.208 6(3) | ||
| 0l-Nil-06 | 90.49(l2) | 03-Nil-Nl | 90.59(l3) | 02-Ni2-04 | 90.35(ll) |
| 0l-Nil-02 | 82.37(l3) | 0l -Ni2-04a | 89.59(l2) | 04-Ni2-04a | l80.0 |
| 0l-Nil-03 | 9l.l8(l2) | 0l -Ni2-0la | l80.0 | 0la-Ni2-02a | 77.37(ll) |
| 0l-Nil-N2 | l70.64(l6) | 0l -Ni2-02a | l02.63(ll) | 0la-Ni2-04a | 90.4l(l2) |
| 02-Nil-03 | 9l.92(ll) | 0la-Ni2-02 | l02.63(ll) | 02a-Ni2-04a | 90.35(ll) |
| 02-Nil-06 | 93.07(l3) | 02-Ni2-02a | l80.0 | 02a-Ni2-04 | 89.65(ll) |
| 02-Nil-Nl | l72.59(l3) | 02-Ni2-04a | 89.65(ll) | Nil-0l-Ni2 | 97.l9(ll) |
| 0l-Nil-Nl | 90.6l(l5) | 0la-Ni2-04 | 89.59(l2) | Nil -02-Ni2 | 96.60(ll) |
| 03-Nil-06 | l74.9l(l3) | 02-Nil-N2 | 89.08(l3) | ||
| Symmetry codes: a: -x+1/2, y+1/2, -z+1/2 | |||||
The molecular structure of 1 consists of two Co(Ⅲ) ions and one Co(Ⅱ) ion, two ligand units and four OAc- anions. Co1 and Co3 ions are hexa-coordinated with a distorted octahedron geometry and have similar coordinated environment. Co1/Co3 ion resides in the N2O2 sites of the Schiff-base ligand, and the basal plane is formed by two imine nitrogen atoms arising from the Schiff-base ligand, and two phenoxo oxygen atoms. The apical position is occupied by the oxygen atom arising from OAc- anion (Co1-O7 0.191 5(7) nm, Co1-O9 0.192 0(6)nm; Co3-O11 0.189 7(2) nm, Co3-O14 0.187 2(6) nm). The Co1/Co3-N and Co1/Co3-O distances in the basal plane are 0.190 1~0.193 4 nm. The values of the O1-Co1-O3 and N1-Co1-N2 angles are 82.2(2)° and 94.9(3)°, and the values of the O4-Co3 -O6 and N3-Co3-N4 angles are 83.7(2)° and 94.8(3)°. Co1, Co2 and Co3 ions are linked by OAc- anions and phenoxo oxygen atoms, and the value of the Co1…Co2…Co3 angle is 155.49(4)°.
The molecular structure of 2 consists of three Ni(Ⅱ) ions, two ligand units, two methanol molecules and two OAc- anions. The whole molecule is high symmetrical with Ni2 as symcenter. Ni1 ions are hexa-coordinated with a distorted octahedron geometry, in which the apical position is occupied by the oxygen atoms arising from the methanol molecule (Ni1-O6 0.214 5(2) nm) and OAc- anion (Ni1-O3 0.203 7(2) nm), respectively. The basal plane is formed by two imine nitrogen atoms arising from the Schiff-base ligand, and two phenoxo oxygen atoms. Ni2 ion also has a distorted octahedron geometry, in which the apical position is occupied by the oxygen atoms arising from OAc- anion (Ni2-O4 0.201 7(2) nm). The basal plane is formed by four phenoxo oxygen atoms, and all the Ni2-O distances in the basal plane are 0.201 7(2) nm. The value of the Ni1…Ni2…Ni1 angle is 180.00°, so all the Ni ions are in a line.
Electronic absorption spectroscopy is one of the most useful methods for DNA-binding studies of metal complexes. The absorption spectra of complex 1 in the absence and presence of calf thymus DNA at different concentrations (8~175 μmol·L-1) are shown in Fig. 3. The spectrum of complex 1 shows a very strong absorption at 385 nm, which is attributed to a metal-to-ligand charge transfer (MLCT)[26-27]. The band shows a hypochromism of 23.4% after adding DNA. The finding supports the hypothesis of a DNA intercalating interaction of the complex[28]. The results suggest that complex 1 interacts with DNA most likely through a stacking interaction between the aromatic chromo-phore and the base pairs of DNA. After intercalating the base pairs of DNA, the π* orbital of the inter-calated ligand can couple with the π orbitals of the base pairs, decreasing the π-π* transition energy and resulting in bathochromism.

In order to quantitatively investigate the binding strength of the complex with CT-DNA, the intrinsic binding constant Kb was obtained by monitoring the changes in absorbance at 385 nm for the complex as increasing concentration of CT-DNA using the equa-tion, cDNA/Eap=cDNA/E+1/(KbE), where Eap=εa-εf, E=εb-εf; εa, εf and εb correspond to Aobs/(ccomplexl), the extinction coefficients for the free complex and the complex in the fully bound form, respectively. As shown in Fig. 3b, the value of Kb was obtained from the ratio of slope to the intercept from the plot of cDNA/Eap vs cDNA[29]. The Kb value is 2.43×10⁵ L·mol-1.
It is well known that mixed solutions of DNA and EB show very strongly enhanced fluorescence emission[30] due to intercalation of EB to DNA. The emission spectra of EB bound to DNA in the absence and presence of the complex are given in Fig. 4. It can be noted that the fluorescence intensity of the EB-DNA solutions decreases with the addition of the complex obviously. The results suggest that the complex can replace the EB and bind to the DNA molecule.
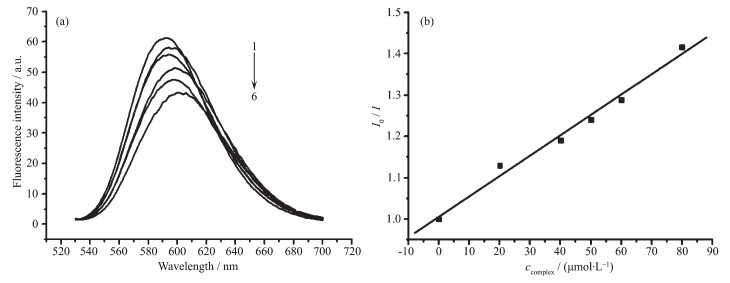
According to the classical Stern-Volmer equation I0/I=1+Kccomplex, in which I0 and I are the fluorescence intensities in the absence and presence of complex, respectively; K is the linear Stern-Volmer quenching constant and ccomplex is the concentration of the complex, the relative binding propensity of the complex to CT-DNA can be determined[29]. The fluorescence intensity at (597±4) nm (λex=520 nm) of EB in the bound form was plotted against the compound concentration. The quenching constant K of the complex is obtained by the slopes of the plot of I0/I vs ccomplex in Fig. 4b. The calculated quenching constant K is 4.92×10³ L·mol-1, which is smaller than the values of classical intercal-ative mode[28, 31].
The electrochemical properties of complex 1 were studied by cyclic voltammetry in 50 mmol·L-1 Tris-HCl/50 mmol·L-1 NaCl buffer solution (pH=7.2) using tetrabutyl ammonium perchlorate (TBAP) as supporting electrolyte and a sweep range of -1.0~-0.4 V. The cyclic voltammograms of complex 1 in the absence and in the presence of CT-DNA are shown in Fig. 5.
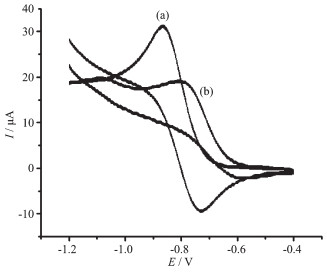
In the absence of DNA, the CV curve of complex 1 has a cathodic peak at -0.834 V and an anodic peak at -0.729 V. The separation between the cathodic and anodic peak potential, ΔE=0.105 V, indicates an irreversible process[32]. Addition of CT-DNA to complex 1 results in a decrease in the cathodic and anodic peak current, which could be explained by a reduction in the apparent diffusion coefficient of the complex on binding to DNA[33]. These results again indicate that an intercalative interaction occurred between complex 1 and DNA[34].
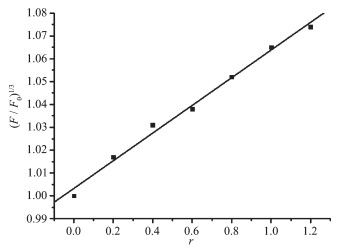
Viscosity, sensitive to length increase, is regarded as the one of the least ambiguous and the most critical tests of binding model with DNA in solution in the absence of crystallographic structural data[35]. To clarify the binding mode of complex 1 with DNA, a viscosity study of DNA solutions containing varying amount of added complex 1 was carried out (Fig. 6). The specific viscosity of the DNA increases obviously with the addition of the increasing amounts of the complex. The results suggest that the main binding mode between complex 1 and DNA may be intercalation[36-37].
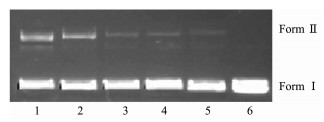
In order to evaluate the function of complex 1 to incise pBR322 DNA, the cleavage reaction of supercoiled pBR322 DNA was monitored by agarose gel electrophoresis. The cleavage products were subjected to gel electrophoretic separation and the gels were analyzed after ethidium bromide staining. As shown in Fig. 7, with increasing concentrations of the complex, the amount of Form Ⅰ (supercoiled form) of DNA diminished obviously, whereas Form Ⅱ (nicked form) and Form Ⅲ (linear form) increased. This suggests that complex 1 can cleave the DNA effectively.
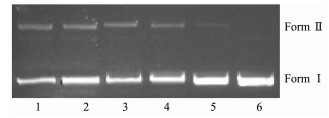
In order to further clarify the DNA cleavage mechanism, some scavenging agents, hydroxyl radical scavengers (5 mmol·L-1 DMSO and 5 mmol·L-1 EtOH), superoxide scavenger (5 mmol·L-1 KI) and singlet oxygen scavenger (5 mmol·L-1 NaN3), were added in the incubation solution. No obvious change of DNA cleavage activity of the complex is observed in the presence or absence of the scavenging agents (Fig. 8). Therefore, DNA cleavage promoted by this complex might not occur by an oxidative pathway but rather by a hydrolytic pathway and/or intercalation. This result is consistence with the deduction from UV-Vis and fluorescence spectroscopy studies.
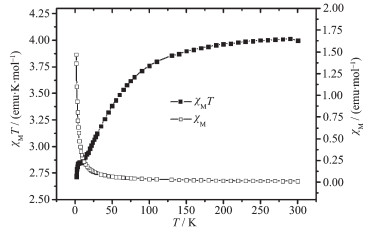
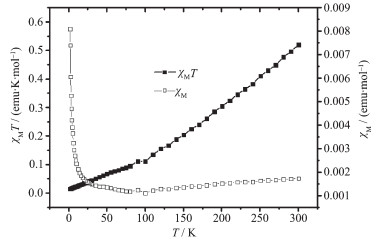
The magnetic susceptibilities of complexes 1 and 2 were measured on a SQUID magnetometer within the temperature range of 2.0~300 K. The temperature dependence of the magnetic susceptibilities of 1 and 2, in the form of χm and χmT, are shown in Fig. 9 and 10. The χmT product is 3.01 emu·K·mol-1 for 1 at room temperature, which is obvious smaller than that of [Co3(pytrz)6(H2O)6](NO3)6[38]. The χmT value decreases slowly upon cooling till about 100 K, then decreases rapidly and reaches 2.73 emu·K·mol-1 at 2 K. The magnetic behavior reveals the antiferromagnetic interactions among three Co centers in 1. The χm and χmT versus T plot of 2 is very different from that of 1. The χmT value is 0.46 emu·K·mol-1 at room temper-ature, which is obvious smaller than that of [Ni3(dpa)4(CH3CN)2](PF6)2[15]. The χmT value decreases rapidly upon cooling till about 100 K, then decreases slowly and reaches 0.01 emu·K·mol-1 at 2 K, which indicates antiferromagnetic interactions among three Ni(Ⅱ) centers.
The magnetic susceptibility data was first treated on the basis of Eq.(1). All the symbols in Eq.(1) have their usual meaning. In this expression, 2J (in the spin Hamiltonian
|
$ \begin{array}{l} \chi = \frac{{2N{g^2}{\beta ^2}}}{{kT}}\frac{{{{\rm{e}}^{2J/\left( {kT} \right)}} + 6 + 5{{\rm{e}}^{4J/\left( {kT} \right)}} + {{\rm{e}}^{ - 4J/\left( {kT} \right)}} + 14{{\rm{e}}^{6J/\left( {kT} \right)}}}}{{3{{\rm{e}}^{2J/\left( {kT} \right)}} + {{\rm{e}}^{ - 2J/\left( {kT} \right)}} + 8 + 5{{\rm{e}}^{4J/\left( {kT} \right)}} + 3{{\rm{e}}^{ - 4J/\left( {kT} \right)}} + 7{{\rm{e}}^{6J/\left( {kT} \right)}}}}\left( {1 - \rho } \right) + \frac{{N{g^2}{\beta ^2}\sum {{S_{\rm{i}}}} \left( {{S_{\rm{i}}} + 1} \right)}}{{3kT}}\rho \\ \;\;\; = \frac{{2N{g^2}{\beta ^2}}}{{kT}}\frac{{{{\rm{e}}^{2J/\left( {kT} \right)}} + 6 + 5{{\rm{e}}^{4J/\left( {kT} \right)}} + {{\rm{e}}^{ - 4J/\left( {kT} \right)}} + 14{{\rm{e}}^{6J/\left( {kT} \right)}}}}{{3{{\rm{e}}^{2J/\left( {kT} \right)}} + {{\rm{e}}^{ - 2J/\left( {kT} \right)}} + 8 + 5{{\rm{e}}^{4J/\left( {kT} \right)}} + 3{{\rm{e}}^{ - 4J/\left( {kT} \right)}} + 7{{\rm{e}}^{6J/\left( {kT} \right)}}}}\left( {1 - \rho } \right) + \frac{{2N{g^2}{\beta ^2}}}{{kT}}\rho \end{array} $ |
|
$ {\chi _{\rm{m}}} = \frac{\chi }{{1 - 2\chi zj'/\left( {N{g^2}{\beta ^2}} \right)}} $ |
In summary, we have prepared and structurally characterized two linear trinuclear complexes. DNA-binding activity studies showed that that complex 1 interacts with DNA by intercalative interaction, and the DNA cleavage mechanism is by hydrolytic pathway. The variable-temperature magnetisms of complexes 1 and 2 show that there are antiferromagnetic couplings among the three metal centers.
Supporting information is available at http://www.wjhxxb.cn
Tangoulis V, Raptopoulou C P, Paschalidou S, et al. Angew. Chem., Int. Ed., 1997, 36:1083-1085 doi: 10.1002/(ISSN)1521-3773
Mukherjee A, Nethaji M, Chakravarty A R. Angew. Chem., Int. Ed., 2004, 43:87-90 doi: 10.1002/(ISSN)1521-3773
Nishida Y, Kida S. J. Chem. Soc. Dalton Trans., 1986, 12:2633-2640
Hilms E, Elias H, Paulus H. J. Chem, Soc. Dalton Trans., 1986, 10:2169-2172
Breslow R, Zhang X J, Xu R, et al. J. Am. Chem. Soc., 1996, 118:11678-11679 doi: 10.1021/ja962295f
Adam W, Fell R T, Stegmann V R, et al. J. Am. Chem. Soc., 1998, 120:708-714 doi: 10.1021/ja9726668
Routier S, Bernier J L, Waring M J, et al. J. Org. Chem., 1996, 61:2326-2331 doi: 10.1021/jo951840c
Lamour E, Routier S, Bernier J L, et al. J. Am. Chem. Soc., 1999, 121:1862-1869 doi: 10.1021/ja982221z
Maleev V I, North M, Larionov V A, et al. Adv. Synth. Catal., 2014, 356:1803-1810 doi: 10.1002/adsc.201400091
Kunkely H, Vogle A. J. Photochem. Photobiol. A:Chem., 2001, 138:51-54 doi: 10.1016/S1010-6030(00)00381-6
Honda T, Kojima T, Fukuzumi S. J. Am. Chem. Soc., 2012, 134:4196-4206 doi: 10.1021/ja209978q
Salehi M, Amirnasr M, Meghdadi S, et al. Polyhedron, 2014, 81:90-97 doi: 10.1016/j.poly.2014.05.049
Aduldecha S, Hathaway B. J. Chem. Soc. Dalton Trans., 1991, 4:993-998 http://pubs.rsc.org/en/content/articlepdf/1991/dt/dt9910000993
Chien C H, Chang J C, Yeh C Y, et al. Dalton Trans., 2006, 17:2106-2113 doi: 10.7517/j.issn.1674-0475.2013.04.001
Cotton F A, Murillo C A, Wang Q S. Inorg. Chem. Commun., 2007, 10:1088-1090 doi: 10.1016/j.inoche.2007.06.001
Cheng Q R, Zhang F Q, Zhou H, et al. J. Coord. Chem., 2015, 68(11):1997-2005 doi: 10.1080/00958972.2015.1032272
Cheng Q R, Yu L, Li P, et al. Transition Met. Chem., 2015, 40:789-797 doi: 10.1007/s11243-015-9973-7
Cheng Q R, You D, Hu H, et al. J. Coord. Chem., 2014, 67(5):910-920 doi: 10.1080/00958972.2014.905685
Cheng Q R, Li P, Zhou H, et al. J. Coord. Chem., 2014, 67(9):1584-1595 doi: 10.1080/00958972.2014.924623
Cheng Q R, Zhou H, Pan Z Q. J. Mol. Struct., 2014, 1071:255-262
Cheng Q R, Zhou H, Pan Z Q. Polyhedron, 2014, 81:668-674 doi: 10.1016/j.poly.2014.07.022
程清蓉, 张雅, 周红, 等.无机化学学报, 2014, 33(11):2591-2500 http://www.cqvip.com/QK/93659X/201411/663041274.htmlCHENG Qing-Rong, ZHANG Ya, ZHOU Hong, et al. Chinese J. Inorg. Chem., 2014, 33(11):2591-2500 http://www.cqvip.com/QK/93659X/201411/663041274.html
Cheng Q R, Zhou H, Pan Z Q. Transition Met. Chem., 2012, 37:407-414 doi: 10.1007/s11243-012-9602-7
SMART and SAINT, Area Detector Control and Integration Software, Siemens Analytical X-ray Systems Inc, Madison, WI, 1996.
Sheldrick G M. SHELXTL Version 5.1, Software Reference Manual, Bruker AXS Inc., Madison, WI, 1997. http://www.scienceopen.com/document?vid=fe93e4c9-2c27-4312-9071-b0e4e3cba1dc
Neves A, Brito M A de, Vencato I, et al. Inorg. Chem., 1996, 35:2360-2368 doi: 10.1021/ic950456v
Gaber B P, Miskowski V, Spiro T G. J. Am. Chem. Soc., 1974, 96:6868-6873 doi: 10.1021/ja00829a010
Tian J L, Feng L, Gu W, et al. J. Inorg. Biochem., 2007, 101:196-202 doi: 10.1016/j.jinorgbio.2006.08.009
Wolfe A, Shimer G H, Meehan T. Biochemistry, 1987, 26:6392-6396 doi: 10.1021/bi00394a013
Meyer-Almes F J, Porschke D. Biochemistry, 1993, 32:4246-4253 doi: 10.1021/bi00067a012
Qian J, Gu W, Liu H, et al. Dalton Trans., 2007:1060-1066 doi: 10.11944/j.issn.1000-0518.2016.02.150236
Zhang J A, Pan M, Yang R, et al. Polyhedron, 2010, 29:590-591 http://www.sciencedirect.com/science/article/pii/S0277538709005038
Ibrahim M S. Anal. Chim. Acta, 2001, 443:65-71
Michael T C, Marisol R, Alle J B. J. Am. Chem. Soc., 1989, 111(24):8901-8911 doi: 10.1021/ja00206a020
Satyanarayana S, Dabrowiak J C, Chaires J B. Biochemistry, 1993, 32:2573-2584 doi: 10.1021/bi00061a015
Sun J, Shuo S, An Y, et al. Polyhedron, 2008, 27:2845-2850 doi: 10.1016/j.poly.2008.06.009
Liu J G, Ye B H, Li H, et al. J. Inorg. Biochem., 1999, 76:265-271 doi: 10.1016/S0162-0134(99)00154-3
Ding B, Yang E C, Zhao X J, et al. J. Coord. Chem., 2008, 23(61):3793-3799
Clérac R, Cotton F A, Dunbar K R, et al. Inorg. Chem., 1999, 38:2655-2657 doi: 10.1021/ic990006t

Scheme 1 Structure diagram of the complexes
M=Co (1), Ni(2); Other anions and ligands are omitted for clarity

Figure 1 Perspective view of complex 1 with ellipsoids drawn at 30% probability
Hydrogen atoms and counter-ion are omitted for clarity

Figure 2 Perspective view of complex 2 with ellipsoids drawn at 30% probability
Hydrogen atoms and counter-ion are omitted for clarity; Symmetry codes: a:-x+1/2, y+1/2, -z+1/2

Figure 3 (a) UV-visible spectra of complex 1 in the presence of different concentrations of CT-DNA; (b) Plot of cDNA/Eap versus cDNA for absorption titration of CT-DNA with complex 1
1: ccomplex=50 μmol·L-1; 2~6: complex+DNA, cDNA=8, 21, 43, 87, 175 μmol·L-1, respectively

Figure 4 (a) Emission spectra of EB bound to DNA in the presence of complex 1 of different concentration; (b) Stern-Volmer quenching plot of EB bound to DNA by complex 1
cEB=10 μmol·L-1, cDNA=25μmol·L-1; 1~6: ccomplex=0, 20, 40, 50, 60, 80 μmol·L-1, respectively

Figure 5 Cyclic voltammograms of complex 1 in the absence (a) and presence (b) of CT-DNA
ccomplex=0.3 mmol·L-1; cDNA=0.3 mmol·L-1; Buffer solution: 50 mmol·L-1 Tris-HCl/50 mmol·L-1 NaCl (pH=7.2); Scan rate: 0.1 V·s-1

Figure 6 Effects of increasing amounts of complex 1 on the relative viscosities of CT-DNA at (23±0.1) ℃
cDNA=0.1 mmol·L-1, r=ccomplex/cDNA

Figure 7 Agarose gel electrophoresis of pBR322 plasmid DNA in the presence of different concentrations of complex 1
DNA (0.5 μg·μL-1) with complex was incubated for 3 h in 50 mmol·L-1 Tris-HCl/NaCl buffer (pH=7.2) at 37 ℃; Lane 1~5: DNA+complex 1 (300, 200, 100, 50, 25 mol·L-1), respectively; Lane 6: DNA control

Figure 8 Gel electrophoresis diagram showing the cleavage of pBR322 DNA (0.5 μg·μL-1) by complex 1 at different scavenging agents in 50 mmol·L-1 Tris-HCl/NaCl buffer (pH=7.2) and 37 ℃ for 3 h
Lane 1~4: DNA+complex 1 (100 μmol·L-1)+5 mmol·L-1 EtOH, DMSO, KI, NaN3, respectively; Lane 5: DNA+complex 1 (100 μmol·L-1); Lane 6: DNA control

Figure 10 Magnetic susceptibility data for 2
Solid line represents the theoretical fit
Table 1. Crystal data and structure refinements for 1 and 2
| Complex | 1 | 2 |
| Empirical formula | C42H40O14N4F4Co3 | C40H46O14N4F4Ni3 |
| Formula weight | 1 077.57 | 1 058.94 |
| Crystal system | Triclinic | Monoclinic |
| Space group | P1 | P21/n |
| a/nm | 1.375 7(1) | 1.256 0(5) |
| b/nm | 1.607 2(1) | 1.306 4(5) |
| c/nm | 1.897 1(1) | 1.498 8(6) |
| α/(°) | 106.930(1) | |
| β/(°) | 94.018(1) | 113.406(5) |
| γ/(°) | 109.034(1) | |
| V/nm3 | 3.729 8(5) | 2.256 9(15) |
| Z | 3 | 2 |
| Dc/(g·cm-3) | 1.439 | 1.558 |
| μ/mm | 1.068 | 1.324 |
| F(000) | 1 647 | 1 092 |
| Crystal size/mm | 0.10×0.12×0.16 | 0.22×0.24×0.28 |
| T/K | 298 | 291 |
| θ range/(°) | 1.949~25.007 | 2.356~25.998 |
| Nref, Npar | 12 990, 902 | 4 436, 297 |
| Total reflection, unique (Rint) | 12 990, 12 990 (0.230 4) | 12 227, 4 436 (0.058 4) |
| Observed data[I > 2σ(I)] | 10 268 | 2 988 |
| R1, wR2, S | 0.106 7, 0.239 6, 1.156 | 0.058 4, 0.120 6, 1.025 |
| (Δρ)max, (Δρ)min/(e·nm-3) | 1 010, -1 190 | 331, -482 |
 下载: 导出CSV
Table 2. Selected bond lengths (nm) and angles (°) for complexes 1 and 2
| Complex 1 | |||||
| Col-01 | 0.l90 3(6) | Co2-0l0 | 0.205 4(7) | Co2-03 | 0.2l6 8(6) |
| Col-03 | 0.l90 l(6) | Co2-0l3 | 0.205 0(6) | Co2-04 | 0.207 7(6) |
| Col-07 | 0.l9l 5(7) | Co3-04 | 0.l93 4(6) | Co3-0ll | 0.l90 3(6) |
| Col-09 | 0.l92 0(6) | Co3-06 | 0.l9l 4(6) | Co3-0l4 | 0.l93 7(6) |
| Col-Nl | 0.l90 7(6) | Col-N2 | 0.l90 9(8) | Co3-N3 | 0.l92 6(7) |
| Co2-06 | 0.2l7 0(6) | Co2-0l | 0.207 2(6) | Co3-N4 | 0.l90 5(7) |
| Nl-Col-N2 | 94.9(3) | 03-Co2-0l3 | l60.l(2) | 04-Co3-06 | 83.7(2) |
| 0l-Col-03 | 82.2(2) | 04-Co2-06 | 74.3(2) | 04-Co3-0ll | 86.8(3) |
| 0l-Col-07 | 87.7(3) | 04-Co2-0l0 | 88.8(2) | 04-Co3-0l4 | 94.0(3) |
| 0l-Col-09 | 92.2(3) | 04-Co2-0l3 | 90.5(2) | 04-Co3-N3 | 89.8(3) |
| 0l-Col-Nl | 90.6(3) | 06-Co2-0l0 | l6l.7(2) | 06-Co3-N3 | l73.2(3) |
| 0l-Col-N2 | l74.2(3) | 06-Co2-0l3 | 85.2(2) | 06-Co3-N4 | 9l.7(3) |
| 03-Col-07 | 86.8(3) | 0l0-Co2-0l3 | 87.8(3) | 0ll-Co3-0l4 | l77.7(3) |
| 03-Col-09 | 93.7(3) | 0l-Co2-03 | 72.2(2) | 0ll-Co3-N3 | 94.5(3) |
| 03-Col-Nl | l72.8(3) | 0l-Co2-04 | l77.l(2) | 0ll-Co3-N4 | 93.2(3) |
| 03-Col-N2 | 92.4(3) | 0l-Co2-06 | l03.0(2) | 0l4-Co3-N3 | 87.7(3) |
| 07-Col-09 | l79.5(2) | 0l-Co2-0l0 | 94.0(2) | 0l4-Co3-N4 | 85.9(3) |
| 07-Col-N7 | 92.2(3) | 0l-Co2-0l3 | 90.2(2) | N3-Co3-N4 | 94.8(3) |
| 09-Col-N2 | 87.3(3) | 03-Co2-04 | l07.5(2) | 06-Co3-0ll | 87.0(3) |
| 09-Col-N6 | 86.2(3) | 03-Co2-06 | l07.5(2) | 06-Co3-0l4 | 90.9(3) |
| 07-Col-N2 | 93.9(3) | 03-Co2-0l0 | 84.2(2) | 04-Co3-N4 | l75.4(3) |
| Complex 2 | |||||
| Nil-0l | 0.l97 l(3) | Nil-Nl | 0.20l 4(4) | Ni2-04 | 0.20l 7(3) |
| Nil-02 | 0.l96 8(3) | Nil-N2 | 0.l98 l(4) | Ni2-04a | 0.20l 7(3) |
| Nil-03 | 0.203 7(3) | Ni2-0l | 0.206 5(3) | ||
| Nil-06 | 0.2l4 6(3) | Ni2-02 | 0.208 6(3) | ||
| 0l-Nil-06 | 90.49(l2) | 03-Nil-Nl | 90.59(l3) | 02-Ni2-04 | 90.35(ll) |
| 0l-Nil-02 | 82.37(l3) | 0l -Ni2-04a | 89.59(l2) | 04-Ni2-04a | l80.0 |
| 0l-Nil-03 | 9l.l8(l2) | 0l -Ni2-0la | l80.0 | 0la-Ni2-02a | 77.37(ll) |
| 0l-Nil-N2 | l70.64(l6) | 0l -Ni2-02a | l02.63(ll) | 0la-Ni2-04a | 90.4l(l2) |
| 02-Nil-03 | 9l.92(ll) | 0la-Ni2-02 | l02.63(ll) | 02a-Ni2-04a | 90.35(ll) |
| 02-Nil-06 | 93.07(l3) | 02-Ni2-02a | l80.0 | 02a-Ni2-04 | 89.65(ll) |
| 02-Nil-Nl | l72.59(l3) | 02-Ni2-04a | 89.65(ll) | Nil-0l-Ni2 | 97.l9(ll) |
| 0l-Nil-Nl | 90.6l(l5) | 0la-Ni2-04 | 89.59(l2) | Nil -02-Ni2 | 96.60(ll) |
| 03-Nil-06 | l74.9l(l3) | 02-Nil-N2 | 89.08(l3) | ||
| Symmetry codes: a: -x+1/2, y+1/2, -z+1/2 | |||||
下载: 导出CSV

 扫一扫看文章


扫一扫关注我们

 下载:
下载: