College of Materials Science and Engineering, Changsha University of Science & Technology, Changsha 410114, China
b.
Department of Chemistry and Shanghai Key Laboratory of Molecular Catalysis and Innovative Materials, Institute of New Energy, iChEM (Collaborative Innovation Center of Chemistry for Energy Materials), Fudan University, Shanghai 200433, China
c.
College of Materials Science and Engineering, Hunan University, Changsha 410082, China
d.
Department of Physics, City University of Hong Kong, Hong Kong 999077, China
Received Date:
01 December 2025 Accepted Date:
15 January 2026 Revised Date:
11 January 2026 Available Online:
15 August 2026
Abstract:
The iron-based pyrophosphate Na2FeP2O7 (NFPO) exhibits remarkable advantages including economic viability, exceptional structural stability, and outstanding safety characteristics. Nevertheless, the widespread implementation is fundamentally constrained by its poor inherent electronic conductivity and inadequate Na+ transport kinetics. This work employs a Cu doping strategy to achieve systematic electrochemical optimization through inducing local lattice distortions. The optimized Na2Fe0.97Cu0.03P2O7@C (0.03Cu-NFPO@C) composite delivers an impressive specific capacity of 91.32 mAh/g at 0.05 C and exhibits remarkable rate capability of 39.07 mAh/g at 50 C, whereas pristine NFPO@C merely provides 24.12 mAh/g. Furthermore, 0.03Cu-NFPO@C demonstrates extraordinary cycling stability, retaining 86.40% capacity after 12, 000 cycles at 40 C. Structural characterization through in-situ X-ray diffraction (XRD) and X-ray absorption spectroscopy (XAS) confirms that Cu doping effectively stabilizes the crystal framework, modifies Fe coordination environments and shortens Fe-O bond lengths. Theory calculations demonstrate that Cu doping reduces the band gap and lowers Na+ diffusion barriers, thereby optimizing intrinsic electronic conductivity and ion transport kinetics. This study introduces an innovative methodology for designing polyanionic cathodes, accelerating the commercialization of sodium-ion batteries for grid-scale energy storage.
The environmental impact and unsustainability of fossil fuels are driving the transition to clean energy systems, creating unprecedented demand for efficient energy storage technologies to support accelerated deployment of grid-scale renewables [1–3]. Although lithium-ion batteries (LIBs) have dominated in electronics and electric vehicles owing to their outstanding energy density, the scarcity and geographic limitations of lithium resources constrain their viability for large-scale application, prompting the search for more sustainable and cost-effective alternatives [4,5]. Sodium-ion batteries (SIBs), which have similar electrochemical working principles with LIBs, leverage abundant sodium resources and cost-effectiveness to demonstrate significant potential for medium/low-speed electric vehicles and grid-scale energy storage systems [6–9]. To develop low-cost and long-life SIBs, it is essential to find cathode materials that take into account the rapid sodium ion diffusion, low strain, and simple reaction processes [10,11]. Iron-based polyanion cathodes show significant potential for future SIBs applications due to their resource abundance, low cost, and strong structural stability [12,13]. Among them, Na4Fe3(PO4)2P2O7 (NFPP) has attracted significant attention for exceptional theoretical capacity and moderate operating voltage [14,15]. Unfortunately, the presence of electrochemically inert maricite-type NaFePO4 impurity and the difficulty in obtaining phase-pure NFPP significantly limit its practical applications [16–18]. In contrast, NFPO has garnered more interest due to its stable structure, excellent thermal stability, and ease of synthesis of pure phase [19]. NFPO is a triclinic crystal system, which is composed of FeO6 octahedron and P2O7 phosphate group formed by the angular shared PO4 tetrahedron to create a three-dimensional open structural framework, which creates multiple diffusion pathways for rapid Na+ migration [20–22]. The strong covalent P-O bond can effectively reduce the phase transition during cycling, and the volume change is only 2.6% [23,24]. Nevertheless, the poor inherent electronic conductivity of NFPO severely limits its rate performance, and this key defect needs to be solved urgently to realize its practical application value [25,26].
To address the bottleneck issue of poor electronic conductivity in NFPO, researchers mainly adopted two modification strategies: Carbon coating and ion doping. Zhou et al. developed an NFPO@C cathode material through a two-step carbon coating process, achieving a capacity of 95.2 mAh/g at 0.1 C and maintaining 95.3% capacity after 500 cycles at 5 C [27]. While carbon coating improves surface conductivity, doping elements into the Fe site is considered a more fundamental strategy to enhance intrinsic charge transport properties. Ren et al. successfully synthesized a composite material of Mg-doped modified NFPO using the solid-phase method. They found that the substitution of Mg for some Fe could effectively narrow the band gap and enhance electronic conductivity, thereby enhancing the carrier mobility, and this resulted in no significant capacity decay after 2000 cycles at 9 C [28]. However, the high-rate performance was still not satisfactory. Gao et al. fabricated a Co-doped NFPO composite with a continuous amorphous carbon coating, which significantly enhanced the Na+ transport kinetics of NFPO. This material demonstrated remarkable cycling stability, maintaining 79.9% capacity after 5000 cycles at 60 C [29]. While Co improves performance, its economic and environmental drawbacks motivate dopant substitution. Notably, Cu doping presents unique advantages as a modification strategy for polyanionic compounds, combining the dual benefits of enhancing electronic conductivity and contributing to specific capacity [17,30]. The ionic radius of Cu2+ (0.73 Å) is smaller than Fe2+ (0.78 Å), both belonging to the fourth period elements and sharing similar chemical properties [31,32]. This enables stable crystal structure formation through Fe-site substitution. Appropriate Cu doping can induce beneficial local lattice distortions without compromising structural integrity, thereby optimizing electronic band structure, mitigating internal stress, and reducing energy barriers, all of which contribute to enhanced electrochemical performance of NFPO [32]. However, systematic investigations of Cu doping effects on NFPO remain unreported to date, representing a promising yet unexplored research direction for NFPO performance optimization.
Hence, a series of Cu-doped cathode materials Na2Fe1-xCuxP2O7@C (x = 0, 0.01, 0.03, 0.05, 0.07) were successfully synthesized through a straightforward solid-state approach. The optimized Na2Fe0.97Cu0.03P2O7@C (0.03Cu-NFPO@C) demonstrates superior rate performance and exceptional cycling stability, delivering a capacity of 91.32 mAh/g at 0.05 C while maintaining 39.07 mAh/g at 50 C (62% enhancement versus undoped NFPO@C), with 86.40% capacity retention after 12, 000 cycles at 40 C. In-situ X-ray diffraction (XRD) analysis verifies the structural reversibility and robustness of 0.03Cu-NFPO@C during cycling. Combined X-ray absorption spectroscopy (XAS) and density functional theory (DFT) calculations reveal that Cu doping induces lattice distortion, modifies the Fe coordination environment, shortens Fe-O bond length and optimizes electron transport pathways. Consequently, the band gap narrows and the Na+ diffusion barrier decrease, directly enhancing intrinsic electronic conductivity and Na+ diffusion kinetics. This study not only furnishes novel insights into electronic/ionic regulation of polyanionic cathode materials but also lays a crucial theoretical foundation for developing next-generation SIBs.
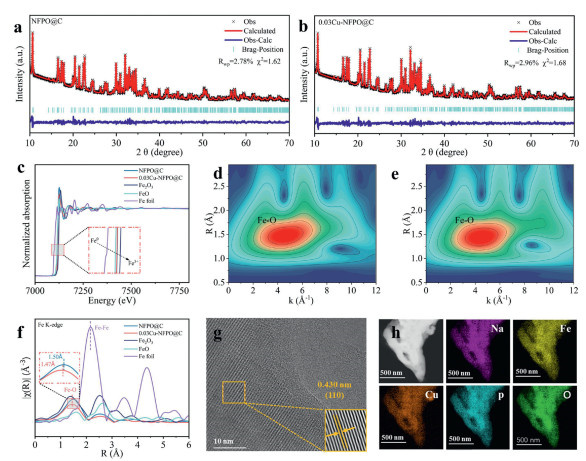
The XRD patterns of NFPO@C, 0.03Cu-NFPO@C and 0.07Cu-NFPO@C (Fig. S1 in Supporting information) indicate that the diffraction peaks match well with the standard card (PDF #80–2409), rendering a typical triclinic crystal structure (P-1 space group)[33]. Moreover, Cu doping does not introduce additional impurities and all samples maintain high purity. To precisely evaluate the impact of Cu doping on lattice parameters, XRD refinement of samples was carried out using GSAS software and good refinement results were obtained. The refinement profiles for NFPO@C, 0.03Cu-NFPO@C, and 0.07Cu-NFPO@C (Figs. 1a and b, Fig. S2 in Supporting information) show excellent agreement with experimental data, with detailed structural parameters summarized in Tables S1-S3 (Supporting information). With increasing Cu doping content, the lattice parameter a progressively increases while parameter b gradually decreases, reflecting lattice distortion [29]. Parameter c exhibits an increasing trend followed by a decrease, with 0.03Cu-NFPO@C showing the maximum c value (11.040 Å), while the c value of 0.07Cu-NFPO@C displays a slightly decrease (11.028 Å). The expansion of lattice parameter c indicates an increasing interlayer spacing, which facilitates sodium ion diffusion and consequently enhances rate performance. The phenomenon demonstrates that optimal Cu doping can effectively modulate crystal structure, promoting Na+ transport along both a-axis and c-axis directions, thereby optimizing electrochemical performance [29].
Figure 1
Figure 1.
(a, b) XRD Rietveld refinement of NFPO@C and 0.03Cu-NFPO@C. (c) XANES spectra of NFPO@C and 0.03Cu-NFPO@C. (d, e) Wavelet-transformed EXAFS spectra and (f) Normalized XANES spectra at Fe K-edge of NFPO@C and 0.03Cu-NFPO@C. (g) HRTEM and (h) EDS element mapping images of 0.03Cu-NFPO@C.
X-ray photoelectron spectroscopy (XPS) was employed to determine the oxidation states of Cu and Fe transition metals. As shown in Fig. S3a (Supporting information), the Cu 2p spectra of 0.03Cu-NFPO@C and 0.07Cu-NFPO@C exhibit distinct Cu 2p3/2 and Cu 2p1/2 peaks, indicating successful doping of Cu into the material, primarily in the form of Cu2+ [32,34]. The Fe 2p spectra (Fig. S3b in Supporting information) display characteristic spin-orbit doublets (Fe 2p3/2 and Fe 2p1/2). As shown in Table S4 (Supporting information), the binding energy of the main Fe 2p orbital peak gradually increases with higher Cu doping levels. This shift may be attributed to the substitution of Fe2+ by the smaller-radius Cu2+, leading to lattice distortion, thereby altering the chemical environment of Fe [28,35]. The detailed valence state and electronic structure of 0.03Cu-NFPO@C were further investigated through XAS. Fig. 1c shows the XANES spectra of NFPO@C, 0.03Cu-NFPO@C, reference standards Fe2O3, FeO and Fe foil. The Fe K-edge XANES spectra show both NFPO@C and 0.03Cu-NFPO@C resemble the FeO reference, confirming an average Fe valence state of +2. The FT-EXAFS spectra in R-space (Fig. 1f) reveal that Cu doping shortens the Fe-O bond length from 1.50 Å to 1.47 Å due to lattice contraction. This bond contraction facilitates faster electron transfer during electrochemical cycling [17,36]. Wavelet transform (WT) analysis of EXAFS data further corroborates the Fe-O coordination environment in 0.03Cu-NFPO@C (Figs. 1d and e).
To elucidate structural properties, fourier-transform infrared spectroscopy (FT-IR) was utilized to examine the materials (Fig. S4 in Supporting information). The vibrational bands at 739 cm-1 and 905 cm-1 arise from symmetric and asymmetric P-O-P stretching vibrations within the P2O74− units. Additionally, characteristic vibration frequencies associated with O-P-O bending (400–700 cm-1) and P-O stretching modes (1000–1300 cm-1) of PO43− groups are observed [27,28]. Subsequently, Raman spectroscopy (Fig. S5 in Supporting information) revealed two prominent peaks at 1380 cm-1 (D band) and 1580 cm-1 (G band), attributed to the carbon coating. The D band reflects disordered carbon structures from defects, whereas the G band represents graphitized carbon domains [37,38]. The ID/IG intensity ratio serves as an indicator of graphitization level, where lower values imply higher graphitic order. The calculated ratios (calculated from the integrated peak areas) for NFPO@C, 0.03Cu-NFPO@C, and 0.07Cu-NFPO@C are 2.430, 2.375, and 2.384, respectively, suggesting that Cu doping enhances carbon layer graphitization, particularly in 0.03Cu-NFPO@C, which exhibits the most ordered structure. This structural optimization correlates with improved electronic conductivity, as confirmed by four-probe measurements (Fig. S6 in Supporting information): NFPO@C (1.1 × 10⁻⁴ S/cm) versus 0.03Cu-NFPO@C (1.4 × 10⁻⁴ S/cm). Furthermore, thermogravimetric analysis (TGA) determined carbon contents of 7.68%, 6.98%, and 6.83% for NFPO@C, 0.03Cu-NFPO@C, and 0.07Cu-NFPO@C, respectively (Fig. S7 in Supporting information). The actual element compositions were checked by the Inductively coupled plasma (ICP). The Cu/Fe/P molar ratio of NFPO@C, 0.03Cu-NFPO@C and 0.07Cu-NFPO@C are calculated to be 1.0071:0:2.0000, 0.9787:0.0309:2.0000 and 0.9278:0.0703:2.0000, respectively, which is in close agreement with the designed stoichiometric ratio (Table S5 in Supporting information). Finally, surface area characterization via Brunauer-Emmett-Teller (BET) reveals values of 28.58, 30.42, and 30.17 m2/g (Fig. S8 in Supporting information). The larger surface areas contribute to enhanced interfacial contact and are closely associated with superior cycling performance.
Scanning electron microscopy (SEM) characterization reveals that all samples consist of uniformly dispersed nanoparticles with comparable particle sizes (Figs. S9a-c in Supporting information). The high-resolution transmission electron microscope (HRTEM) image in Fig. 1g clearly resolves lattice fringes in the bulk material, with an interplanar spacing of 0.430 nm corresponding to the (110) crystallographic plane. Fig. S9d (Supporting information) further demonstrates a conformal amorphous carbon layer coating the sample surface. This continuous carbon matrix establishes an interconnected conductive network that effectively mitigates the inherent poor electrical conductivity of the base material. Elemental mapping (Fig. 1h and Fig. S10 in Supporting information) confirms homogeneous distribution of Na, Fe, Cu, P, O, and C throughout the sample, with no compositional segregation observed. This verifies uniform Cu doping in the bulk phase without localized enrichment or phase separation.
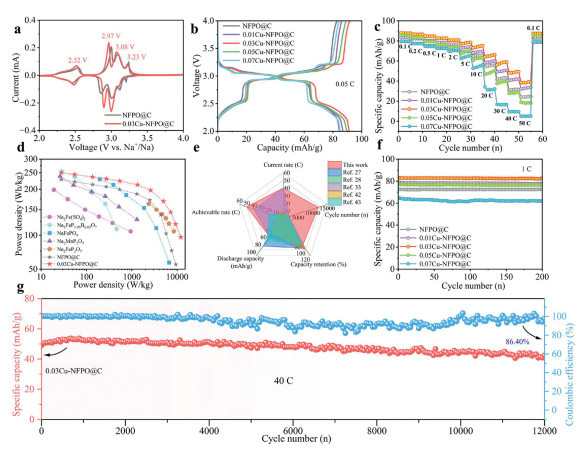
To assess the significant effect of Cu doped NFPO@C on the Na+ storage performance, the electrochemical behavior of all samples was measured within a 2.0–4.0 V voltage window. Fig. 2a displays the cyclic voltammetry (CV) profiles of as-prepared samples at a scanning rate of 0.1 mV/s. The CV curve of 0.03Cu-NFPO@C exhibits four distinct oxidation peaks at 2.52, 2.97, 3.08, and 3.23 V, consistent with reported results [29]. The low-voltage plateau near 2.5 V represents a single-phase reaction, whereas the three higher potential peaks are associated with two-phase transition processes [39]. The 0.03Cu-NFPO@C electrode demonstrates more negative oxidation peaks and more positive reduction peaks, indicating enhanced electrochemical reversibility and faster reaction kinetics compared to NFPO@C [40]. Fig. 2b presents the galvanostatic charge-discharge (GCD) curves of all samples at 0.05 C. Contrary to typical capacity degradation induced by heteroatom doping, moderate Cu doping significantly enhances the specific capacity. The discharge specific capacities of NFPO@C, 0.01Cu-NFPO@C, 0.03Cu-NFPO@C, 0.05Cu-NFPO@C, and 0.07Cu-NFPO@C at 0.05 C current density are 84.53, 86.93, 91.32, 89.59, and 84.96 mAh/g, respectively. The optimal 0.03Cu-NFPO@C displays the highest capacity with minimized voltage hysteresis, indicating reduced polarization and superior electrochemical performance. This enhancement originates from Cu doping-induced lattice distortion, which expands the unit cell volume while maintaining the open channels of the triclinic structure, thereby facilitating ion transport and charge transfer. Moreover, the electrochemically active copper participating in redox reactions contributes additional capacity. However, excessive Cu doping induces structural disorder, leading to capacity deterioration. Fig. 2c compares the rate performance of all samples. The specific capacities of 0.03Cu-NFPO@C at 0.1, 0.2, 0.5, 1, 2, 5, 10, 20, 30, 40, and 50 C are 87.94, 86.60, 84.87, 82.77, 80.63, 77.27, 73.16, 64.19, 56.10, 48.29, and 39.07 mAh/g, which are significantly superior to the undoped NFPO@C (only 24.12 mAh/g at 50 C), indicating a significant improvement in rate performance. As shown in Fig. 2d, the 0.03Cu-NFPO@C cathode exhibits an energy density of 250.00 Wh/kg (based on the active material mass), outperforming the NFPO@C (228.06 Wh/kg), outperforming most other reported polyanionic oxide cathodes [25,41].
Figure 2
Figure 2.
(a) CV curves of NFPO@C and 0.03Cu-NFPO@C. (b) GCD curves of all samples at 0.05 C. (c) Rate capability plots of all samples. (d) The relationship plots of energy density vs. power density for NFPO@C and 0.03Cu-NFPO@C. (e) Performance comparison of NFPO-based cathode materials with cutting-edge research reports. (f) Cycling performance at 1 C of all samples. (g) Cycling performance of 0.03Cu-NFPO@C at 40 C.
The optimized trace copper doping strategy significantly enhances the rate performance of NFPO, prompting systematic investigation into its overall performance. Compared to various reported NFPO-based SIB cathode materials, 0.03Cu-NFPO@C not only demonstrates superior rate capability and cycling stability but also exhibits competitive performance-to-cost ratio, offering a viable pathway for the development of high-performance and cost-effective sodium-ion battery cathode materials (Fig. 2e and Table S6 in Supporting information) [27,28,33,42,43]. After 200 cycles at 1 C (Fig. 2f), all samples exhibit excellent stability at 1 C, with 0.03Cu-NFPO@C demonstrating larger capacity output. In contrast, 0.07Cu-NFPO@C shows a significant capacity decline. At an extreme current density of 40 C, the capacity retention of 0.03Cu-NFPO@C is 86.40% after 12, 000 cycles (Fig. 2g). This performance markedly surpasses that of NFPO@C under identical testing conditions (Fig. S11 in Supporting information), directly confirming the beneficial role of Cu doping in enhancing the long-term cycling performance of NFPO-based materials. To directly verify the structural stability of 0.03Cu-NFPO@C during long-term cycling, we characterized the structure of the electrode before and after cycling at 40 C. The XRD patterns (Fig. S12 in Supporting information) show that all the characteristic peaks of NFPO are retained after cycling, with no obvious impurity peaks or peak shifts, indicating that the Na+ intercalation/deintercalation process is highly reversible and the lattice strain is minimal. The SEM images (Fig. S13 in Supporting information) indicate that the overall structure of the electrode remains intact, and no cracks or pulverization are observed in the secondary particles. These structural stability results are highly consistent with the excellent electrochemical performance of the material (Fig. 2g), confirming that the lattice distortion induced by Cu doping not only enhances the reaction kinetics but also significantly improves the structural tolerance of the material, forming a stable electrode framework.
Given the excellent performance of 0.03Cu-NFPO@C compared to other samples, CV tests were systematically performed at scanning rates ranging from 0.1 mV/s to 5 mV/s to deepen the analysis of Na+ diffusion kinetics. The minimum peak shift and sharp peak shape of 0.03Cu-NFPO@C indicate the best reversibility (Figs. S14a-c in Supporting information). According to the positive correlation relationship between the slope of the peak current of the CV curve and the square root of the scanning rate (ν1/2) and the Na+ diffusion coefficient (DNa+), 0.03Cu-NFPO@C exhibited the steepest slope in the fitted curve, confirming that it has the highest DNa+ (Fig. S14d in Supporting information). Electrochemical impedance spectroscopy (EIS) analysis (Fig. S15a in Supporting information) reveals Nyquist plots comprising a high-frequency semicircle (Rct) and a low-frequency Warburg impedance. The fitted Rct values of NFPO@C and 0.03Cu-NFPO@C are 380.3 and 177.1 Ω, respectively. The 0.03Cu-NFPO@C demonstrates a smaller Rct, suggesting a faster charge transfer, which contributes to exhibiting excellent Na+ storage. Furthermore, DNa+ correlates inversely with the squared Warburg factor (σ), derived from the slope of Z' vs. ω−1/2 (Fig. S15b and Table S7 in Supporting information). 0.03Cu-NFPO@C exhibits the smallest σ value, confirming superior DNa+ compared to NFPO@C.
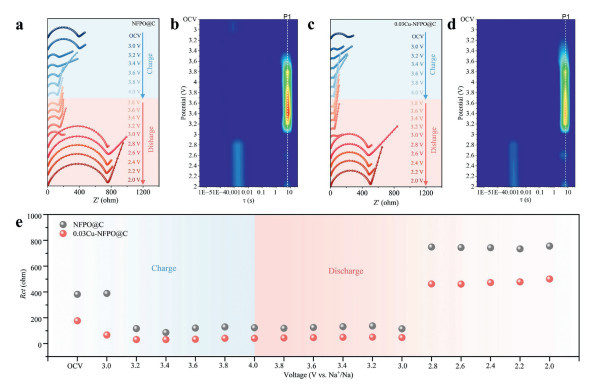
To further examine Rct evolution during cycling, in situ EIS was performed (Figs. 3a and c). The Rct of NFPO@C and 0.03Cu-NFPO@C shows a decrease during charging, which is followed by a gradual increase during discharge. Moreover, the detailed analysis of the in-situ EIS data yields distribution of relaxation times (DRT) plots (Figs. 3b and d). The peak at P1 corresponds to Na+ diffusion resistance [44]. During charging and discharging, the diffusion impedance initially increases and then decreases, indicating that the Na+ diffusion rate first declines before recovering. Notably, 0.03Cu-NFPO@C exhibits significantly lower diffusion impedance intensity compared to NFPO@C, demonstrating superior Na+ migration capability, which is consistent with the GITT results (Fig. S16 in Supporting information). Additionally, 0.03Cu-NFPO@C maintains significantly lower Rct values than pristine NFPO@C throughout the cycling, confirming accelerated interfacial charge-transfer kinetics (Fig. 3e). These results indicate that 0.03Cu-NFPO@C exhibits better diffusion kinetics by virtue of the structural advantages brought about by Cu doping. Therefore, the Cu doping strategy effectively enhances electronic conductivity while reducing sodium-ion diffusion resistance, thereby achieving both exceptional rate capability and stable capacity retention.
Figure 3
Figure 3.
(a, b) In-situ EIS Nyquist plots and the corresponding DRT of NFPO@C and (c, d) 0.03Cu-NFPO@C. (e) Comparison of charge transfer impedances at different potentials.
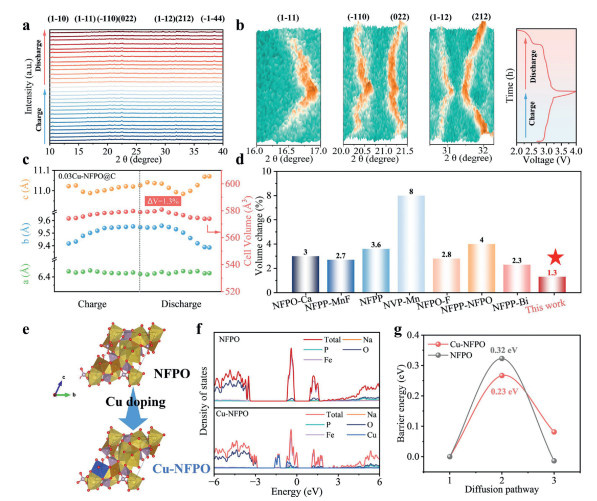
To deeply investigate the structural changes of 0.03Cu-NFPO@C during the Na+ extraction and insertion processes and further elucidate its superior electrochemical performance, in-situ XRD was conducted. As displayed in Fig. 4a, no new diffraction peaks emerge throughout the entire charge/discharge cycle. Fig. 4b clearly demonstrates that Na+ extraction during charging induces lattice distortion, causing the main diffraction peaks (11¯1), (1¯10) and (11¯2) to shift toward higher angles. Interestingly, the (022) and (212) diffraction peaks shift toward lower angles, which may be attributed to the deformation of P2O74− groups [31]. Notably, while peak angles shift during Na+ extraction, they fully recover to their original positions upon discharge, indicating that 0.03Cu-NFPO@C undergoes a continuous two-phase transformation process (including both biphasic and single-phase reactions), further demonstrating its exceptional structural reversibility [16,29]. The insertion and extraction of Na+ cause expansion and contraction of lattice parameters, which may affect cycling performance. To better explain the exceptional long-cycle life of 0.03Cu-NFPO@C, the variation of lattice parameters is carefully investigated. Fig. 4c shows no significant volume change during Na+ insertion and extraction, exhibiting only 1.3% volume expansion at the end of discharge. Compared with other polyanionic materials, this volume change is much smaller, demonstrating that its superior structural stability accounts for the outstanding cycling performance (Fig. 4d and Table S8 in Supporting information).
Figure 4
Figure 4.
(a) In-situ XRD patterns of 0.03Cu-NFPO@C during cycling. (b) 3D colormap surface of XRD patterns. (c) Lattice parameter evolution in 0.03Cu-NFPO@C cathode during charge/discharge processes. (d) Volumetric change comparison between 0.03Cu-NFPO@C and other polyanionic cathodes. (e) Optimized crystal structures before and after Cu doping. (f) DOS for NFPO and Cu-NFPO. (g) Energy barriers for Na+ migration.
DFT calculations were employed to gain fundamental understanding of the intrinsic ion transport kinetics and electronic conduction properties of Cu-doped NFPO@C. Fig. 4e displays the schematic crystal structures of NFPO@C and Cu-doped NFPO@C. The density of states (DOS) is illustrated in Fig. 4f. The electron contribution from Cu 2p and O 2p orbitals emerges near the Fermi level, inducing splitting of the Fe density of states around this energy region. Notably, the band gap undergoes substantial reduction, thereby enhancing intrinsic electronic conductivity. Furthermore, Na+ migration energy barrier within the lattice was evaluated using Climbing Image Nudged Elastic Band (CINEB) calculations. Compared to the 0.32 eV barrier in pristine NFPO@C along the identical diffusion pathway, Cu-doped NFPO@C exhibits a significantly lower migration barrier of 0.23 eV (Fig. 4g). This demonstrates that Cu doping effectively reduces Na+ diffusion energy barrier, which accelerates Na+ diffusion kinetics and improves electrochemical properties.
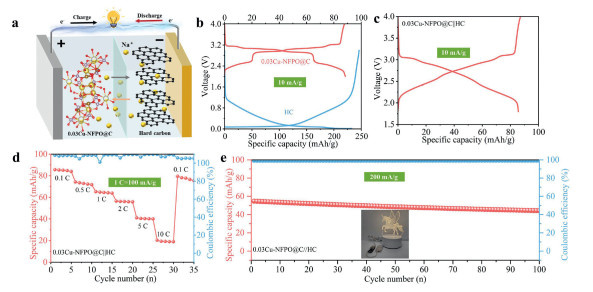
The remarkable electrochemical performance of 0.03Cu-NFPO@C underscore its value in engineering applications. Consequently, constructing a full-cell system for performance evaluation is imperative. As illustrated in Fig. 5a, a full cell was configured using a 0.03Cu-NFPO@C cathode and a hard carbon (HC) anode (0.03Cu-NFPO@C||HC). The GCD profiles of 0.03Cu-NFPO@C and HC electrodes in half-cells are presented in Fig. 5b. Fig. 5c displays the GCD curve of the full cell, achieving 85.66 mAh/g at 10 mA/g, corresponding to a high energy density of 147.14 Wh/kg based on the combined electrode mass. This full cell exhibits notable rate performance, achieving capacities of 65.23 mAh/g at 100 mA/g and 20.31 mAh/g at 1000 mA/g (Fig. 5d). Furthermore, the 0.03Cu-NFPO@C||HC full cell maintains 80.93% capacity retention after 100 cycles at 2 C, demonstrating excellent cycling stability (Fig. 5e). Notably, the full cell successfully powered a lamp (inset of Fig. 5e), highlighting its substantial potential for storage deployments.
Figure 5
Figure 5.
(a) Schematic of the 0.03Cu-NFPO@C||HC full cell. (b) Half-cell GCD curves for the 0.03Cu-NFPO@C and HC. (c) GCD curves of 0.03Cu-NFPO@C||HC at 10 mA/g (1.8–4.0 V). (d) Rate performance. (e) Cycling stability at 200 mA/g (inset: powered LED lamp).
In summary, this study effectively enhanced the structural and electrochemical characteristics of NFPO composites through a Cu-doping strategy, systematically revealing the regulatory mechanism of Cu-induced lattice distortion on inherent electronic conductivity and Na+ mobility. The optimized 0.03Cu-NFPO@C exhibits exceptional electrochemical properties, delivering a capacity of 91.32 mAh/g at 0.05 C and maintaining 39.07 mAh/g at 50 C (62% improvement over undoped NFPO@C), with 86.40% capacity retention after 12, 000 cycles at 40 C. In-situ XRD and XAS characterizations demonstrate that Cu doping shortens Fe-O bond length and induces only 1.3% unit cell volume variation during cycling processes, confirming superior structural stability. DFT calculations reveal that Cu 3p orbitals introduce new electronic states near the Fermi level, reducing both band gap and Na+ migration barrier. Furthermore, full cells constructed with 0.03Cu-NFPO@C cathode and HC anode demonstrate high-rate capability and long-term cyclability, validating the practical feasibility of this cathode material. This strategy of optimizing electronic conduction and ionic diffusion by regulating local lattice distortions offers a novel approach for developing polyanionic cathodes with ultra-high rate capability and extremely long cycle life, and has significant guiding significance for promoting the practical application of SIBs.
Declaration of competing interest
The authors declare that they have no known competing financial interests or personal relationships that could have appeared to influence the work reported in this paper.
Figure 1
(a, b) XRD Rietveld refinement of NFPO@C and 0.03Cu-NFPO@C. (c) XANES spectra of NFPO@C and 0.03Cu-NFPO@C. (d, e) Wavelet-transformed EXAFS spectra and (f) Normalized XANES spectra at Fe K-edge of NFPO@C and 0.03Cu-NFPO@C. (g) HRTEM and (h) EDS element mapping images of 0.03Cu-NFPO@C.
Figure 2
(a) CV curves of NFPO@C and 0.03Cu-NFPO@C. (b) GCD curves of all samples at 0.05 C. (c) Rate capability plots of all samples. (d) The relationship plots of energy density vs. power density for NFPO@C and 0.03Cu-NFPO@C. (e) Performance comparison of NFPO-based cathode materials with cutting-edge research reports. (f) Cycling performance at 1 C of all samples. (g) Cycling performance of 0.03Cu-NFPO@C at 40 C.
Figure 3
(a, b) In-situ EIS Nyquist plots and the corresponding DRT of NFPO@C and (c, d) 0.03Cu-NFPO@C. (e) Comparison of charge transfer impedances at different potentials.
Figure 4
(a) In-situ XRD patterns of 0.03Cu-NFPO@C during cycling. (b) 3D colormap surface of XRD patterns. (c) Lattice parameter evolution in 0.03Cu-NFPO@C cathode during charge/discharge processes. (d) Volumetric change comparison between 0.03Cu-NFPO@C and other polyanionic cathodes. (e) Optimized crystal structures before and after Cu doping. (f) DOS for NFPO and Cu-NFPO. (g) Energy barriers for Na+ migration.
Figure 5
(a) Schematic of the 0.03Cu-NFPO@C||HC full cell. (b) Half-cell GCD curves for the 0.03Cu-NFPO@C and HC. (c) GCD curves of 0.03Cu-NFPO@C||HC at 10 mA/g (1.8–4.0 V). (d) Rate performance. (e) Cycling stability at 200 mA/g (inset: powered LED lamp).


 DownLoad:

 下载:
下载:


 下载:
下载:

