Gel/nonwoven composite membrane with dual water transport pathways for controlling hydrogen production by regulating water vapor absorption and diffusion
Citation:
Siyi Zou, Ali Hammad, Jiahao Huang, Yuzhuo Jiang, Bin Tian, Fandi Ning, Wei Li, Qinglin Wen, Xingyu Zhu, Xiaochun Zhou. Gel/nonwoven composite membrane with dual water transport pathways for controlling hydrogen production by regulating water vapor absorption and diffusion[J]. Chinese Chemical Letters,
2026, 37(4): 111619.
doi:
10.1016/j.cclet.2025.111619
Gel/nonwoven composite membrane with dual water transport pathways for controlling hydrogen production by regulating water vapor absorption and diffusion
English
Gel/nonwoven composite membrane with dual water transport pathways for controlling hydrogen production by regulating water vapor absorption and diffusion
Received Date:
08 March 2025 Accepted Date:
21 July 2025 Revised Date:
12 July 2025 Available Online:
15 April 2026
Abstract:
Calcium hydride (CaH2) is a hydrogen storage material with high hydrogen storage density that is easy to transport and store. However, its hydrogen generation process is intense and liquid water causes uneven reactions in CaH2. These two issues make the reaction of CaH2 hard to control. To resolve the issues, a gel/nonwoven fabric composite material was prepared using nonwoven fabric and poly(vinyl alcohol)/polyacrylamide (PVA/PAM) hydrogel, and applied to a compact hydrogen generator. Water absorption and evaporation tests on composite membranes confirm that the membrane can control the water transport rate by adjusting the gel content, thereby regulating the hydrogen production of CaH2. During the hydrolysis of CaH2, the heat released promotes water evaporation, which absorbs some of this heat and helps maintain both temperature and water balance. When the gel content was 10%, the height of the separator was 1 mm, and the mass of CaH2 was 1.5 g, the hydrogen generator achieved the fastest hydrogen production rate of 58.7 mL/min. Moreover, after expanding the size of the hydrogen generator, it can continuously produce hydrogen for over 260 min at room temperature. Finally, hydrogen was supplied to a proton exchange membrane fuel cell (PEMFC) stack. This research provides a new concept for controllable hydrogen production and portable fuel cells.
Hydrogen energy is a promising secondary energy source for the 21st century. Due to its high energy density, zero pollution, ease of storage and transportation, it plays an important role in addressing the energy crisis, global warming, and environmental pollution [1,2]. Currently, the main hydrogen storage technologies include high-pressure gaseous hydrogen storage [3,4], low-temperature liquid hydrogen storage [5,6], metal hydride hydrogen storage [7,8], and electrocatalytic water splitting, which has been widely studied in recent years [9–12]. The first three methods generally require specific storage and transportation conditions, such as high pressure or low temperature [13], or high pressure and high temperature for hydrogen release [14], while electrocatalytic water splitting often faces issues such as low efficiency, and complex equipment. These drawbacks significantly increase the mass, volume, and energy consumption of the overall system, thereby reducing their portability and flexibility, and limiting the application of the above hydrogen storage and generation technologies in portable devices.
In comparison, hydride hydrolysis for hydrogen production offers a higher hydrogen storage density (3.8–18.4 wt%). Typical hydrides include LiAlH4, MgH2, NaH, NaBH4 and CaH2 [15,16]. Their hydrolysis reaction can quickly generate hydrogen under simple conditions [17]. This method avoids the complex conditions required during hydrogen storage and release, eliminates the need for specialized storage containers, and significantly reduces unnecessary volume and mass. At the same time, since hydrides are solid-state hydrogen storage materials, hydrogen leakage can be avoided during transportation and storage [18,19]. More importantly, the hydrolysis reaction of certain hydrides can achieve on-site, real-time hydrogen production and directly supply hydrogen to the equipment. Therefore, it may be one of the effective solutions for hydrogen storage, transportation, and supply to portable devices, especially portable PEMFCs [15,20].
In 2007, the U.S. Department of Energy (DOE) issued a "no-go" recommendation for NaBH4 hydrolysis systems due to their high cost and lack of effective regeneration methods [21]. Recent studies have achieved key breakthroughs in the regeneration of borohydrides. For example, their hydrolysis products can react directly with Mg-based reductants via ball milling under ambient conditions, reaching regeneration efficiencies of 68%−80% [22,23]. Or a closed-loop system further enhances sustainability by regenerating byproducts (MgO) and recovering hydrogen [24]. These advances provide strong technical support for the economic viability and recyclability of borohydride-based hydrogen storage systems. As for CaH2, it offers a natural cost advantage over other hydride materials since calcium is the fifth most abundant element in the Earth's crust. Moreover, the hydrolysis byproduct Ca(OH)2 can be regenerated into CaH2 through calcination followed by hydrogenation, forming a closed-loop cycle that aligns with the sustainability targets for hydrogen storage technologies of DOE. The hydrolysis reaction of hydrides, taking CaH2 as an example, is as follows (Eq. 1) [25]:
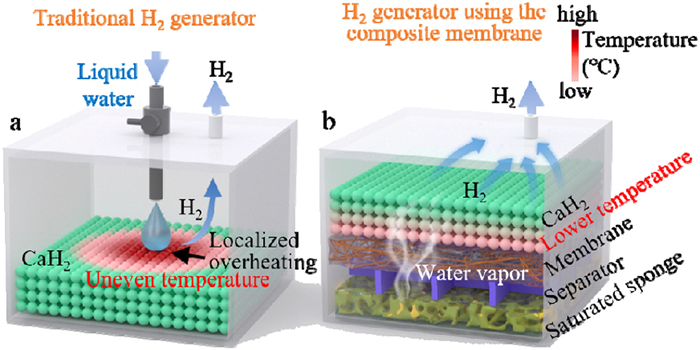
However, CaH2 reacts violently with water, making the reaction hard to control and posing significant safety risks [26,27]. To address this, research has focused on methods such as converting liquid water to vapor through heating or adding a valve to control the water flow [26]. However, they still rely on liquid water. The solid products formed from the reaction of liquid water with the hydrides can encapsulate the hydrides, reducing the flow of water and causing uneven water distribution. As a result, the contact area between water and the hydride becomes limited, which may lead to uneven hydrolysis reactions and cause localized overheating (Scheme 1a). Additionally, the system remains bulky and complex, failing to meet the requirements for portability. The main challenge now is to develop a compact hydrogen generator. It should be capable of controlling the reaction of hydrides, and improving both the uniformity and stability of the reaction.
Scheme 1
Scheme 1.
Schematic diagram of the hydrogen generators. (a) Schematic diagram of a traditional hydrogen generator based on the reaction between CaH2 and liquid water. (b) Schematic diagram of the hydrogen generator using the composite membrane.
Hydrogel, a highly absorbent polymer material plays roles in water storage, transport, and management in new energy applications (e.g., zinc-air batteries, fuel cell electrodes/electrolytes) [28–34]. However, most hydrogels undergo excessive volume shrinkage upon dehydration [35–37]. In contrast, the nonwoven fabric, with its high mechanical strength and porosity, not only facilitates the flow of water vapor but also serves as a support material to maintain the shape of the gel. In recent years, there has been a lot of research on composite materials made from hydrogels and nonwoven fabrics. They are commonly used in wastewater treatment and wound dressings [38], but their application in water transport control for hydrogen production is relatively rare.
In this study, a composite membrane was developed using nonwoven fabric and poly(vinyl alcohol)/polyacrylamide (PVA/PAM) hydrogel and applied to a portable hydrogen generator. The PVA/PAM hydrogel has a dual-crosslinked structure, which not only allows it to manage water effectively, but also provides high mechanical strength, durability, and stability. The membrane prevents direct contact between water and the CaH2, which serves as the hydrogen storage material in this research. Furthermore, the contact area between the water vapor and CaH2 is larger and more uniform than that of liquid water (Scheme 1b). Additionally, by adjusting the content of the gel, the water transport rate through the membrane can be altered, thereby regulating the hydrogen production rate of CaH2. Therefore, the composite membrane helps prevent localized overheating and excessive reactions during the hydrolysis of CaH2, thus enhancing the uniformity and controllability of the reaction.
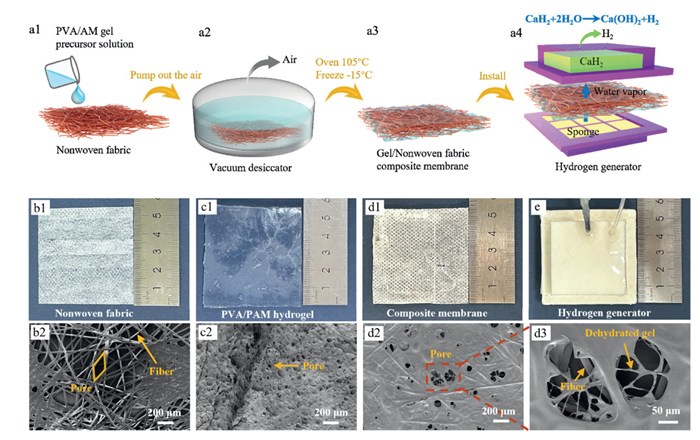
The composite membrane was prepared using PVA/PAM hydrogel and nonwoven fabric. First, a PVA/acrylamide (AM) gel precursor solution was cast onto the nonwoven fabric (Fig. 1a1) and placed in a vacuum desiccator to remove the air bubbles (Fig. 1a2). After 30 min, the nonwoven fabric was removed from the solution, and after filtering out the excess solution, it was placed in an oven at 105 ℃ for 20 min, then frozen overnight at −15 ℃ and thawed at room temperature. Finally, the PVA/PAM gel/nonwoven fabric composite membrane was obtained (Fig. 1a3). The hydrated composite membrane was assembled into a 3D-printed casing to construct the hydrogen generator (Fig. 1a4). CaH2 was wrapped in filter paper to prevent the powder from dispersing. And the water-saturated sponge provided the water vapor needed for the reaction with the CaH2. Please refer to Section SI-1 (Supporting information) for more details of the experiments.
Figure 1
Figure 1.
Preparation and characterization of the composite membrane. (a) Preparation of the composite membrane. (a1) The PVA/APM gel precursor solution is cast into the nonwoven fabric. (a2) The air is removed by vacuuming. (a3) The hydrated composite membrane. (a4) Install the composite membrane into the hydrogen generator. (b) Photograph and SEM image of the nonwoven fabric. (b1) Photograph of the nonwoven fabric. (b2) SEM image of the nonwoven fabric. (c) Photograph and SEM image of the PVA/PAM hydrogel. (c1) Photograph of the PVA/PAM hydrogel. (c2) SEM image of the PVA/PAM hydrogel. (d) Photograph and SEM image of the composite membrane. (d1) Photograph of the composite membrane. (d2) SEM image of the composite membrane. (d3) Magnified SEM image of (d2). (e) Photograph of the hydrogen generator.
According to the preparation process described above, the hydrogel matrix in the composite membrane is composed of PVA/PAM and does not exhibit ion selectivity. Due to the absence of sulfonic acid groups or other proton-conducting moieties, the proton conductivity is relatively low. Therefore, the composite membrane has minimal influence on H+ transport and does not interfere with the hydrogen release process.
Fig. 1b1 shows a photo of a 5.5 × 5.5 cm2 nonwoven fabric from an activated carbon mask. It appears as a soft, ultra-thin, and porous membrane with a white color. As seen in its SEM image in Fig. 1b2, the nonwoven fabric is composed of randomly arranged fibers, with pore sizes ranging from tens to hundreds of micrometers. Fig. 1c1 shows a photograph of the water-saturated PVA/PAM hydrogel with a gel content of 10% and an area of 5.5 × 5.5 cm2. However, the volume of the gel will shrink seriously after drying (Fig. S8b in Supporting information). As shown in the SEM image of the gel in Fig. 1c2, compared to the nonwoven fabric, the PVA/PAM gel with a gel content of 10%, also has many pores, but the pore sizes are much smaller, typically ranging from a few micrometers to several tens of micrometers. This porous structure helps the gel absorb water more effectively.
Fig. 1d1 shows a photograph of the dried composite membrane with 10% gel content (hereafter referred to as the 10% composite membrane) and an area of 5.5 × 5.5 cm2. Due to the volume shrinkage that occurs during the gel drying process, the surface of the membrane appears slightly uneven. However, compared to the dried gel, the volume shrinkage of the composite membrane is not significant. This is because the nonwoven fabric used as the substrate has strong shape retention capability. Its SEM image (Fig. 1d2) indicates that the dried gel adheres to the nonwoven fabric fibers, and due to the volume shrinkage of the gel, some pores are exposed. Fig. 1d3 is an enlarged view of the pores shown in Fig. 1d2, where the underlying nonwoven fabric fibers can be seen to be exposed after drying. Additionally, as the gel content decreases, its volume shrinkage becomes more severe, resulting in a greater number of exposed pores (Fig. S9 in Supporting information). This structure allows water vapor to be transmitted both through the pores of the nonwoven fabric in the composite membrane and by diffusion through the gel within the membrane. Fig. 1e shows the outer shell of the hydrogen generator, which was self-designed and 3D printed. The overall dimensions of the outermost surface measure 5.5 × 5.5 cm2. The specific details will be discussed in the following sections.
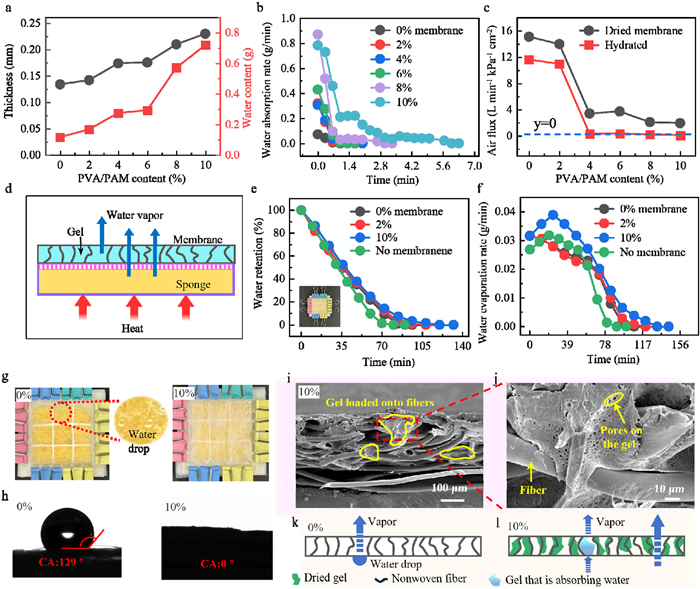
The water absorption performance of the composite membrane is crucial for water transport through the membrane. To illustrate the effect of gel swelling on membrane structure, microscopic images of composite membranes with varying gel contents in dried and hydrated states are provided in Fig. S10 (Supporting information). As the gel content increases, swelling upon hydration leads to a progressive reduction in membrane porosity. Meanwhile, the thickness of the hydrated membrane was measured in Fig. 2a. The membranes are very thin, with a thickness not exceeding 0.23 mm. As the gel content increases, the thickness of the membrane also increases. From the SEM images of the dried membranes (Fig. S9), it can be observed that at gel contents of 2% and 4%, the gel adheres to the fibers, with some of it forming a membranous structure that fills the fiber pores. However, when the gel content is 6% or higher, the high viscosity reduces the flowability of the gel, causing part of the gel to cover the fiber surface in a membranous form, which increases the thickness of the composite membrane. The gel content of the membrane not only affects its thickness but also influences its water absorption performance. As shown in Fig. 2a, the higher the gel content in the membrane, the greater its water content. The 10% composite membrane has the highest water content, reaching 0.72 g. The main reason is that for a composite membrane with the same surface area, a higher gel content increases the thickness of the membrane, allowing it to incorporate more hydrogel and, consequently, absorb more water.
Figure 2
Figure 2.
Water absorption and evaporation properties of the composite membranes with different gel contents. (a) Thickness and water content of the composite membranes. (b). Water absorption rate of the composite membranes. (c) Gas flux of the composite membranes in both dried and hydrated states. (d) Water evaporation schematic diagram of the evaporation device using hydrated composite membranes at 80 ℃. (e) Water retention rate of the evaporation device. (f) Water evaporation rate of the evaporation device. (g) Photos of the evaporation device during the evaporation process. (h) Contact angles of composite membranes. (i) Cross-sectional SEM image of the 10% composite membrane. (j) Magnified SEM image of (i). (k) Schematic diagram of water transmission through the 0% membrane. (l) Schematic diagram of water transmission through the 10% membrane.
At the same time, the water absorption rates of different membranes were tested. As shown in Fig. 2b, with the increase in gel content, the water absorption rate of the membrane improves. The 10% composite membrane can achieve a maximum water absorption rate of 0.78 g/min at room temperature. This is attributed to the fact that a higher gel content causes more gel to adhere to the nonwoven membrane, thereby enabling the composite membrane to absorb more water in the same amount of time. In addition, as the gel content increases, the hydrophilicity of the composite membrane also increases, which enables the membrane to absorb water more quickly (as will be explained in detail below).
To gain a deeper understanding of the gas permeability of composite membranes with different gel contents, the gas flux of different membranes in both dried and hydrated states was tested, as shown in Fig. 2c. Similarly, because the gel absorbs water and expands, covering the pores of the nonwoven fabric, the gas flux of the hydrated membrane will be lower than that of the dried membrane, indicating that it has poorer gas permeability. As the gel content increases, there is more solid material within the membrane pores and on the membrane surface (Fig. S10). This results in a greater number of obstructed nonwoven fabric pores, leading to a dramatic decrease in gas permeability.
Evaporation performance is also a crucial property for absorbent materials. Especially for hydrogen generators using CaH2 as the hydrogen source. To test the effect of the composite membranes with different gel contents on the evaporation rate of water from the sponge, an evaporation device was designed. The membranes were placed over the surface of the device and sealed around the edges to control the water evaporation rate from the sponge inside the device. The specific calculation and testing methods can be found in Section SI-2 (Supporting information). As shown in Fig. 2d, the evaporation device is heated at 80 ℃. A water-saturated composite membrane was used to control the evaporation rate of water in the bottom sponge. During the evaporation process, the device loses not only the water in the sponge but also the moisture inherent in the membrane. Fig. 2e shows the variation of residual water (moisture content) in the evaporation device over time during the heating process. The content of residual water in the evaporation device refers to the ratio of the remaining moisture content at different times to the moisture content in the device when fully water-saturated.
When the surface of the device is not covered by the composite membrane, the content of residual water decreases the fastest over time. After applying composite membranes with different gel contents, the residual water content in the device increased, and the performance exhibited was similar. However, due to the significantly higher water content of the 10% composite membrane itself, compared to the 0% and 2%, the evaporation device using the 10% composite membrane actually evaporated more water within the same period, indicating that the membrane has better water transport capability (Fig. S14e in Supporting information). Fig. S14h (Supporting information) further supports this point. When the dried membranes are used, the content of residual water in the evaporation device decreases as the gel content increases and the content of residual water of the 10% composite membrane is the lowest. The evaporation rates of the evaporation device at different time points are shown in Fig. 2f. As the gel content increases, the evaporation rate of the device also increases. The evaporation rate of the 10% composite membrane is the highest, with a maximum value of 0.04 g/min.
To investigate the reason why higher gel content in the membrane leads to faster evaporation rates, the entire evaporation process of the devices using hydrated composite membranes with different gel contents was photographed. Fig. 2g shows a snapshot taken during the evaporation process of the device using different membranes. More photos can be found in Fig. S15 (Supporting information). As shown in the photos, after the evaporation device has been heated for a period of time, the membrane partially dehydrates. Small water droplets appear on the surfaces of the 0% composite membranes on the side close to the sponge. Over time, these droplets gradually disappear, and both the membrane and the sponge become dry. In contrast, the surface of the 10% composite membrane did not show any small water droplets during the heating period of the device.
To explore the reasons for this phenomenon, the contact angles of composite membranes with different gel contents after drying were measured. As shown in Fig. 2h and Fig. S16 (Supporting information), the contact angle of pure nonwoven fabric is 129°, indicating it is hydrophobic, as the nonwoven fabric is derived from activated carbon masks and has undergone hydrophobic treatment. Its hydrophobicity can effectively prevent the water in the sponge from easily penetrating the membrane. As the gel content increases, the hydrophilicity of the membrane gradually enhances. When the gel content reaches 10%, the membrane can fully absorb the water droplet in about 44 s. This is because the PVA in the gel exhibits strong hydrophilicity, and the increase in PVA content significantly enhances the hydrophilicity of the membrane, while also increasing the interaction between the gel and water. Additionally, the membrane itself is very thin (with a thickness < 0.23 mm), making it easier for the 10% composite membrane to absorb and diffuse water [39]. Fig. 2i shows the cross-sectional SEM image of the 10% composite membrane, revealing its internal structure. As illustrated in Fig. 2i, the dried gel adheres to the fibers of the nonwoven fabric. Due to the volume contraction of the gel after drying, some fiber pores become exposed. Fig. 2j is a magnified SEM image of Fig. 2i, clearly showing numerous pores on the gel with diameters of a few micrometers. This structure helps the membrane to absorb water quickly and facilitate water transfer.
Based on the above experiments, the mode of water vapor transport through the composite membranes with different gel contents was determined. When the gel content is 0% and 2%, the gel hardly fills the pores of the nonwoven fabric. When the water vapor reaches the surface of the membrane, due to the large amount of vapor and the hydrophobic nature of the membrane, the pores in the membrane cannot allow all the vapor to pass through quickly enough, causing some of the vapor to condense into water droplets on the membrane surface, which then migrate to the external environment through the pores of the nonwoven fabric (Fig. 2k). When the gel content exceeds 4%, the hydrated composite membrane is heated to dehydrate, causing the gel volume to shrink and exposing the pores of the nonwoven fabric fibers. Some of the water vapor is adsorbed by the gel and then transported to the external air due to the high temperature and concentration gradients, while another portion directly passes through the pores of the nonwoven fabric into the external environment. Owing to the strong hydrophilicity of the 10% composite membrane, the intermolecular interactions between the membrane and water are also the strongest. As a result, water vapor is rapidly adsorbed by the gel within the membrane, preventing the formation of water droplets (Fig. 2l).
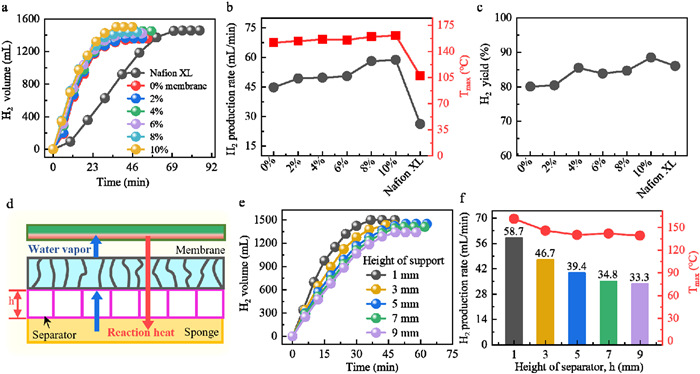
Subsequently, a compact hydrogen generator was developed utilizing the characteristic of composite membranes which can control the transport of water vapor. The entire device is printed using a 3D printer. It consists of three components: a sponge chamber with a separator, a composite membrane, and a CaH2 chamber. The details of the device are shown in Fig. S17 (Supporting information), with an effective reaction area of 4 × 4 cm2. Due to the small amount of water contained in the membranes and their sufficiently thin structure, they are prone to water loss. When the moisture in the membrane turns into vapor and diffuses into the CaH2, the hydrolysis reaction of CaH2 begins immediately. This explains why, as shown in Fig. 3a, the hydrogen generator using the composite membrane has a significantly higher initial reaction rate compared to those using a standard commercial water transport membrane (Nafion XL membrane). The specific hydrogen production performance of Nafion membranes can be found in Figs. S5-S7 (Supporting information).
Figure 3
Figure 3.
The effects of gel content in composite membranes and evaporation pathways on hydrogen production. (a) Volume of hydrogen produced by the hydrogen generator using different membranes changes over time. (b) Hydrogen production rate and maximum reaction temperature of the hydrogen generator using different membranes. (c) Hydrogen yield of the hydrogen generator using different membranes. (d) Schematic diagram of water vapor and heat transfer through the composite membrane. (e) Volume of hydrogen produced by the hydrogen generator using separators of different heights changes over time. (f) Hydrogen production rate and maximum reaction temperature of the hydrogen generator using separators of different heights.
When using composite membranes with different gel contents, all hydrolysis reactions take no > 50 min. Moreover, the higher the gel content, the shorter the reaction time. The device using the 10% composite membrane achieved a hydrogen release of 1000 mL/g within 36 min, with a performance comparable to, or even surpassing, that of some specially treated metal-based composite materials [40–42]. This is related to the gel content in the membrane, the higher the gel content, the faster the water absorption rate of the membrane (Fig. 2b) and the evaporation rate of water in the sponge chamber (Fig. 2f). This leads to a faster transmembrane transport of water, resulting in a higher concentration of water vapor in the CaH2 chamber, which in turn increases the reaction rate. More importantly, the hydrogen generator using the composite membranes can ensure that two-thirds of the time during the hydrogen production process is stable (as indicated by the straight portion of the curve). This is because the composite membrane absorbs water vapor and then releases it, which slows down the reaction rate between CaH2 and water. Moreover, water vapor, compared to liquid water, increases the contact area with CaH2, preventing local overheating and instability during the reaction.
The slope obtained by fitting the nearly linear portions of the curves in Fig. 3a, which represent the stable hydrogen production phase, corresponds to the hydrogen production rate (Fig. S18 in Supporting information). This rate is represented by the black curve in Fig. 3b. The red curve shows the variation in the maximum temperature within the device during the hydrogen production process with different membranes. As shown in Fig. 3b, it is clear that the hydrogen production rate and maximum reaction temperature of the hydrogen generator are significantly higher than those of the device using the commercial Nafion XL membrane. Moreover, the higher the gel content in the membrane, the faster the hydrogen production rate and the higher the maximum reaction temperature. The device using the 10% composite membrane achieves the fastest hydrogen production rate of 58.7 mL/min, with a stable hydrogen production time exceeding 20 min, and the maximum reaction temperature reaching 161.4 ℃. Additionally, the hydrogen yield of the hydrogen generators can reach over 80% as shown in Fig. 3c (1.5 g CaH2). Among them, the device using the 10% composite membrane achieves the highest yield, reaching 88.5%. Owing to its superior hydrogen production rate and yield, this membrane was selected for further investigation.
In addition to the gel content of the membrane, the evaporation pathway also affects hydrogen production efficiency. Therefore, a 3D-printed separator was used to isolate the membrane from the sponge, ensuring a consistent distance between the water and the membrane, as well as a uniform water vapor evaporation pathway throughout the reaction. Fig. 3d illustrates a schematic diagram of the pathways for the transport of water vapor and reaction heat through the membrane. Water in the sponge is supplied to CaH2 through the membrane. The reaction between water and CaH2 releases a large amount of heat, which raises the temperature of the sponge and promotes its evaporation. Since evaporation is an endothermic process, it absorbs some of the heat, thereby achieving a dynamic balance of temperature and water transfer within the system. To investigate the specific effect of the distance from water to the composite membrane on the hydrogen generation performance of the hydrogen generator, separators with heights of 1, 3, 5, 7, and 9 mm were designed and 3D printed (Fig. S21a in Supporting information), and these separators were subsequently used in the hydrogen production experiments.
The hydrogen production performance using these separators is shown in Fig. 3e. As the separator height increases, the volume of hydrogen produced increases more slowly over time. Moreover, the first two-thirds of all the curves are nearly linear, indicating that the hydrogen generator using the composite membrane produces hydrogen stably with a relatively constant rate. Fig. 3f presents a bar chart illustrating the hydrogen production rates of the hydrogen generator during the stable production phase (for specific data, refer to Fig. S22 in Supporting information). The red curve represents the trend of the maximum reaction temperature during the CaH2 hydrolysis reaction as a function of separator height. It can be observed that as the separator height increases, the hydrogen production rate of the hydrogen generator decreases, and the maximum reaction temperature correspondingly decreases. This is because the increased distance between the water and the membrane leads to a reduction in the efficiency of water and heat transfer, which slows down the hydrogen production rate of CaH2 and the reaction temperature. Therefore, the separator with a height of 1 mm, which exhibited the highest reaction rate, was chosen as the basis for subsequent hydrogen production research.
Considering practical operation and application, portable hydrogen generators typically need to react at room temperature, and in most cases, they must provide hydrogen for fuel cell stacks rather than just individual cells. Therefore, the hydrogen generator must have a sufficiently high hydrogen production rate at room temperature. As shown in Figs. S31a-c (Supporting information), the size of the hydrogen generator was increased, expanding the effective reaction area of the device from the 4 × 4 cm2 to 7 × 7 cm2, while also enlarging the area of the composite membrane from 5.5 × 5.5 cm2 to 9 × 9 cm2. However, the height of the large-sized hydrogen generator remains only 22 mm, ensuring its portability. Additionally, the mass of CaH2 has been increased from 1.5 g to 5 g.
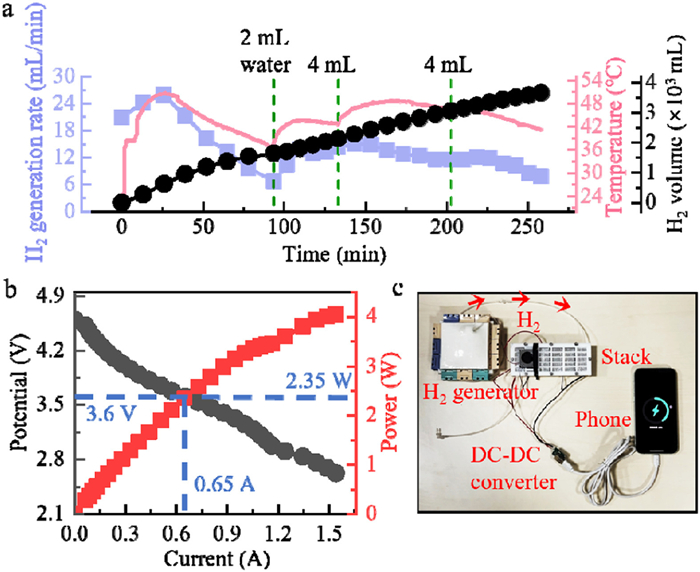
Next, the long-term hydrogen production stability of the large-sized hydrogen generator at room temperature was tested. The sponge inside the hydrogen generator was dried, and then, at room temperature, 2 mL of water was injected into the sponge chamber using a syringe. When the reaction rate of CaH2 significantly decreased, another 2 mL of water was injected, and this process was repeated while simultaneously recording the temperature changes during the reaction, as shown in Fig. 4a. The black curve represents the change in hydrogen volume over time, which is nearly linear, indicating that the reaction is relatively stable. The red and blue curves represent the changes in reaction temperature and hydrogen production rate over time, respectively. After each decrease in reaction rate and subsequent water injection, the rate would increase again. With this operation, the device was able to stably produce hydrogen for over 260 min, demonstrating the long-term stability of hydrogen production using a large-area composite membrane in the hydrogen generator.
Figure 4
Figure 4.
Evaluation and application of a large-sized hydrogen generator using the composite membrane. (a) Long-term hydrogen production capacity of the large-sized hydrogen generator. (b) Polarization curve of the fuel cell stack when supplied with hydrogen from the large-sized hydrogen generator. (c) A photo of a large-sized hydrogen generator supplying hydrogen to a fuel cell stack, which then charges a mobile phone.
To verify the practicality of the hydrogen generator using the composite membrane, the large-sized hydrogen generator was then connected to a PEMFC stack to provide hydrogen. Fig. 4b shows the polarization curve of the stack. It can be seen that the peak power of the stack can reach 4 W, and when the voltage is 3.6 V, the current can reach 0.65 A, resulting in a power of 2.35 W. This demonstrates that the hydrogen generator successfully supplied hydrogen to the PEMFC stack. To further demonstrate the application value of this hydrogen generator, it was applied to a mobile phone. As shown in Fig. 4c, after the hydrogen generator supplied hydrogen to the stack, the stack successfully charged the mobile phone. This indicates that a gel/nonwoven fabric composite membrane was successfully developed and integrated into a compact hydrogen generator to regulate water vapor transport, thereby enhancing both the controllability and uniformity of the CaH2 reaction.
In this study, a gel/nonwoven fabric composite membrane was prepared using nonwoven fabric and PVA/PAM hydrogel, and then applied in a compact hydrogen generator. Nonwoven fabric is used to enhance the structural stability of the composite membrane, while the gel regulates the water transport rate of the membrane by varying its content, thereby controlling the hydrogen production of CaH2. During the hydrolysis of CaH2, the reaction heat promotes water evaporation, which absorbs some of this heat and helps maintain both temperature and water balance. When the gel content of the composite membrane was 10%, the separator height was 1 mm, and the CaH2 mass was 1.5 g, the hydrogen generator achieved the highest production rate of 58.7 mL/min. After expanding the size of the hydrogen generator, it can continuously produce hydrogen for over 260 min at room temperature. Finally, the large-sized hydrogen generator effectively provided hydrogen to the PEMFC stack. In summary, the composite membrane can not only make the hydrogen production process more uniform, but also effectively controls the hydrogen production rate of the hydrogen generator. Given that this hydrogen generator features controllable reactions, a compact size, and sustained hydrogen production, it is expected to have broad application prospects in portable fuel cell systems.
Declaration of competing interest
The authors declare that they have no known competing financial interests or personal relationships that could have appeared to influence the work reported in this paper.
CRediT authorship contribution statement
Siyi Zou: Writing – review & editing, Writing – original draft, Visualization, Validation, Project administration, Methodology, Investigation, Formal analysis, Data curation, Conceptualization. Ali Hammad: Data curation. Jiahao Huang: Data curation. Yuzhuo Jiang: Visualization. Bin Tian: Data curation. Fandi Ning: Conceptualization. Wei Li: Data curation. Qinglin Wen: Data curation. Xingyu Zhu: Data curation. Xiaochun Zhou: Conceptualization.
Acknowledgments
This work was supported by the National Natural Science Foundation of China (No. 22402225), the Science and Technology Foundation of Jiangsu Province (No. BK20240472), the Guangdong Basic and Applied Basic Research Foundation (No. 2023A1515111133), the Gusu Innovation and Entrepreneurship Leading Talent Plan (No. ZXL2023193), the Sinano talents plan (No. 2022000175), and CAS H2 Technology (Suzhou) Co., Ltd. (No. E341150301). The authors are grateful for the technical support for Nano-X from Suzhou Institute of Nano-Tech and Nano-Bionics, Chinese Academy of Sciences (SINANO) and also thank Prof. Jianwu Dai and Dr. Longwei Li for their assistance in the experiments.
Supplementary materials
Supplementary material associated with this article can be found, in the online version, at doi:10.1016/j.cclet.2025.111619.
M. Huang, L. Ouyang, Z. Chen, et al., Int. J. Hydrogen Energy 42 (2017) 22305–22311. doi: 10.1016/j.ijhydene.2016.12.099
Scheme 1
Schematic diagram of the hydrogen generators. (a) Schematic diagram of a traditional hydrogen generator based on the reaction between CaH2 and liquid water. (b) Schematic diagram of the hydrogen generator using the composite membrane.
Figure 1
Preparation and characterization of the composite membrane. (a) Preparation of the composite membrane. (a1) The PVA/APM gel precursor solution is cast into the nonwoven fabric. (a2) The air is removed by vacuuming. (a3) The hydrated composite membrane. (a4) Install the composite membrane into the hydrogen generator. (b) Photograph and SEM image of the nonwoven fabric. (b1) Photograph of the nonwoven fabric. (b2) SEM image of the nonwoven fabric. (c) Photograph and SEM image of the PVA/PAM hydrogel. (c1) Photograph of the PVA/PAM hydrogel. (c2) SEM image of the PVA/PAM hydrogel. (d) Photograph and SEM image of the composite membrane. (d1) Photograph of the composite membrane. (d2) SEM image of the composite membrane. (d3) Magnified SEM image of (d2). (e) Photograph of the hydrogen generator.
Figure 2
Water absorption and evaporation properties of the composite membranes with different gel contents. (a) Thickness and water content of the composite membranes. (b). Water absorption rate of the composite membranes. (c) Gas flux of the composite membranes in both dried and hydrated states. (d) Water evaporation schematic diagram of the evaporation device using hydrated composite membranes at 80 ℃. (e) Water retention rate of the evaporation device. (f) Water evaporation rate of the evaporation device. (g) Photos of the evaporation device during the evaporation process. (h) Contact angles of composite membranes. (i) Cross-sectional SEM image of the 10% composite membrane. (j) Magnified SEM image of (i). (k) Schematic diagram of water transmission through the 0% membrane. (l) Schematic diagram of water transmission through the 10% membrane.
Figure 3
The effects of gel content in composite membranes and evaporation pathways on hydrogen production. (a) Volume of hydrogen produced by the hydrogen generator using different membranes changes over time. (b) Hydrogen production rate and maximum reaction temperature of the hydrogen generator using different membranes. (c) Hydrogen yield of the hydrogen generator using different membranes. (d) Schematic diagram of water vapor and heat transfer through the composite membrane. (e) Volume of hydrogen produced by the hydrogen generator using separators of different heights changes over time. (f) Hydrogen production rate and maximum reaction temperature of the hydrogen generator using separators of different heights.
Figure 4
Evaluation and application of a large-sized hydrogen generator using the composite membrane. (a) Long-term hydrogen production capacity of the large-sized hydrogen generator. (b) Polarization curve of the fuel cell stack when supplied with hydrogen from the large-sized hydrogen generator. (c) A photo of a large-sized hydrogen generator supplying hydrogen to a fuel cell stack, which then charges a mobile phone.

 DownLoad:

 下载:
下载:


 下载:
下载:
